Funnel Diagram
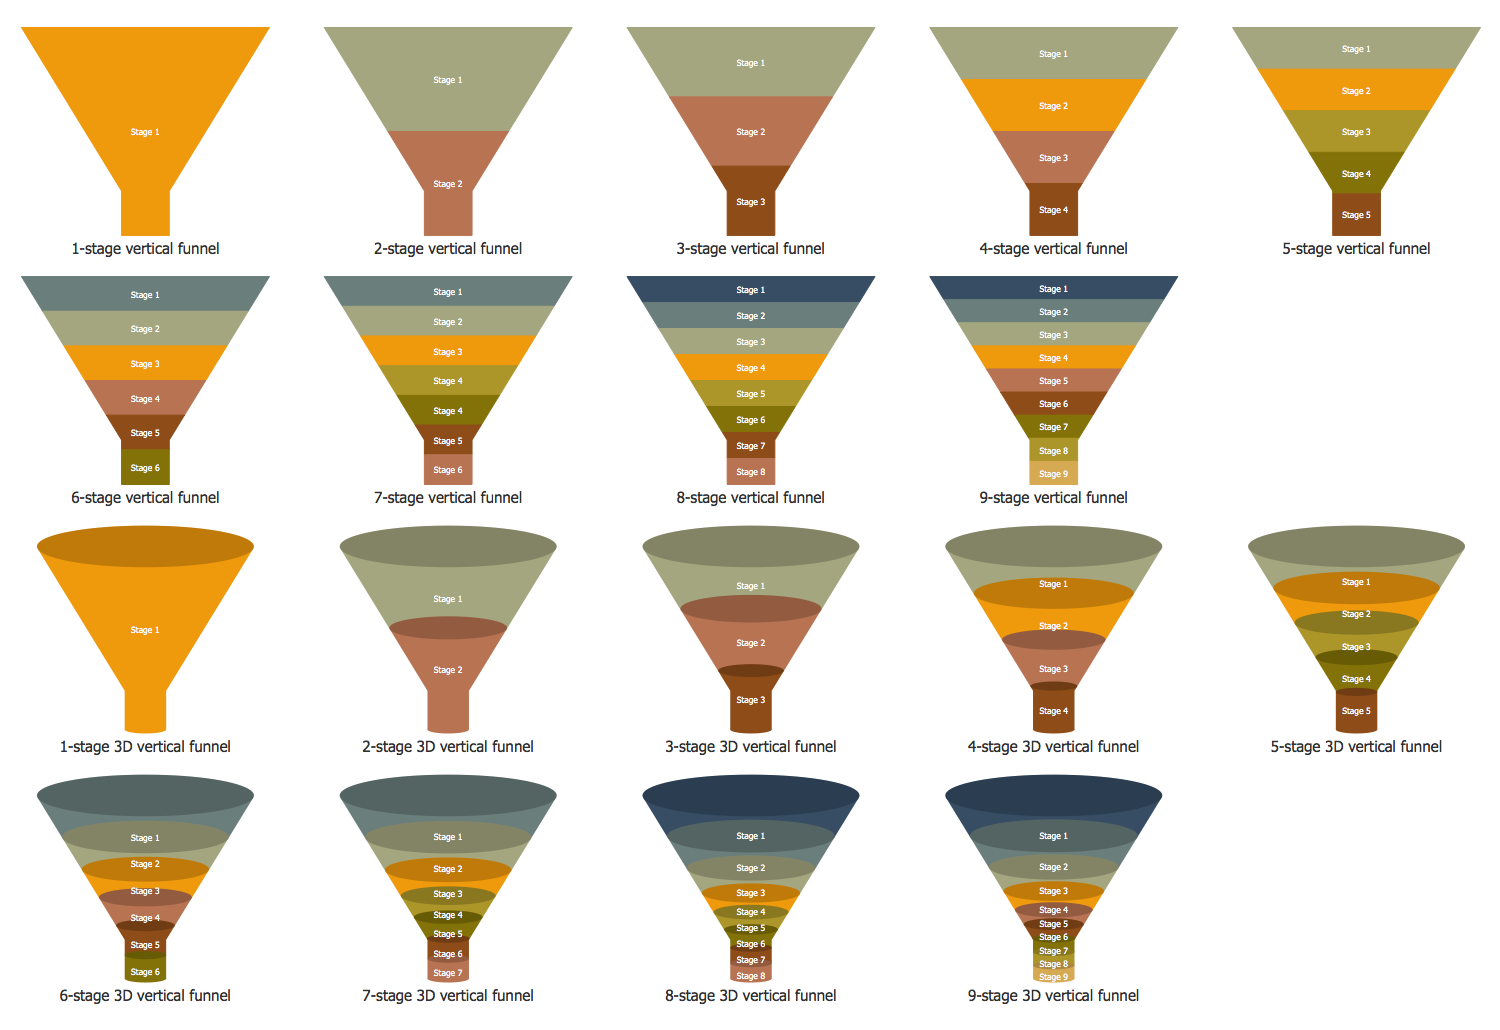
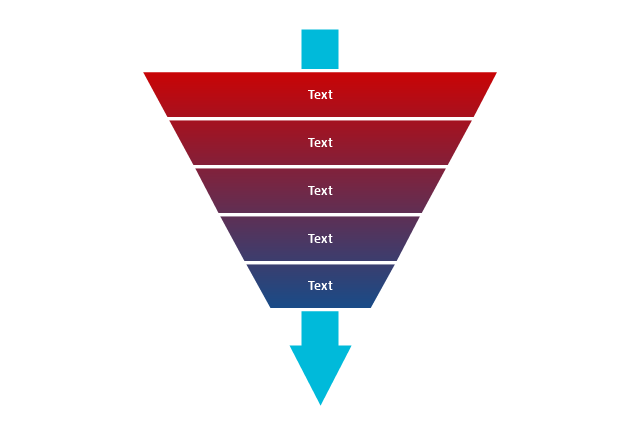
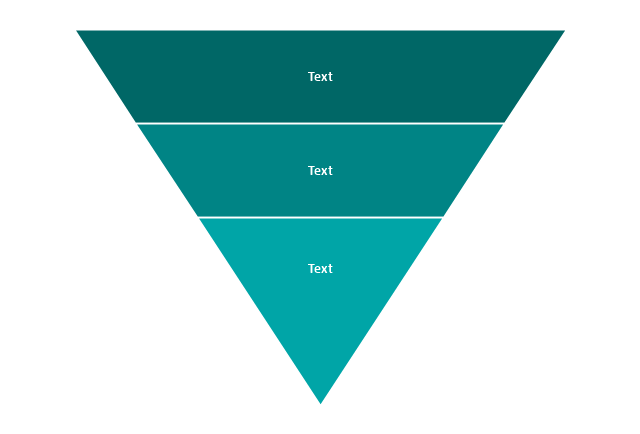
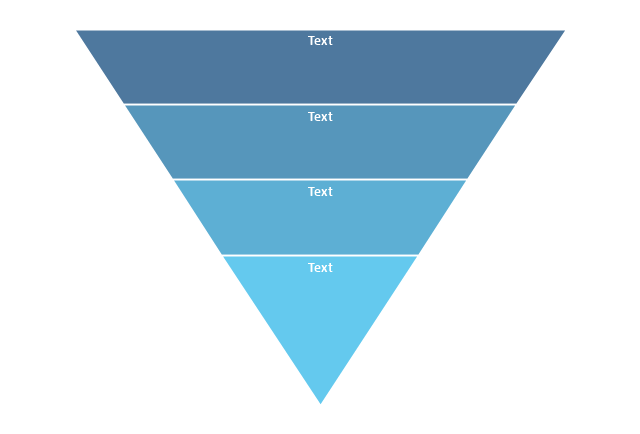
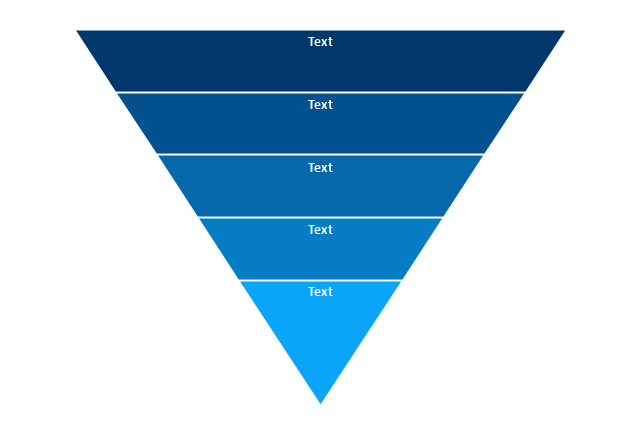
Funnel diagram can be also known as a funnel chart being similar to a stacked percent bar chart. This drawing is a type of chart that can be often used in order to represent the stages in some sales process. It can be also used for showing the amount of potential revenue for each of the described stages.In order to make a funnel diagram, the Funnel Diagrams solution can be used while working in the ConceptDraw DIAGRAM diagramming and drawing software. Having the pre-made design elements as well as the examples of funnel diagrams, the Funnel Diagrams solution allows any ConceptDraw DIAGRAM user to make their own unique as well as professionally-looking drawings.
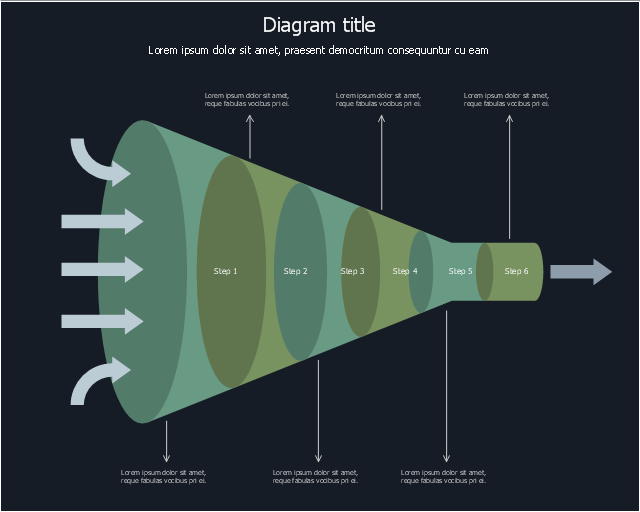
This is funnel diagram template.
Use it to design your funnel diagrams with ConceptDraw PRO software.
The marketing diagram template "6-stage 3D horizontal funnel" is included in Funnel Diagrams solution from Marketing area of ConceptDraw Solution Park.
Use it to design your funnel diagrams with ConceptDraw PRO software.
The marketing diagram template "6-stage 3D horizontal funnel" is included in Funnel Diagrams solution from Marketing area of ConceptDraw Solution Park.
This is funnel diagram template.
Use it to design your funnel diagrams with ConceptDraw PRO software.
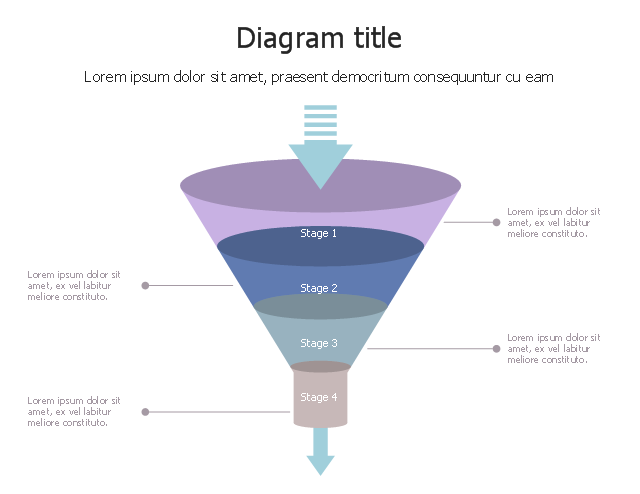
The marketing diagram template "4-stage 3D vertical funnel" is included in Funnel Diagrams solution from Marketing area of ConceptDraw Solution Park.
Use it to design your funnel diagrams with ConceptDraw PRO software.
The marketing diagram template "4-stage 3D vertical funnel" is included in Funnel Diagrams solution from Marketing area of ConceptDraw Solution Park.
This is funnel diagram template.
Use it to design your funnel diagrams with ConceptDraw PRO software.
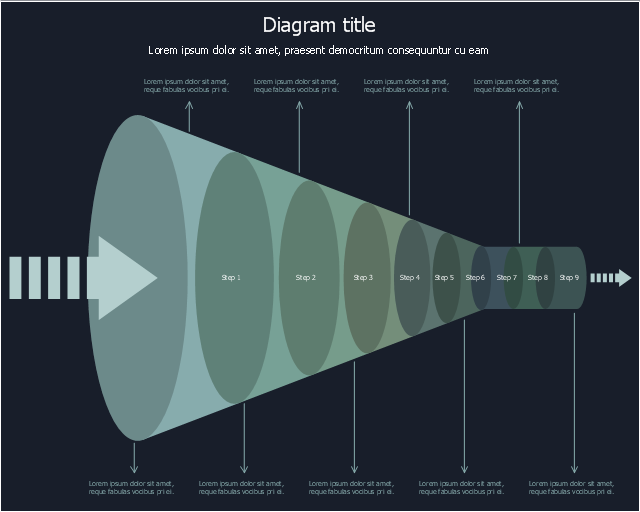
The marketing diagram template "9-stage 3D horizontal funnel" is included in Funnel Diagrams solution from Marketing area of ConceptDraw Solution Park.
Use it to design your funnel diagrams with ConceptDraw PRO software.
The marketing diagram template "9-stage 3D horizontal funnel" is included in Funnel Diagrams solution from Marketing area of ConceptDraw Solution Park.
HelpDesk
How to Draw a Pyramid Diagram
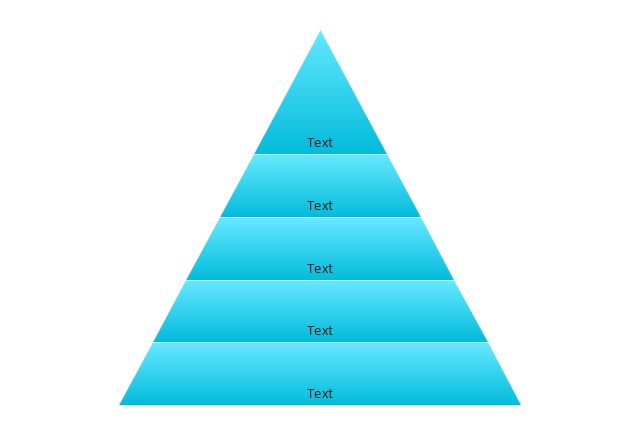
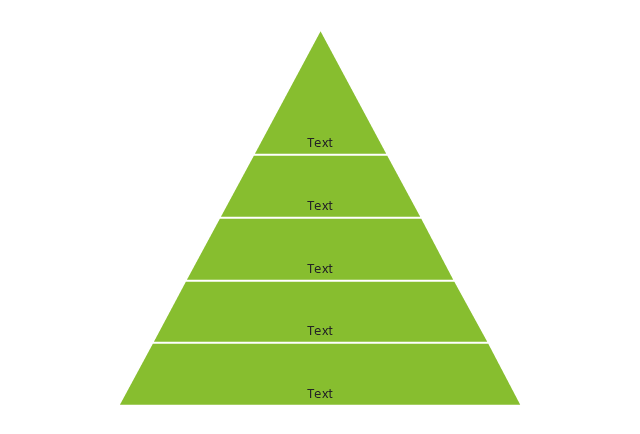
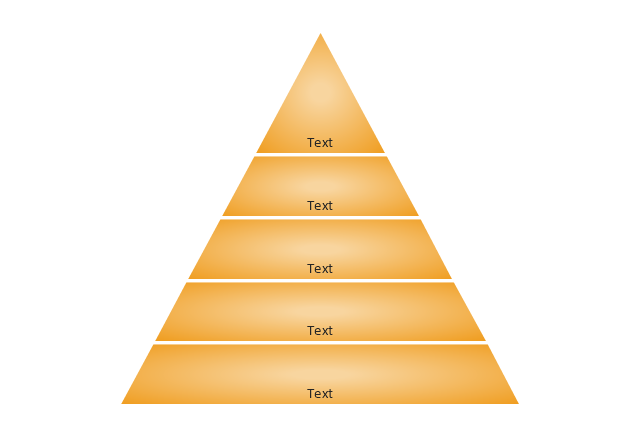
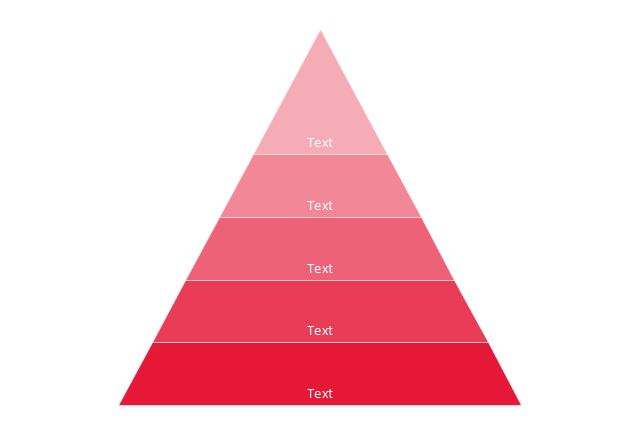
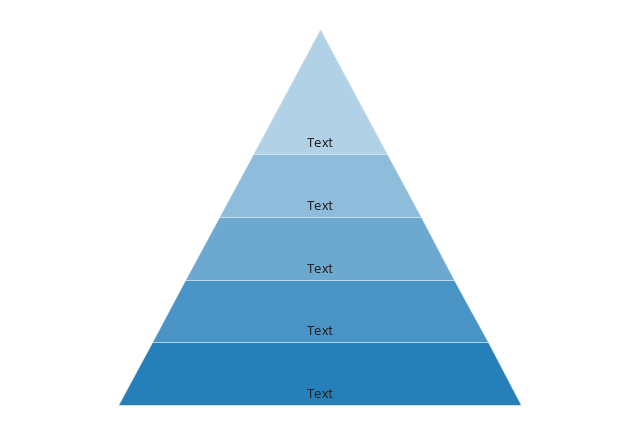
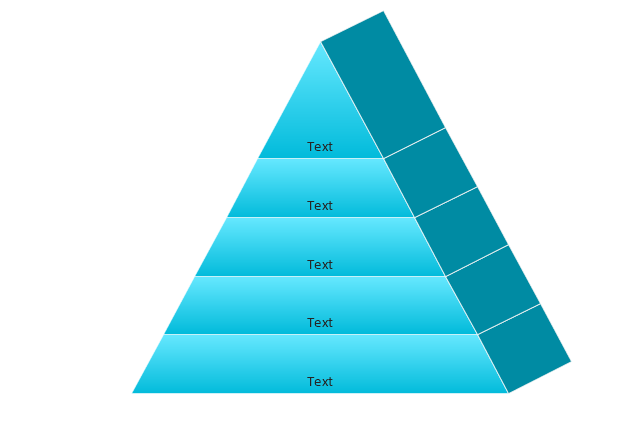
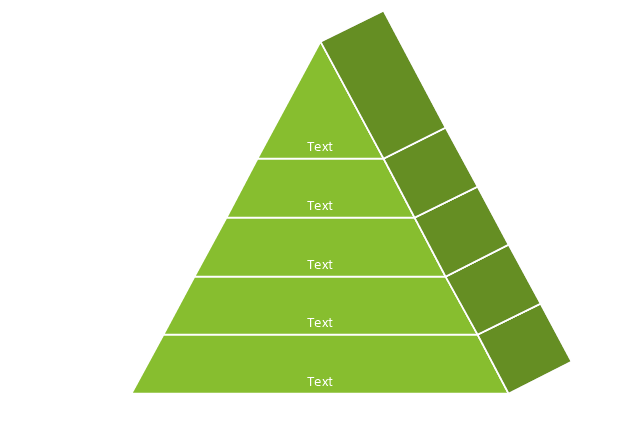
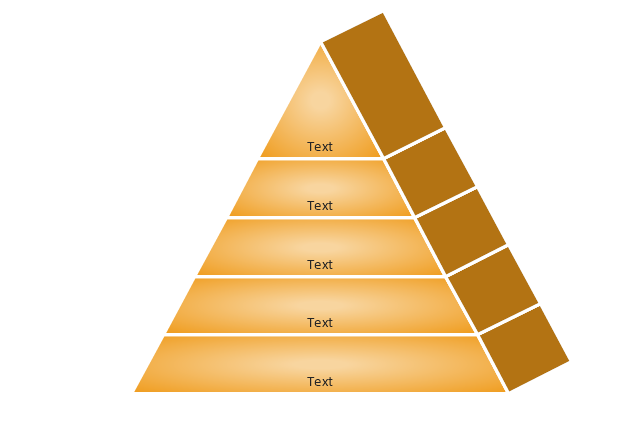
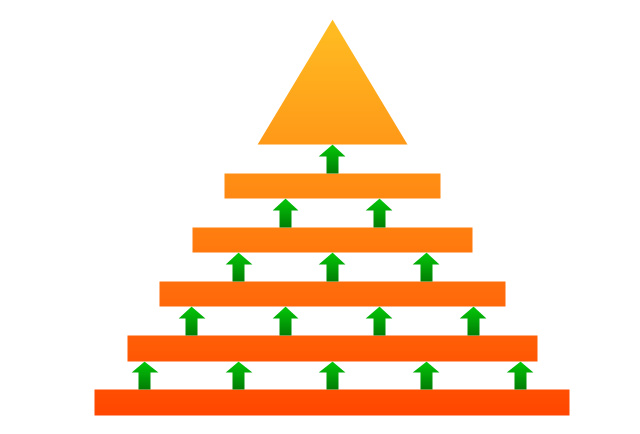
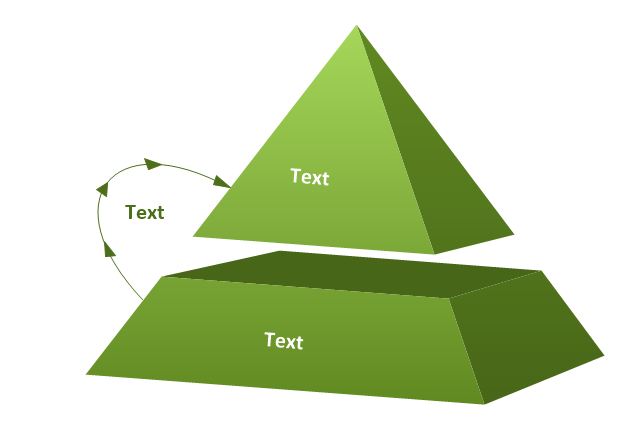
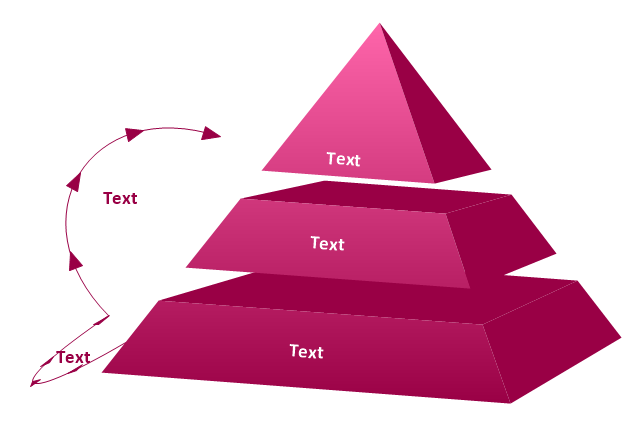
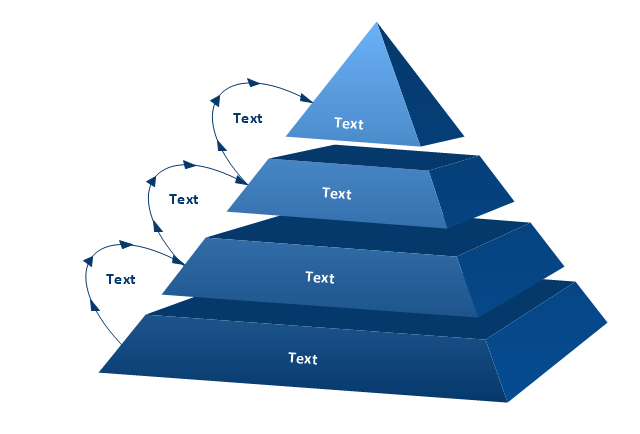
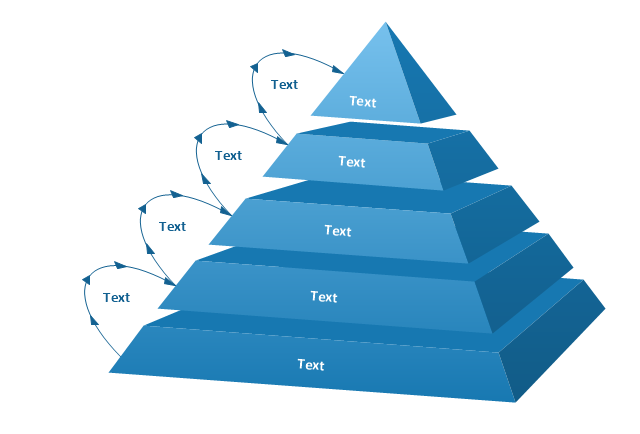
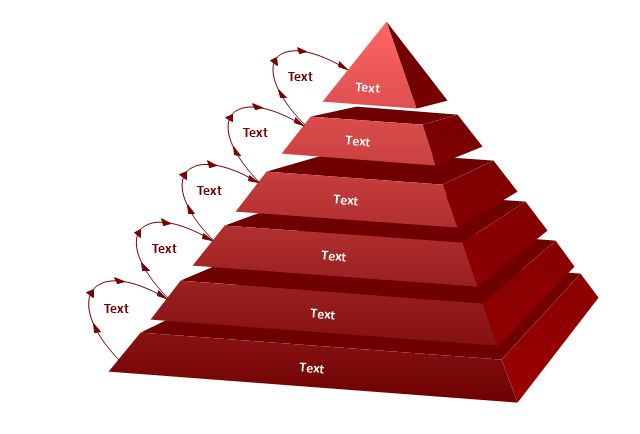
Pyramid diagram (triangle diagram) is used to represent data, which have hierarchy and basics. Due to the triangular form of the diagram, each pyramid section has a different width. The width of the segment shows the level of its hierarchy. Typically, the top of the pyramid is the data that are more important than the base data. A pyramid scheme can be used to show proportional and hierarchical relationships between some logically related items, such as departments within an organization, or successive elements of any process. This type of diagram is often used in marketing to display hierarchically related data, but it can be used in a variety of situations. ConceptDraw DIAGRAM allows you to make a pyramid diagram, quickly and easily using special libraries.Pyramid Diagram
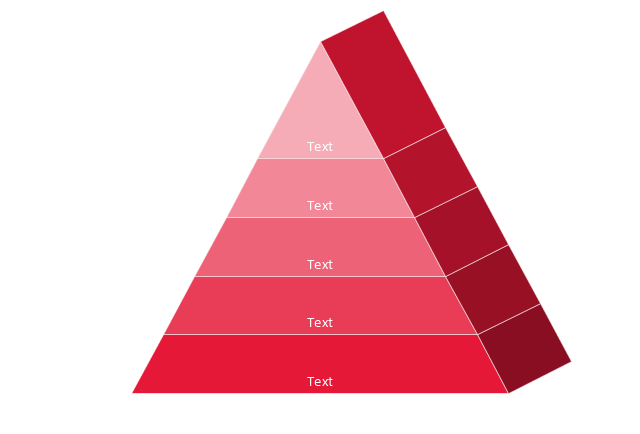
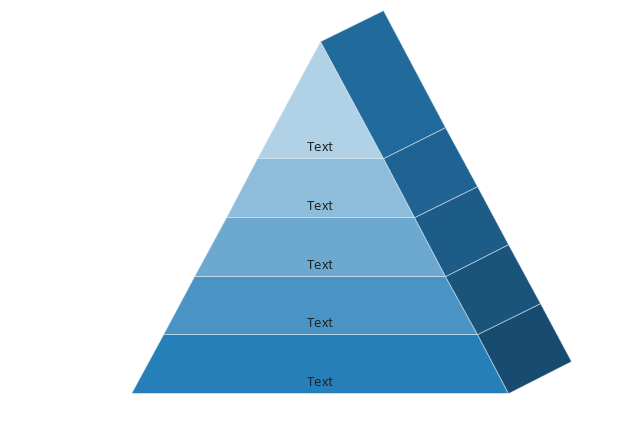
Pyramid diagrams help you visualize information as a triangle divided into horizontal slices. Labelled slices represent a hierarchy. Pyramids are used in marketing presentations to show and analyze hierarchy levels. 3D triangular diagram of DIKW pyramid has 6 levels: measurement, facts, data, information, knowledge, wisdom. The data component include different scattered signs or symbols which are merely useless until these random objective facts are somehow processed. Data is a resource which has to be manipulated or rearranged to get useful. Information can be extracted from a pile of data, it also can be mined from different data storages.Chart Templates
Easy charting software comes with beautiful chart templates and examples. This makes it easy to create professional charts without prior experience.The vector stencils library "Pyramid diagrams" contains 28 templates of pyramid diagrams, triangle charts and triangular schemes.
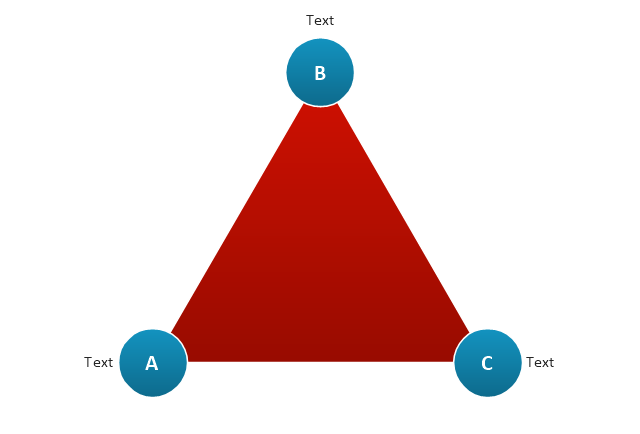
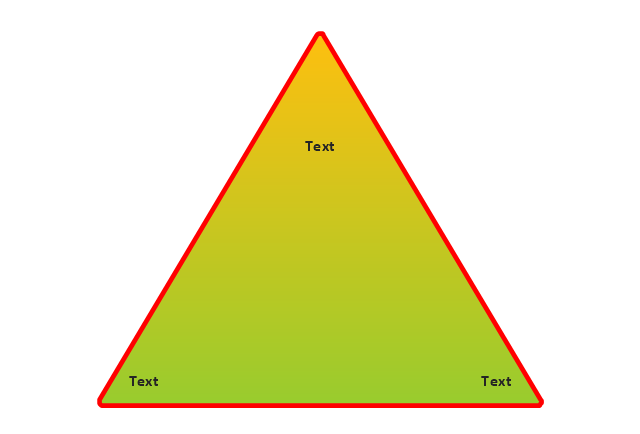
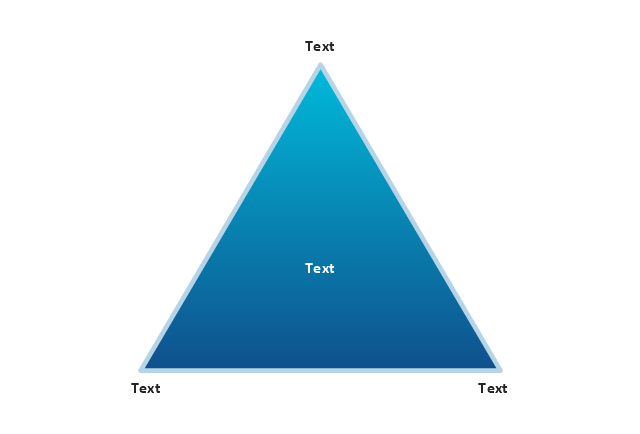
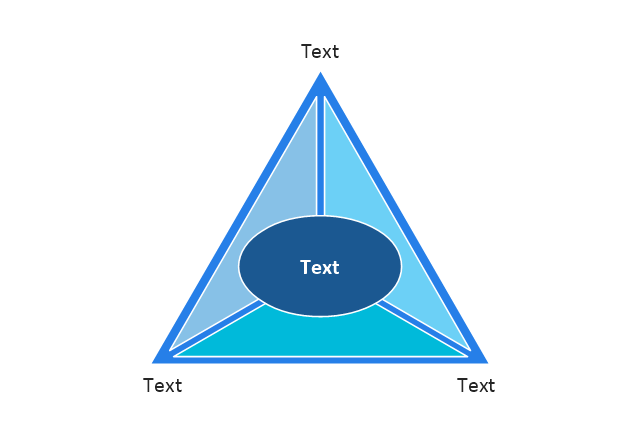
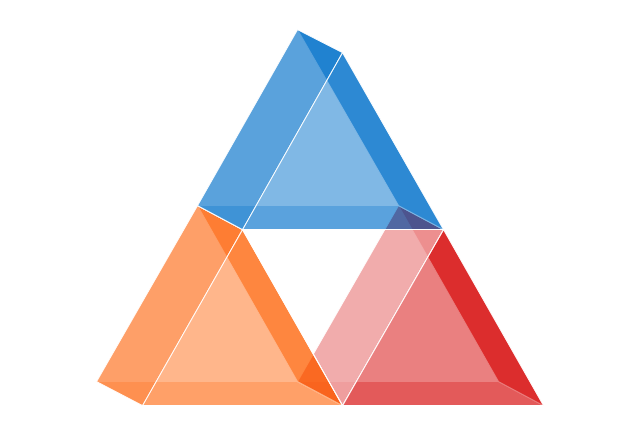
Use these templates to create your pyramid diagrams in the ConceptDraw PRO diagramming and vector drawing software extended with the Pyramid Diagrams solution from the Marketing area of ConceptDraw Solution Park.
Use these templates to create your pyramid diagrams in the ConceptDraw PRO diagramming and vector drawing software extended with the Pyramid Diagrams solution from the Marketing area of ConceptDraw Solution Park.
Chart Examples
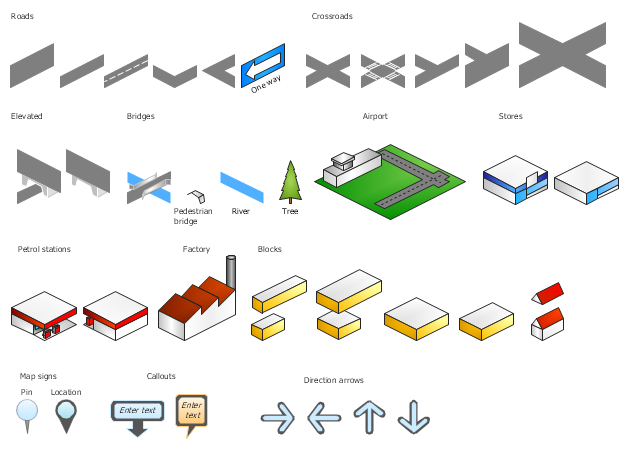
Easy charting software comes with beautiful chart templates and examples. This makes it easy to create professional charts without prior experience.The vector stencils library "3D directional maps" contains 40 symbols for creating pictorial maps, street maps, locator maps, transit maps, tourist maps with points of interest (POI), road maps and route maps using the ConceptDraw PRO diagramming and vector drawing software.
"Pictorial maps are a category of maps that are also loosely called illustrated maps, panoramic maps, perspective maps, bird’s-eye view maps and Geopictorial maps amongst others. In contrast to the regular road map, Atlas or topographic cartography, pictorial maps depict a given territory with a more artistic rather than technical style. The cartography can be a sophisticated 3-D perspective landscape or a simple map graphic enlivened with illustrations of buildings, people and animals. They can feature all sorts of varied topics like historical events, legendary figures or local agricultural products and cover anything from an entire continent to a college campus. ...
Pictorial maps usually show an area as if viewed from above at an oblique angle. They are not generally drawn to scale in order to show street patterns, individual buildings, and major landscape features in perspective. While regular maps focus on the accurate rendition of distances, pictorial maps enhance landmarks and often incorporate a complex interplay of different scales into one image in order to give the viewer a more familiar sense of recognition." [Pictorial maps. Wikipedia]
The design elements library "3D directional maps" is included in the Directional Maps solution from the Maps area of ConceptDraw Solution Park.
- Circles 3d Png
- 3d Pyramid Png
- Health Food | HR arrows - Vector stencils library | Design elements ...
- Powerpoint Thick Double Curved Arrow
- Sales arrows - Vector stencils library | Basic Flowchart Symbols and ...
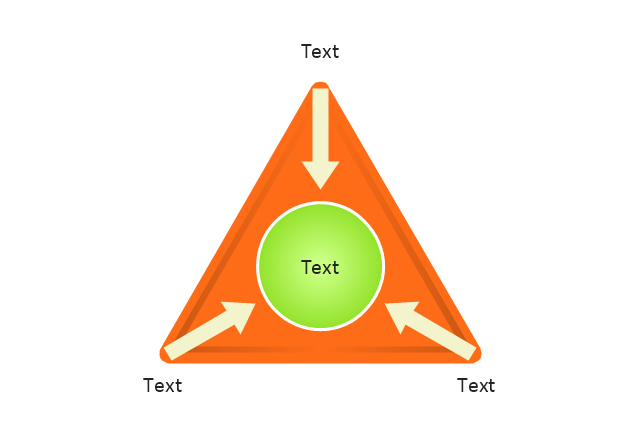
- Triangle scheme with arrows - Template | Pyramid diagrams - Vector ...
- Callout Arrow Vector Free
- Basic Flowchart Symbols and Meaning | HR arrows - Vector stencils ...
- Basic Flowchart Symbols and Meaning | HR arrows - Vector stencils ...
- Design Element: Rack Diagram for Network Diagrams | DroidDia ...
