- Electric and Telecom Plans Free
- Fire and Emergency Plans Free
- Floor Plans Free
- Plant Layout Plans Free
- School and Training Plans Free
- Seating Plans Free
- Security and Access Plans Free
- Site Plans Free
- Sport Field Plans Free
- Business Process Diagrams Free
- Business Process Mapping Free
- Classic Business Process Modeling Free
- Cross-Functional Flowcharts Free
- Event-driven Process Chain Diagrams Free
- IDEF Business Process Diagrams Free
- Logistics Flow Charts Free
- Workflow Diagrams Free
- ConceptDraw Dashboard for Facebook Free
- Mind Map Exchange Free
- MindTweet Free
- Note Exchange Free
- Project Exchange Free
- Social Media Response Free
- Active Directory Diagrams Free
- AWS Architecture Diagrams Free
- Azure Architecture Free
- Cisco Network Diagrams Free
- Cisco Networking Free
- Cloud Computing Diagrams Free
- Computer Network Diagrams Free
- Google Cloud Platform Free
- Interactive Voice Response Diagrams Free
- Network Layout Floor Plans Free
- Network Security Diagrams Free
- Rack Diagrams Free
- Telecommunication Network Diagrams Free
- Vehicular Networking Free
- Wireless Networks Free
- Comparison Dashboard Free
- Composition Dashboard Free
- Correlation Dashboard Free
- Frequency Distribution Dashboard Free
- Meter Dashboard Free
- Spatial Dashboard Free
- Status Dashboard Free
- Time Series Dashboard Free
- Basic Circle-Spoke Diagrams Free
- Basic Circular Arrows Diagrams Free
- Basic Venn Diagrams Free
- Block Diagrams Free
- Concept Maps Free
- Family Tree Free
- Flowcharts Free
- Basic Area Charts Free
- Basic Bar Graphs Free
- Basic Divided Bar Diagrams Free
- Basic Histograms Free
- Basic Line Graphs Free
- Basic Picture Graphs Free
- Basic Pie Charts Free
- Basic Scatter Diagrams Free
- Aerospace and Transport Free
- Artwork Free
- Audio, Video, Media Free
- Business and Finance Free
- Computers and Communications Free
- Holiday Free
- Manufacturing and Maintenance Free
- Nature Free
- People Free
- Presentation Clipart Free
- Safety and Security Free
- Analog Electronics Free
- Audio and Video Connectors Free
- Basic Circuit Diagrams Free
- Chemical and Process Engineering Free
- Digital Electronics Free
- Electrical Engineering Free
- Electron Tube Circuits Free
- Electronic Block Diagrams Free
- Fault Tree Analysis Diagrams Free
- GHS Hazard Pictograms Free
- Home Automation and Wiring Free
- Mechanical Engineering Free
- One-line Diagrams Free
- Power Сircuits Free
- Specification and Description Language (SDL) Free
- Telecom and AV Circuits Free
- Transport Hazard Pictograms Free
- Data-driven Infographics Free
- Pictorial Infographics Free
- Spatial Infographics Free
- Typography Infographics Free
- Calendars Free
- Decision Making Free
- Enterprise Architecture Diagrams Free
- Fishbone Diagrams Free
- Organizational Charts Free
- Plan-Do-Check-Act (PDCA) Free
- Seven Management and Planning Tools Free
- SWOT and TOWS Matrix Diagrams Free
- Timeline Diagrams Free
- Australia Map Free
- Continent Maps Free
- Directional Maps Free
- Germany Map Free
- Metro Map Free
- UK Map Free
- USA Maps Free
- Customer Journey Mapping Free
- Marketing Diagrams Free
- Matrices Free
- Pyramid Diagrams Free
- Sales Dashboard Free
- Sales Flowcharts Free
- Target and Circular Diagrams Free
- Cash Flow Reports Free
- Current Activities Reports Free
- Custom Excel Report Free
- Knowledge Reports Free
- MINDMAP Reports Free
- Overview Reports Free
- PM Agile Free
- PM Dashboards Free
- PM Docs Free
- PM Easy Free
- PM Meetings Free
- PM Planning Free
- PM Presentations Free
- PM Response Free
- Resource Usage Reports Free
- Visual Reports Free
- House of Quality Free
- Quality Mind Map Free
- Total Quality Management TQM Diagrams Free
- Value Stream Mapping Free
- Astronomy Free
- Biology Free
- Chemistry Free
- Language Learning Free
- Mathematics Free
- Physics Free
- Piano Sheet Music Free
- Android User Interface Free
- Class Hierarchy Tree Free
- Data Flow Diagrams (DFD) Free
- DOM Tree Free
- Entity-Relationship Diagram (ERD) Free
- EXPRESS-G data Modeling Diagram Free
- IDEF0 Diagrams Free
- iPhone User Interface Free
- Jackson Structured Programming (JSP) Diagrams Free
- macOS User Interface Free
- Object-Role Modeling (ORM) Diagrams Free
- Rapid UML Free
- SYSML Free
- Website Wireframe Free
- Windows 10 User Interface Free
Funnel Diagrams
Today, supply is typically great and often exceeds demand, and it is becoming increasingly difficult to attract buyers. In this regard, the areas of marketing, advertising and sales management are actively developing and strive to turn a potential buyer into a real paying customer. This process consists of several steps and is most often represented graphically using a Funnel chart. Each step decreases the number of customers.
The Funnel chart allows you to visualize a linear process with at least four sequential steps, and the number of items in the first step is expected to exceed the number of items in the last step. The Funnel chart allows you to categorize customers according to the stages of the sales process, from the first meeting to the conclusion of the sale. The first stage is always the largest and shows how many potential customers are in the early stages of the sales process. Each next stage is smaller than the previous one, and the bottom stage shows the number of customers whom contracts have already been signed with. As a result, the stages are arranged in the form of a funnel or an inverted pyramid.
The Funnel diagram is one of the main tools for building a business and an almost universal multifunctional sales management tool. It allows you to analyze a company's productivity and significantly increase profits. The main task of the seller is to competently conduct marketing campaigns and build a sales funnel in such a way as to ensure a smooth and unobtrusive transition of a potential buyer from curiosity to real interest, buying and becoming a regular customer. The stages of the buyer's movement towards the goal are clearly visible from the sales funnel. First, through advertising, the client's attention is attracted and his interest is awakened. Then the client's desire to take advantage of the offer and buy a product or service appears and this process ends with the purchase.
The marketing and sales funnel is useful for tracking the progress and success of advertising and marketing campaigns, for determining the number of customers who move to the next stage or disappear at each stage. It is also useful for calculating the potential performance of the company in stages, for tracking performance indicators to identify bottlenecks in the process and for a wide range of other tasks. What's more, the use of a marketing funnel in combination with its analysis gives you the opportunity to influence consumers in a professional and effective manner. The Funnel diagram allows you to draw conclusions about the quality of management and the need to increase efforts at some stage of the sale. If the funnel narrows evenly — this is a normal process, but if suddenly at one of the stages an unexpected narrowing of the funnel occurs, this indicates the need to improve the quality of management and sales process.
Funnel Diagram solution extends the functionality of ConceptDraw DIAGRAM with a wide range of Funnel diagram samples, Sales funnel examples and vector design elements. These tools make ConceptDraw DIAGRAM software ideal for managing funnel and creating the Funnel diagrams of various types and designs including classic models and many more variations. Among them are AIDA model, AIDAS, ACCA Dagmar, Rossiter-Percy model, sales funnel, marketing funnel, search funnel, brand funnel, purchase funnel, lead funnel, conversion funnel, business funnel, etc. When designing Funnel diagrams in ConceptDraw DIAGRAM you can place the funnel object horizontally or vertically, you can use the objects with the desired number of sales funnel stages. You can also change their size, color fill, and other parameters to make the Funnel diagrams look extremely suitable to your desires.
-
Buy this solution $25 -
Solution Requirements - This solution requires the following products to be installed:
ConceptDraw DIAGRAM v18 - This solution requires the following products to be installed:
-
Compatibility - Sonoma (14), Sonoma (15)
MS Windows 10, 11 - Sonoma (14), Sonoma (15)
-
Support for this Solution -
Helpdesk
The Funnel Diagrams solution contains 57 examples and 5 libraries containing 145 vector graphics and icons, to allow you to create professional-looking documents.
Design Elements — Funnel Icons
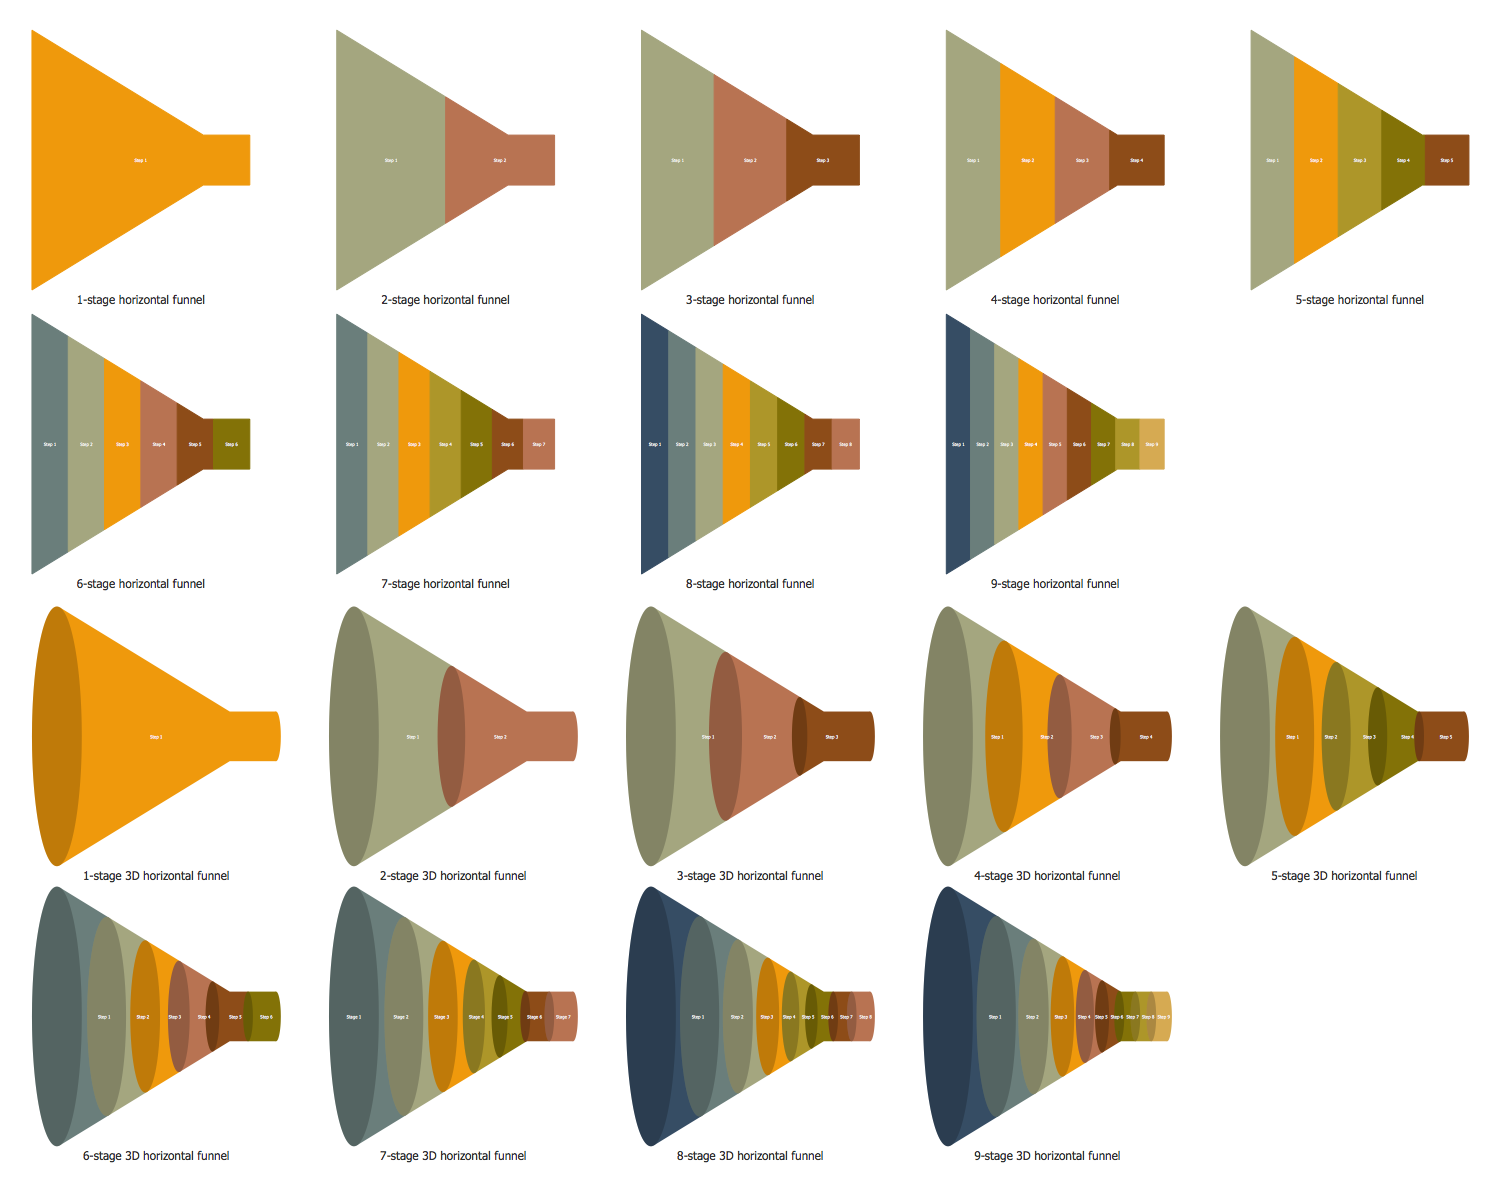
Design Elements — Horizontal Funnels
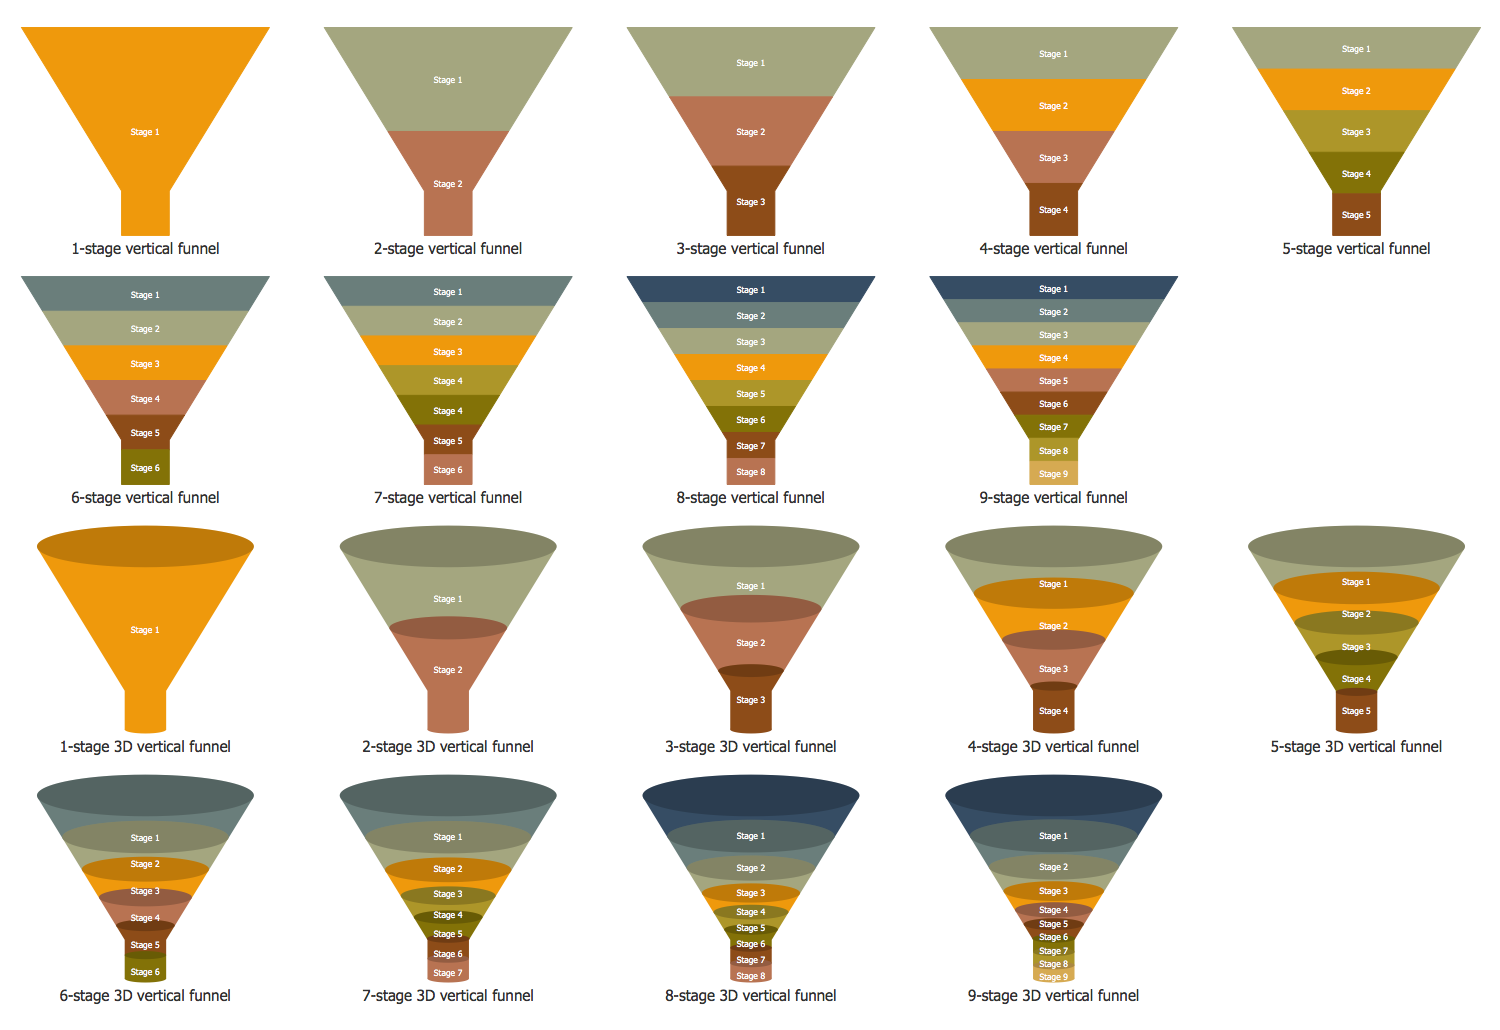
Design Elements — Vertical Funnels
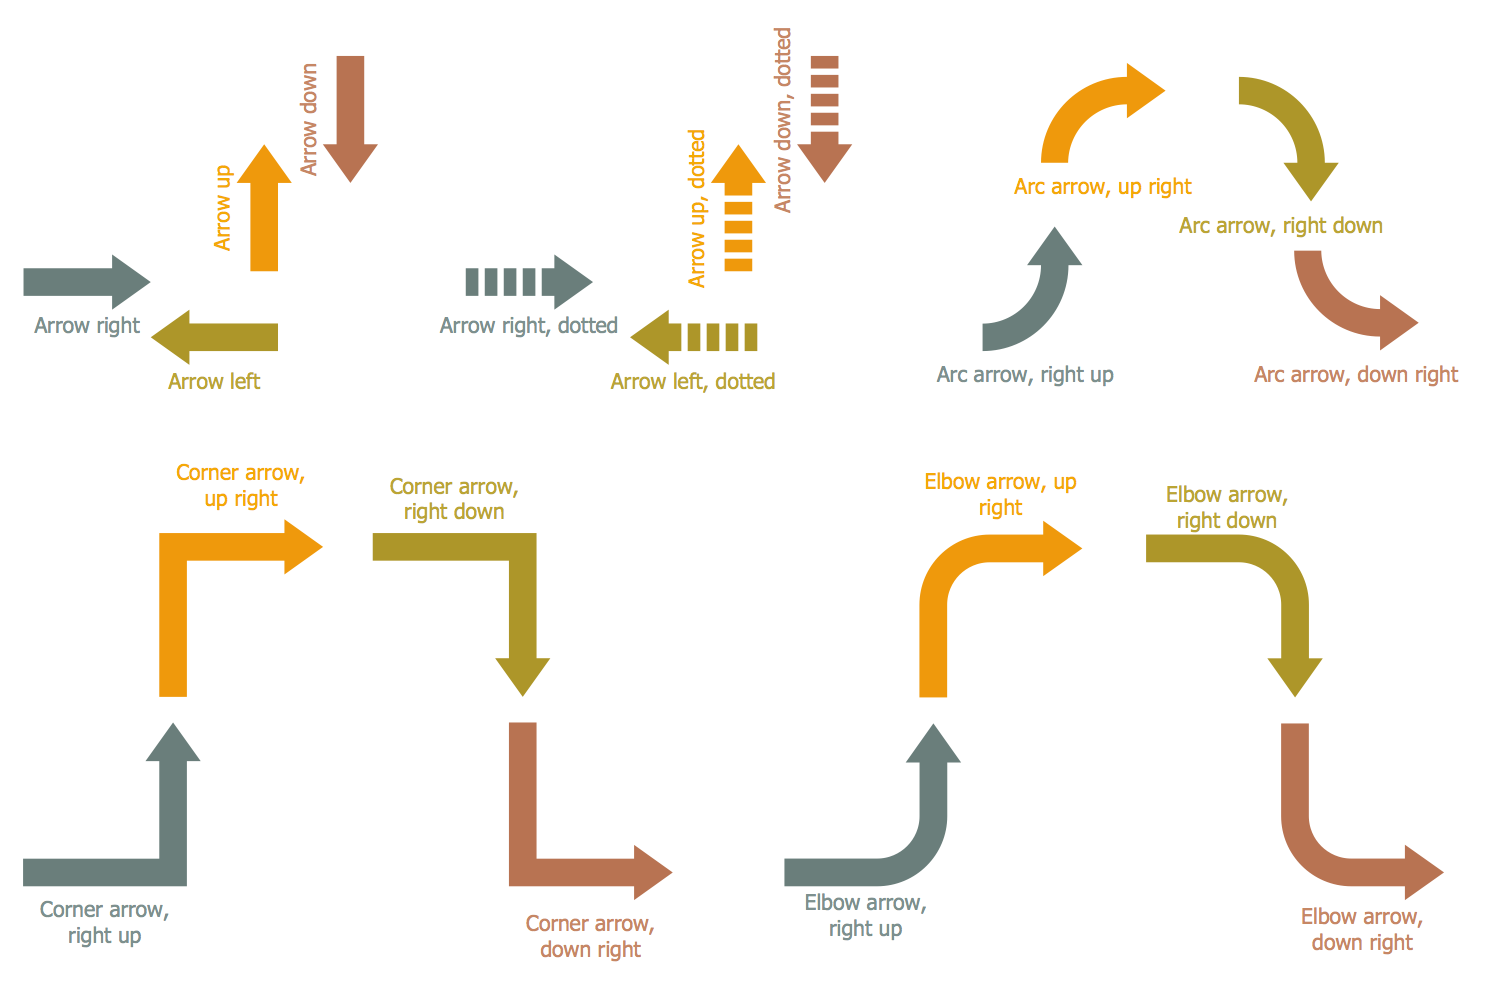
Design Elements — Funnel Arrows
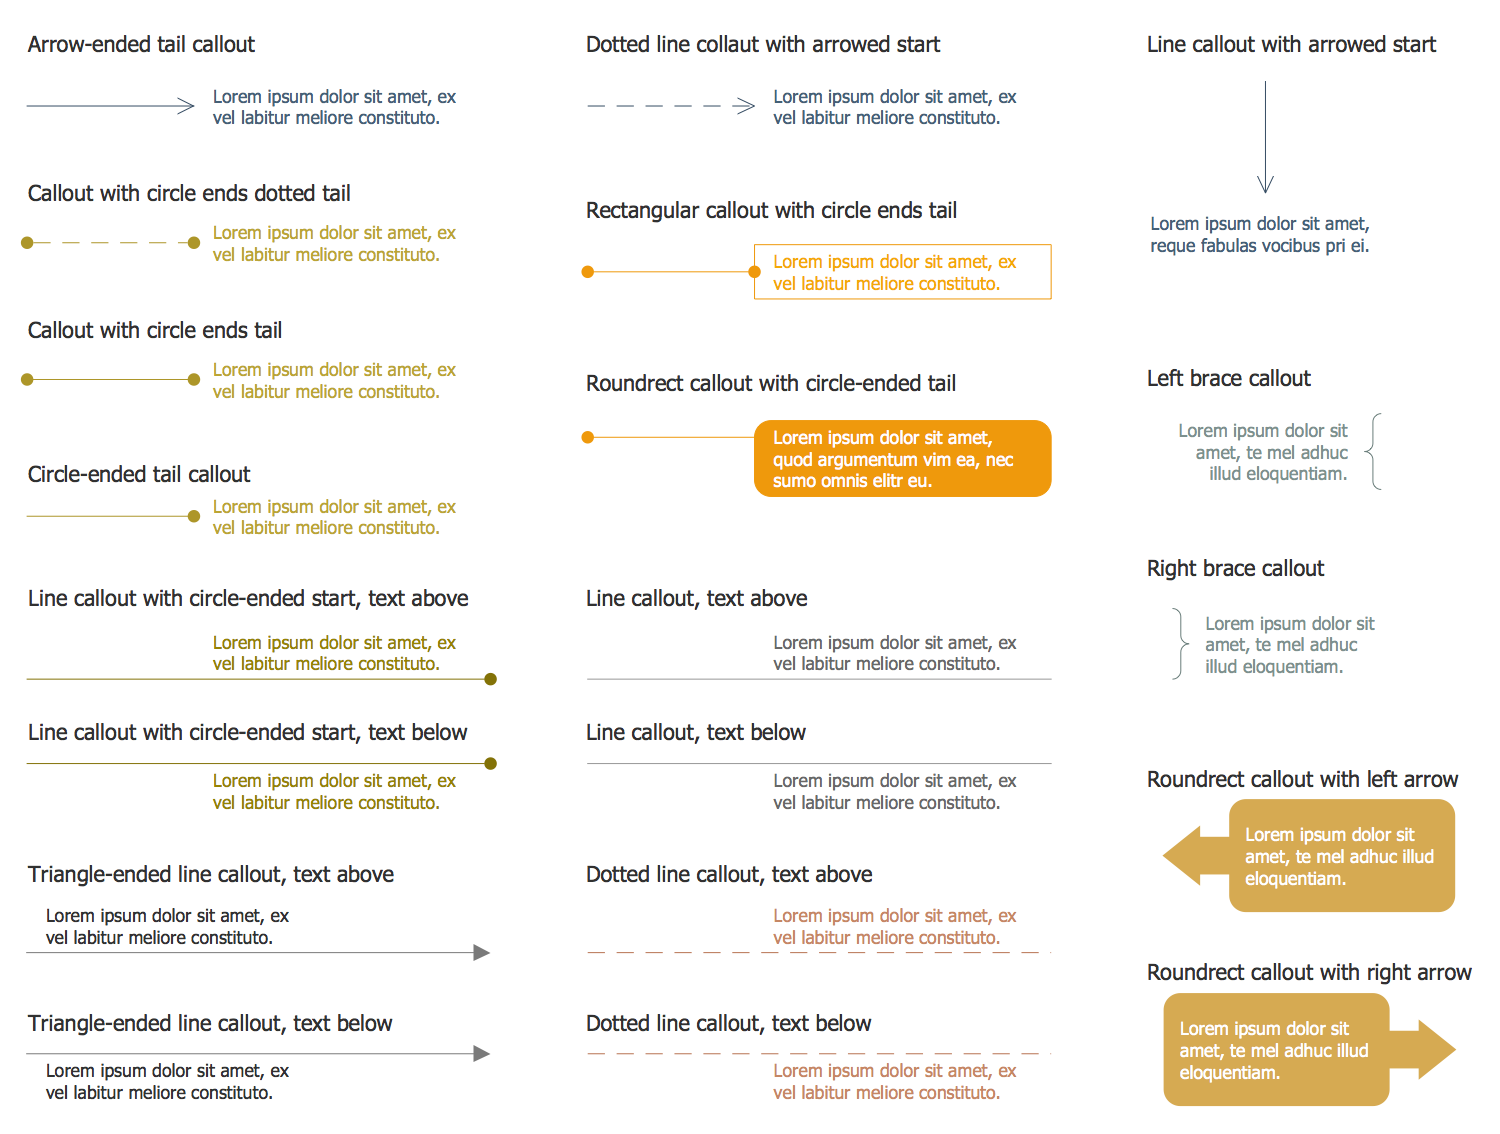
Design Elements — Funnel Callouts
Related News:
Examples
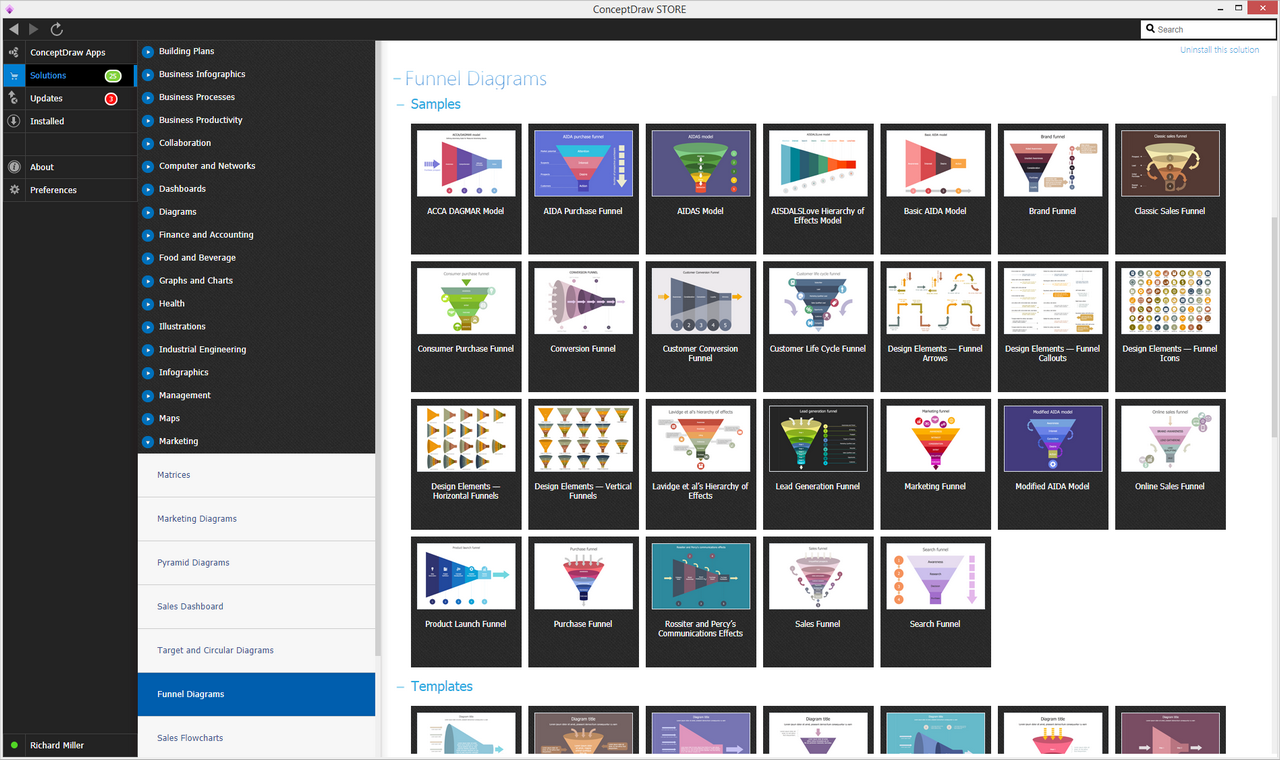
There are a few samples that you see on this page which were created in the ConceptDraw DIAGRAM application by using the Funnel Diagrams solution. Some of the solution's capabilities as well as the professional results which you can achieve are all demonstrated here on this page.
All source documents are vector graphic documents which are always available for modifying, reviewing and/or converting to many different formats, such as MS PowerPoint, PDF file, MS Visio, and many other graphic ones from the ConceptDraw Solution Park or ConceptDraw STORE. The Funnel Diagrams solution is available to all ConceptDraw DIAGRAM users to get installed and used while working in the ConceptDraw DIAGRAM diagramming and drawing software.
Example 1: ACCA DAGMAR Model
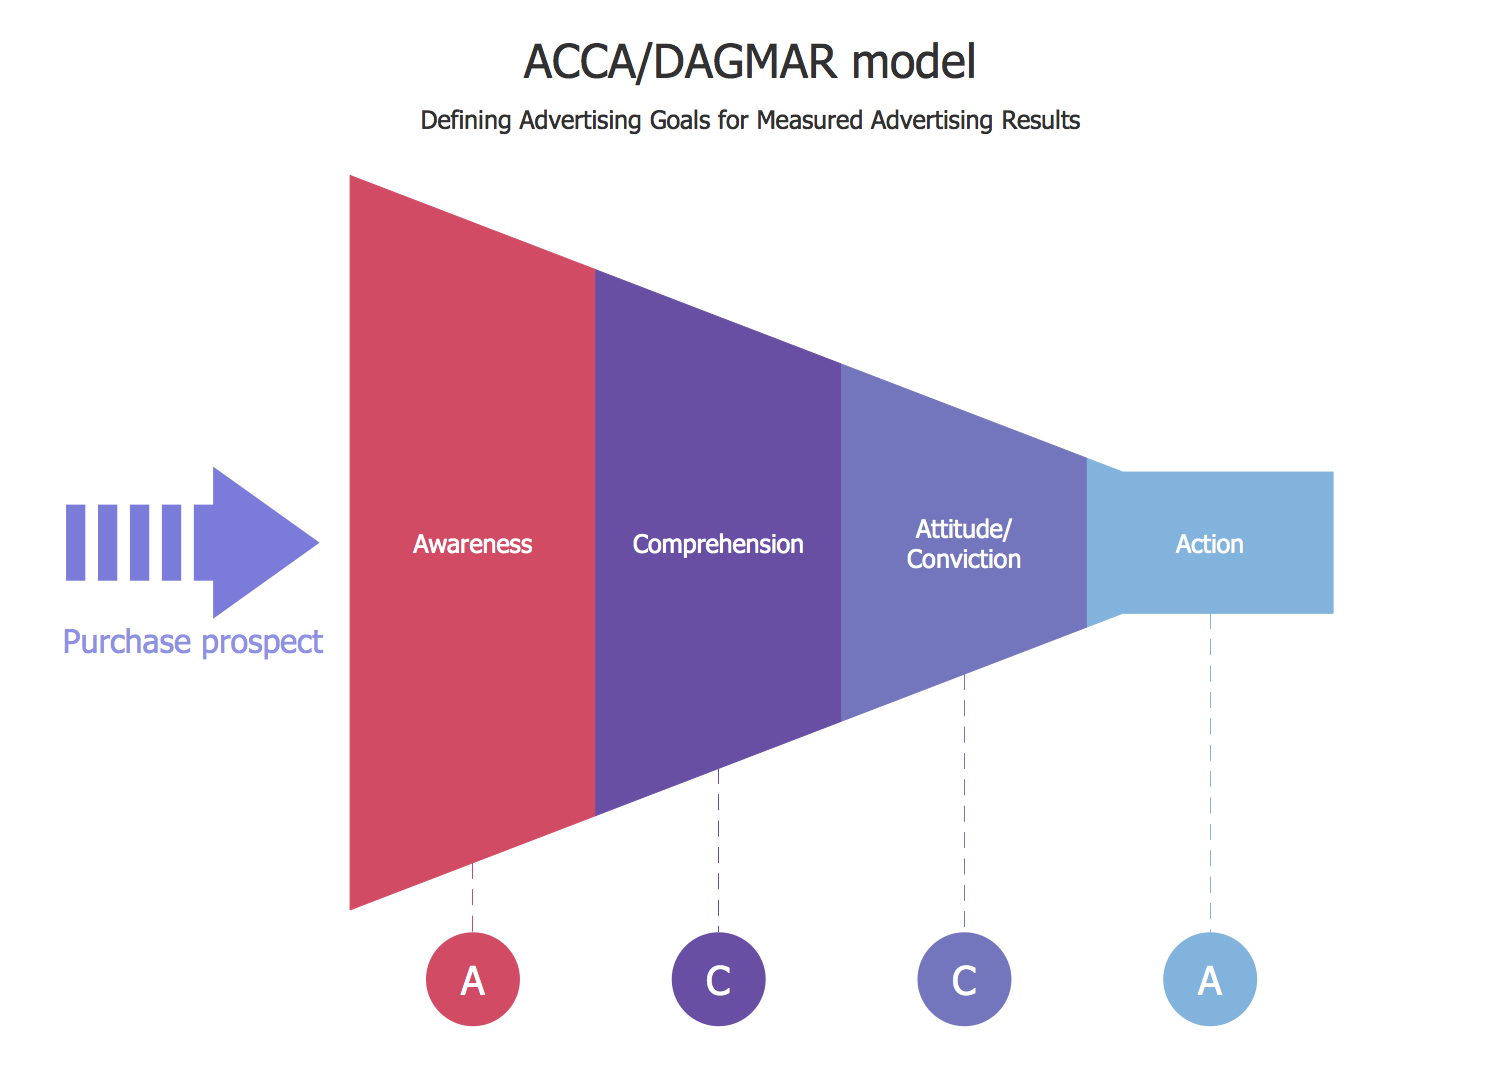
This diagram was created in ConceptDraw DIAGRAM using the composition of libraries from the Funnel Diagrams Solution. An experienced user spent 5 minutes creating this sample.
This sample demonstrates the Funnel diagram including 4 steps ACCA of DAGMAR (Defining Advertising Goals for Measured Advertising Results) marketing model. It was suggested by Russel H. Colley in 1961. This abbreviation is composed of the first letters of the model components, such as Awareness (A), Comprehension (C), Conviction (C), and Action (A). Each of these steps is represented as a separated layer on this Funnel diagram. The ACCA advertising formula originates from the AIDA advertising formula, and furthermore is more popular and comprehensive. It is intended for the measurement the advertising effectiveness and mapping the states of mind passed by the consumers on the way to purchase. One of the most important parts of the DAGMAR model is the process of defining the target audience (the group of people for which is addressed the advertising message) and formulation the objective of the advertising message.
Example 2: AIDA Purchase Funnel
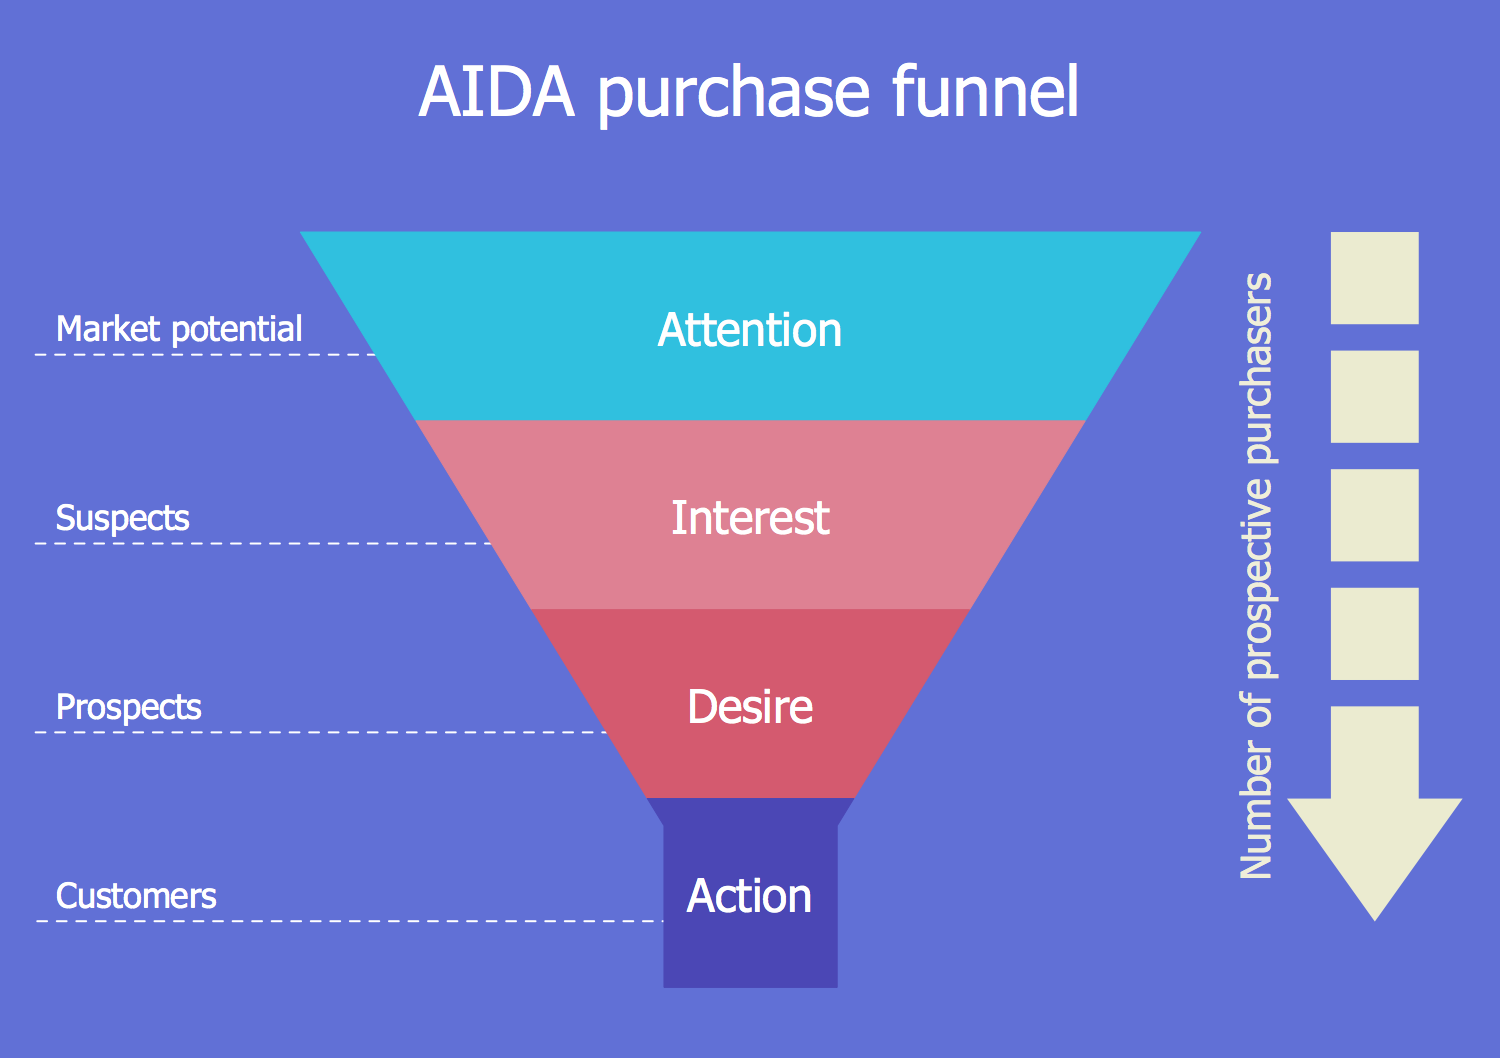
This diagram was created in ConceptDraw DIAGRAM using the composition of libraries from the Funnel Diagrams Solution. An experienced user spent 10 minutes creating this sample.
This Funnel diagram sample shows 4 steps of AIDA marketing model, these are: Attention (A), Interest (I), Desire (D) and Action (A). It is a well-known and widely used model in a field of marketing and advertising. The AIDA marketing model allows to accurately depict all stages and steps taking place from the moment when the consumer first faces some product or brand through to the moment when he decides to test and buy this product. This model assists in comprehension efficiency and influence of advertising and marketing communications on the consumers and on the making purchases by them. The AIDA model allows making the products of specific brands recognizable for consumers, engages the new consumers to buy the products of exactly this brand. It helps to advance the consumers using the marketing and advertising via the series of sequential steps from the first acquaintance with a brand to the consumption and purchase.
Example 3: AIDAS Model
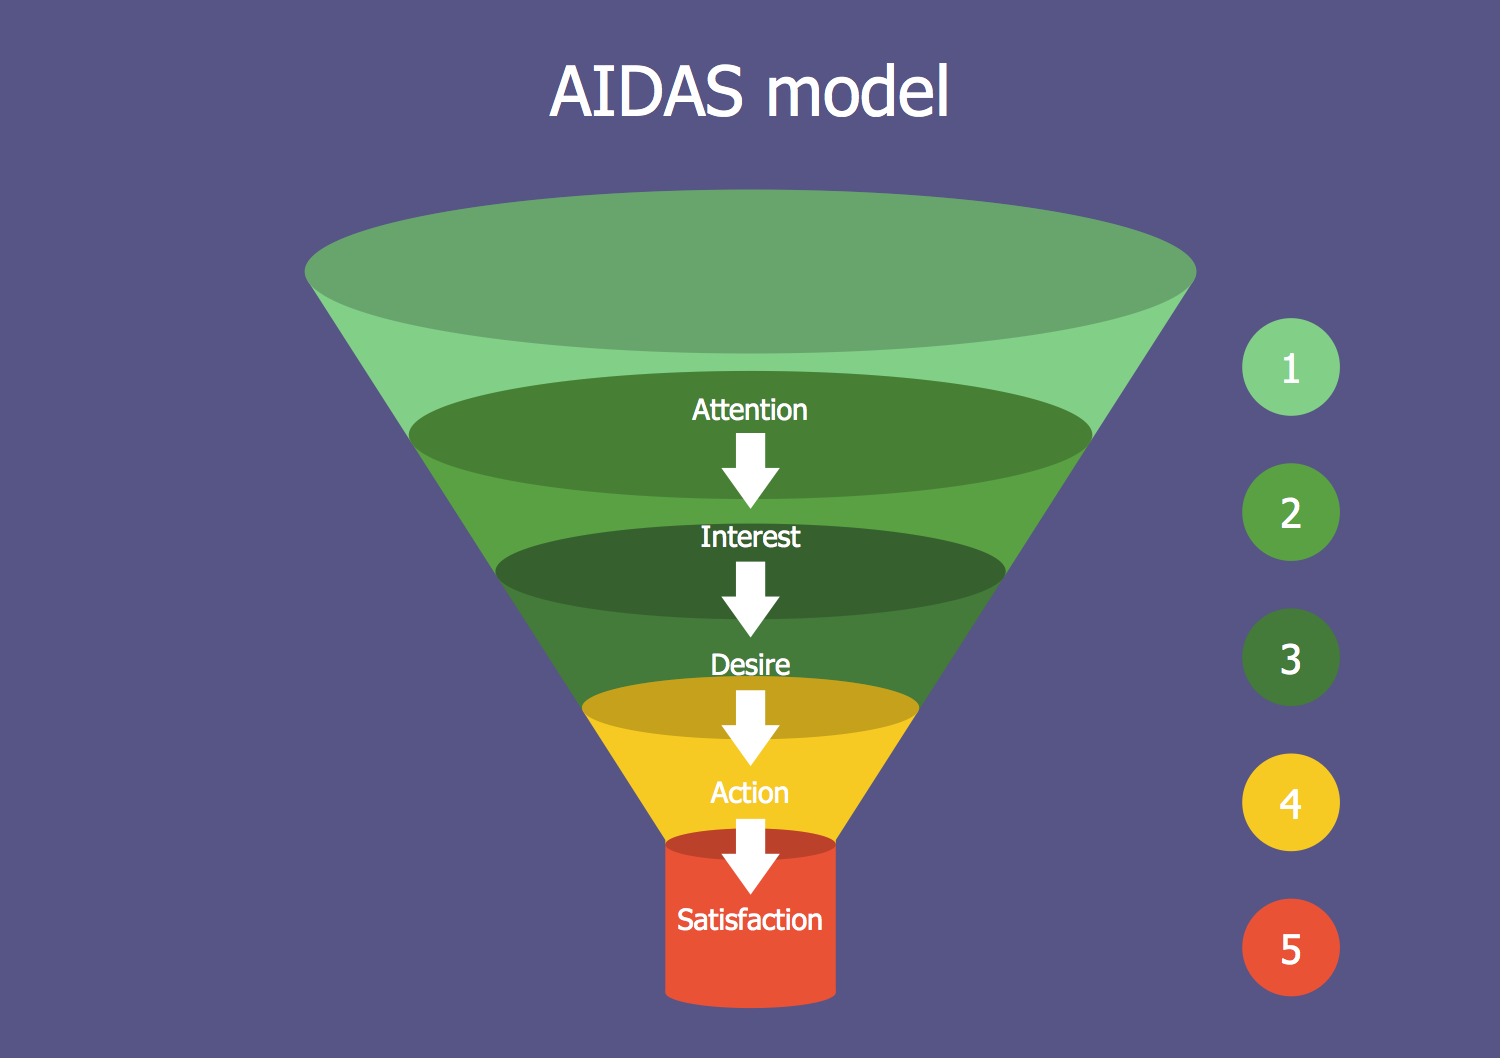
This diagram was created in ConceptDraw DIAGRAM using the composition of libraries from the Funnel Diagrams Solution. An experienced user spent 5 minutes creating this sample.
This Funnel diagram example depicts 5 steps of AIDAS marketing model: Attention (A), Interest (I), Desire (D), Action (A), and Satisfaction (S). This model is an extension of well-known marketing AIDA model including 4 steps on the way from the first informing the consumer about a specific product or brand to the decision making about purchase it. The refinement of the model and its increase in the number of stages from four to five were carried out taking into account theoretical developments and research. The AIDAS model helps to explain the mechanism using which the advertisement or marketing communications involve the consumers in a brand choice. The steps in this diagram are visually numbered and the arrows show the direction of movement. Steps are sequential from attention to a product or brand to satisfaction with their own choice, after interest in this brand or product, the desire to buy it and, ultimately, an active action (purchase).
Example 4: AISDALSLove Hierarchy of Effects Model
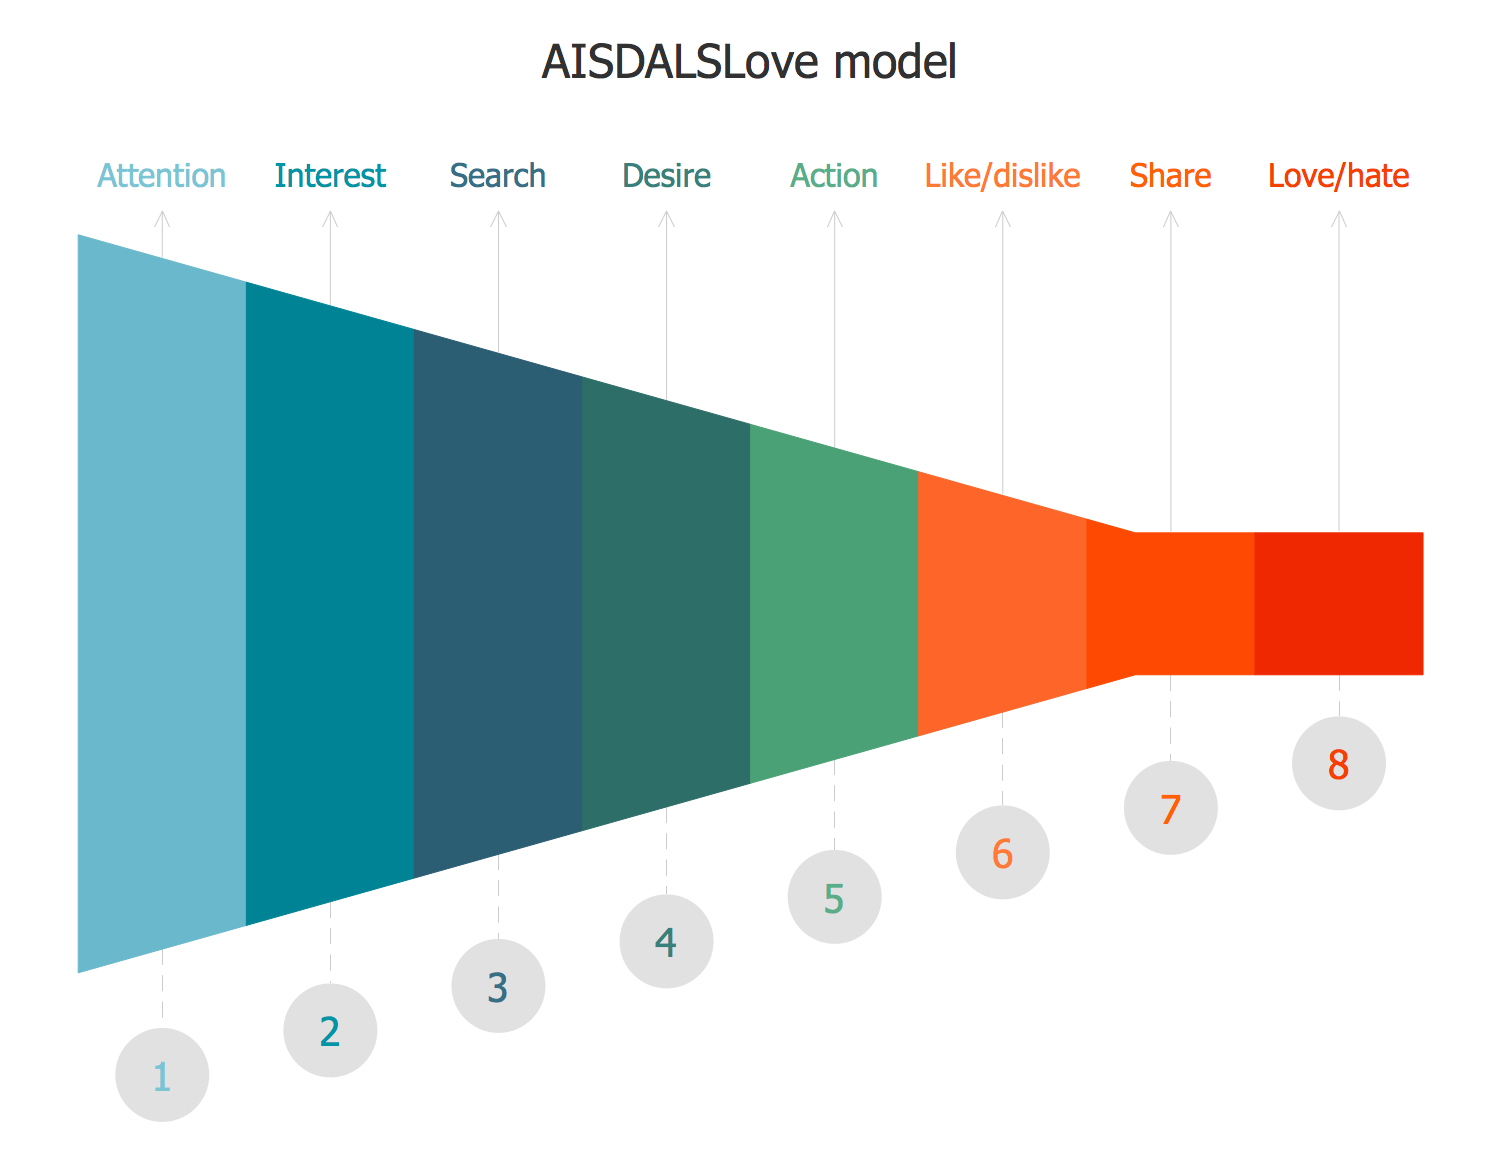
This diagram was created in ConceptDraw DIAGRAM using the composition of libraries from the Funnel Diagrams Solution. An experienced user spent 5 minutes creating this sample.
This Funnel diagram demonstrates the AISDALSLove hierarchy of effects model in advertising. It is described by 8 steps: Attention (A), Interest (I), Search (S), Desire (D), Action (A), Like/dislike (L), Share(S), and Love/hate. These simple words briefly describe the long process, when the target consumer audience pays attention (A) to the advertising announcement. Then it shows the interest (I) for the advertised brand or product and searches (S) the information about it. After this stage, it forms the attitude and desire (D) for the brand or product. The next stage is the action (A), on which the consumer audience elects the brand and purchases the product with a goal to satisfy the desire. After testing the product, we can see the following steps showing whether the consumer likes it. By like (L) or dislike, the consumer expresses its feelings of likes or dislikes, shares (S) its thoughts and impressions to other consumers through media or directly. As for the last stage (Love), it describes the long-term feelings (love or hate) of consumer audience towards the product or brand.
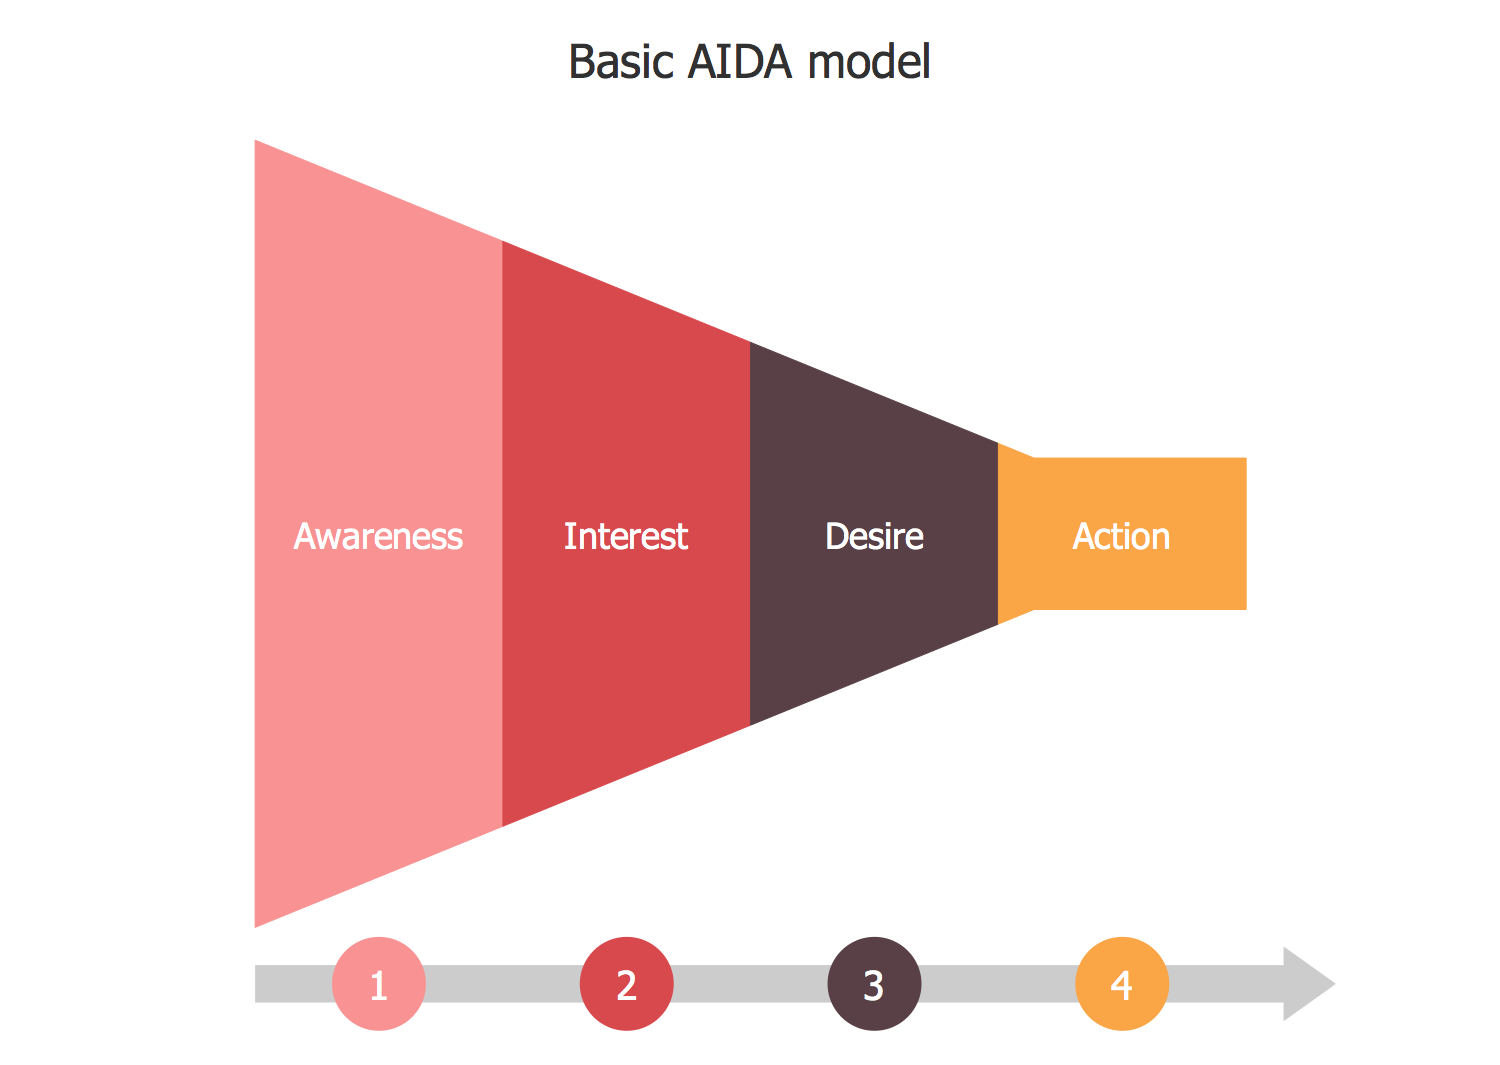
Example 5: Basic AIDA Model
This diagram was created in ConceptDraw DIAGRAM using the composition of libraries from the Funnel Diagrams Solution. An experienced user spent 5 minutes creating this sample.
This Funnel chart sample shows 4 steps of the basic AIDA model that is interpreted as Awareness (A), Interest (I), Desire (D), and Action (A). It is a basic AIDA model. However, in some cases, it may be modified, extended and supplemented with some additional steps, individually important in each case. There are many options, some of them contain additional stages after the purchase of the product, others contain advanced analysis before purchase. Some options include stages related to the publication of reviews on social networks and brand communities after testing the product. However, the basic sequence for each model based on AIDA will be stable and will include stages of cognition, exposure, and behavior. The ConceptDraw funnel object used in this example is positioned horizontally, indicating the direction of movement of the stages that this diagram implies. All the various funnel objects are available in the Funnel Diagrams solution libraries for ConceptDraw DIAGRAM and are easy to use for building your marketing and sales funnels.
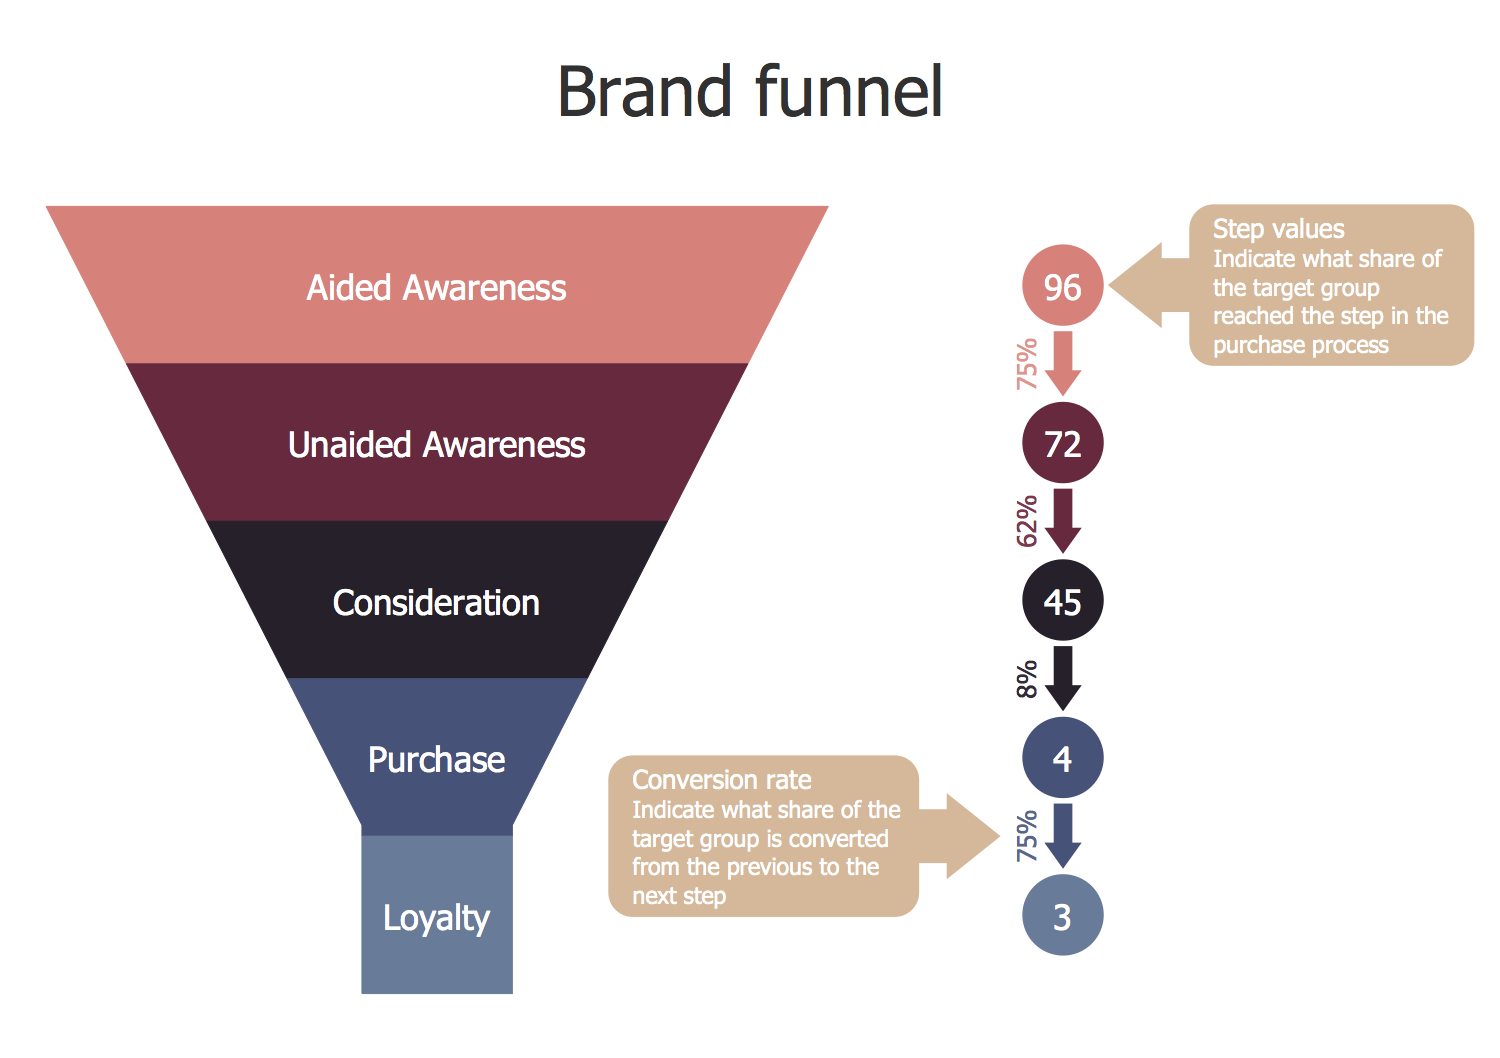
Example 6: Brand Funnel
This diagram was created in ConceptDraw DIAGRAM using the composition of libraries from the Funnel Diagrams Solution. An experienced user spent 10 minutes creating this sample.
This sample represents the Funnel diagram with 5 steps of a brand purchase funnel: Aided Awareness, Unaided Awareness, Consideration, Purchase, and Loyalty. In addition to the funnel with names of the stages, this sample also shows the steps values (what share of the target group reached the step in the purchase process) and conversion rates (what share of the target group is converted from the previous to the next step). Brand awareness is a major factor in brand management, advertising management, strategy development, and a key factor in consumer behavior. This metric shows how many people in the target market are aware of the existence of a brand and reflects the ability of customers to recognize and remember the brand. Brand awareness is extremely important because a consumer's ability to recognize a brand strongly influences the decision to buy products from a brand they like.
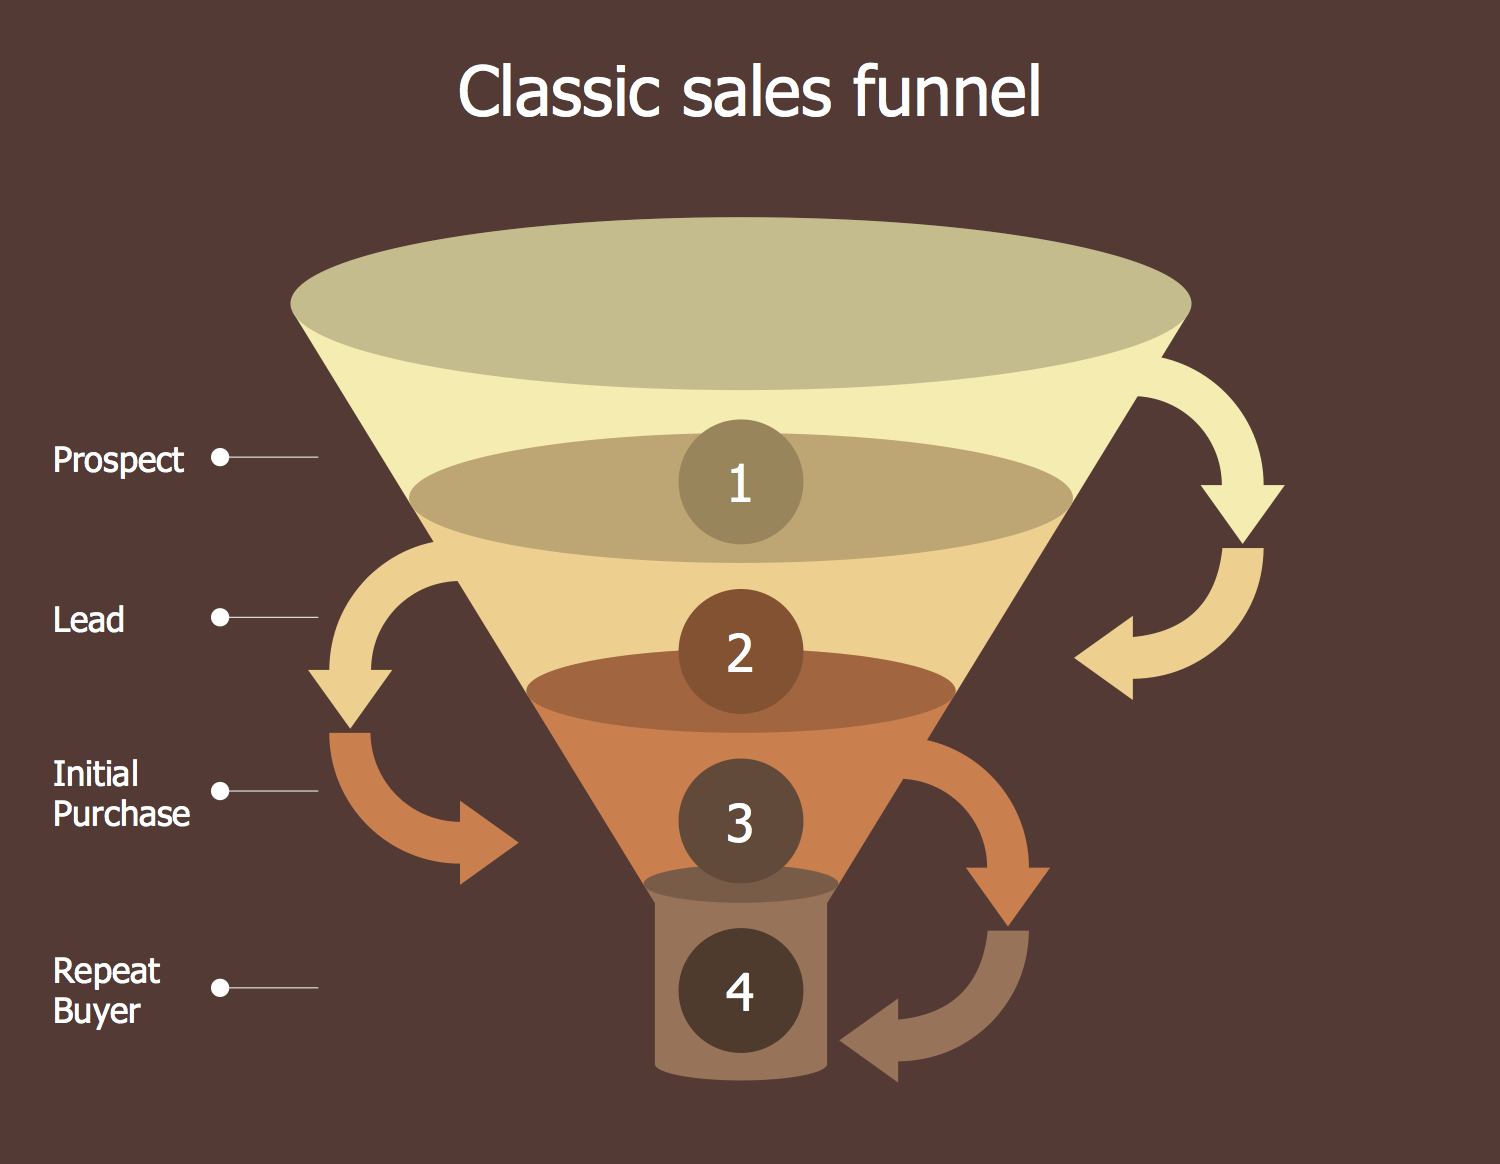
Example 7: Classic Sales Funnel
This diagram was created in ConceptDraw DIAGRAM using the composition of libraries from the Funnel Diagrams Solution. An experienced user spent 7 minutes creating this sample.
This sample illustrates the Classic sales funnel consisting from 4 steps: Prospect, Lead, Initial Purchase, and Repeat Buyer. The sales process engineering or the sales pipeline engineering is a field of activity intended for development the best sales processes and the best ways of selling, i.e. the ways that contribute for the most effective sales and effort the productivity of sellers. The sales process engineering supposes the systematic application the defined set of scientific and mathematical principles suitable for a particular sales process. When designing your Funnel diagrams, you can place the stage names on the appropriate funnel layers or position them at a specific distance as, for example, in this example chart. Develop effectively your Funnel diagrams for the sales, marketing, and customer service areas, and design them easily in ConceptDraw DIAGRAM application. You can use this sample and other sales funnel examples in your work or design from the scratch your own extensive Sales funnel diagrams with additional stages.
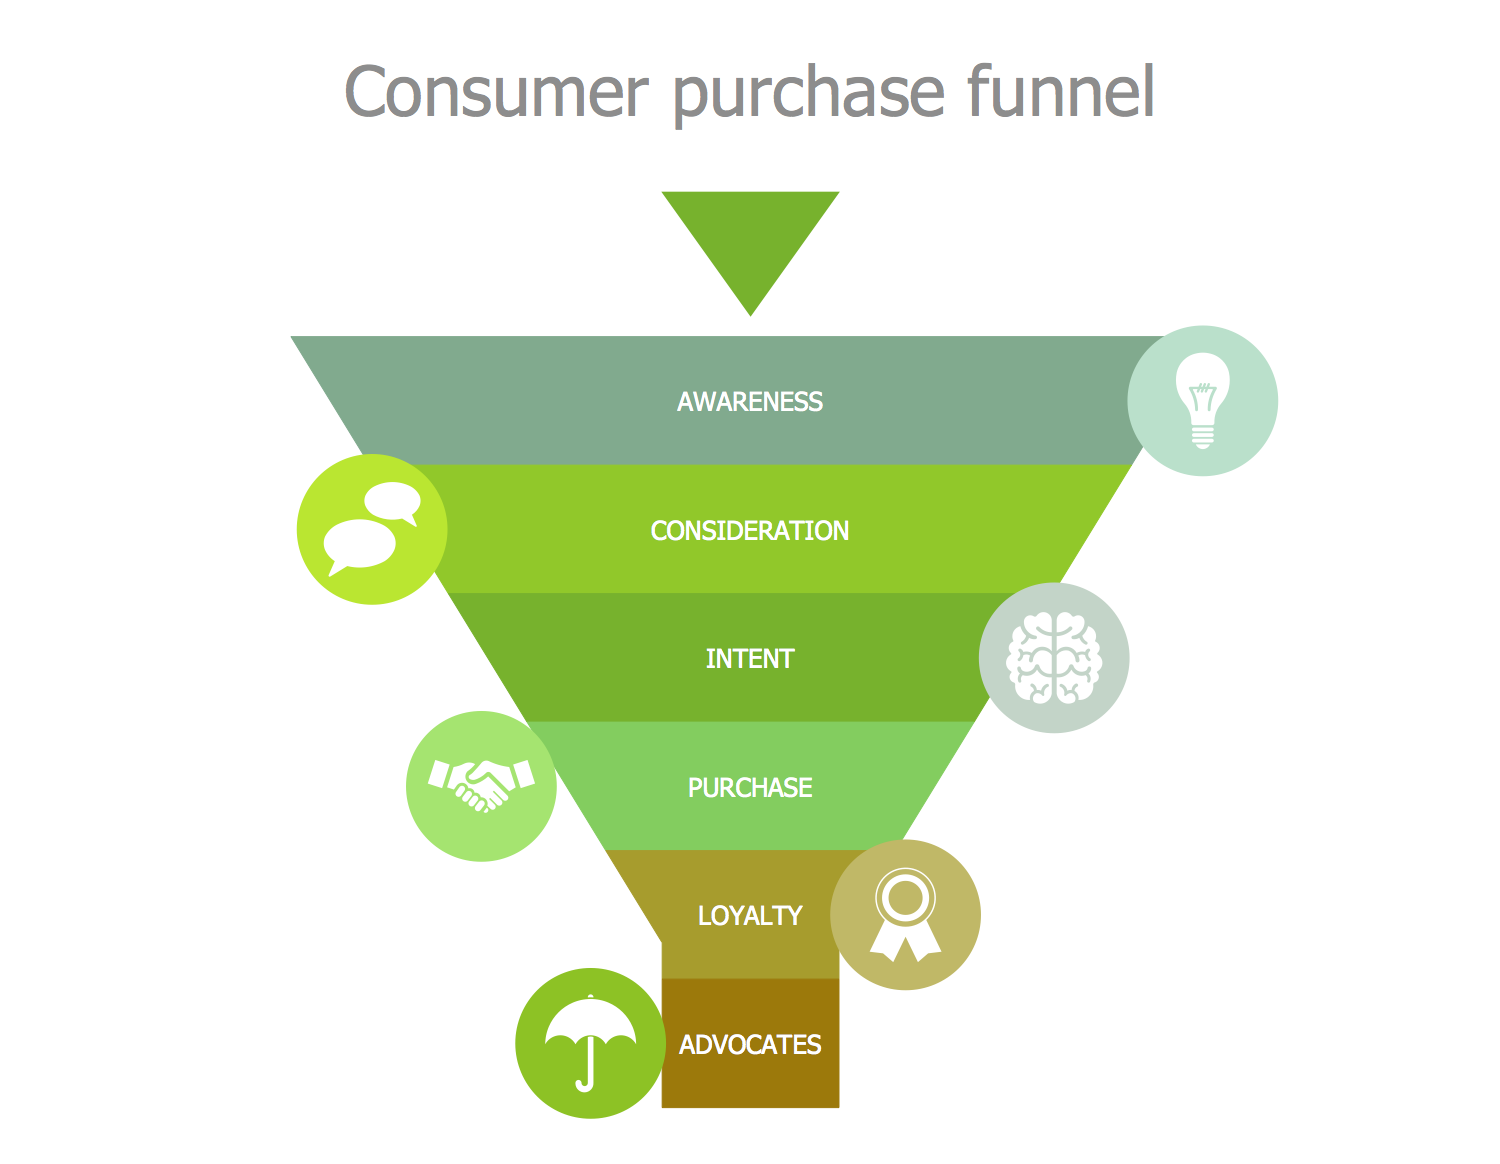
Example 8: Consumer Purchase Funnel
This diagram was created in ConceptDraw DIAGRAM using the composition of libraries from the Funnel Diagrams Solution. An experienced user spent 7 minutes creating this sample.
This sample shows the Consumer purchase funnel diagram. It is composed of 6 steps: Awareness, Consideration, Intent, Purchase, Loyalty, Advocates. The purchase funnel, also called a purchasing funnel, customer funnel, marketing sales funnel, is a consumer-centered marketing model. It describes the customer's journey to purchasing a particular product or service, allowing you to analyze the buying process carried out by customers. It helps to understand how potential customers discover your product or brand, what they think about it, and how they become loyal customers. The color style of your chart is a rather important point from the psychological point of view, because different colors have diverse effects on the human perception. The certain range of colors like yellow, red, orange, green, significantly increase attention and interest of audience. Pay attention to this and use this information to highlight important data and increase the success of your diagrams.
Example 9: Conversion Funnel
This diagram was created in ConceptDraw DIAGRAM using the composition of libraries from the Funnel Diagrams Solution. An experienced user spent 7 minutes creating this sample.
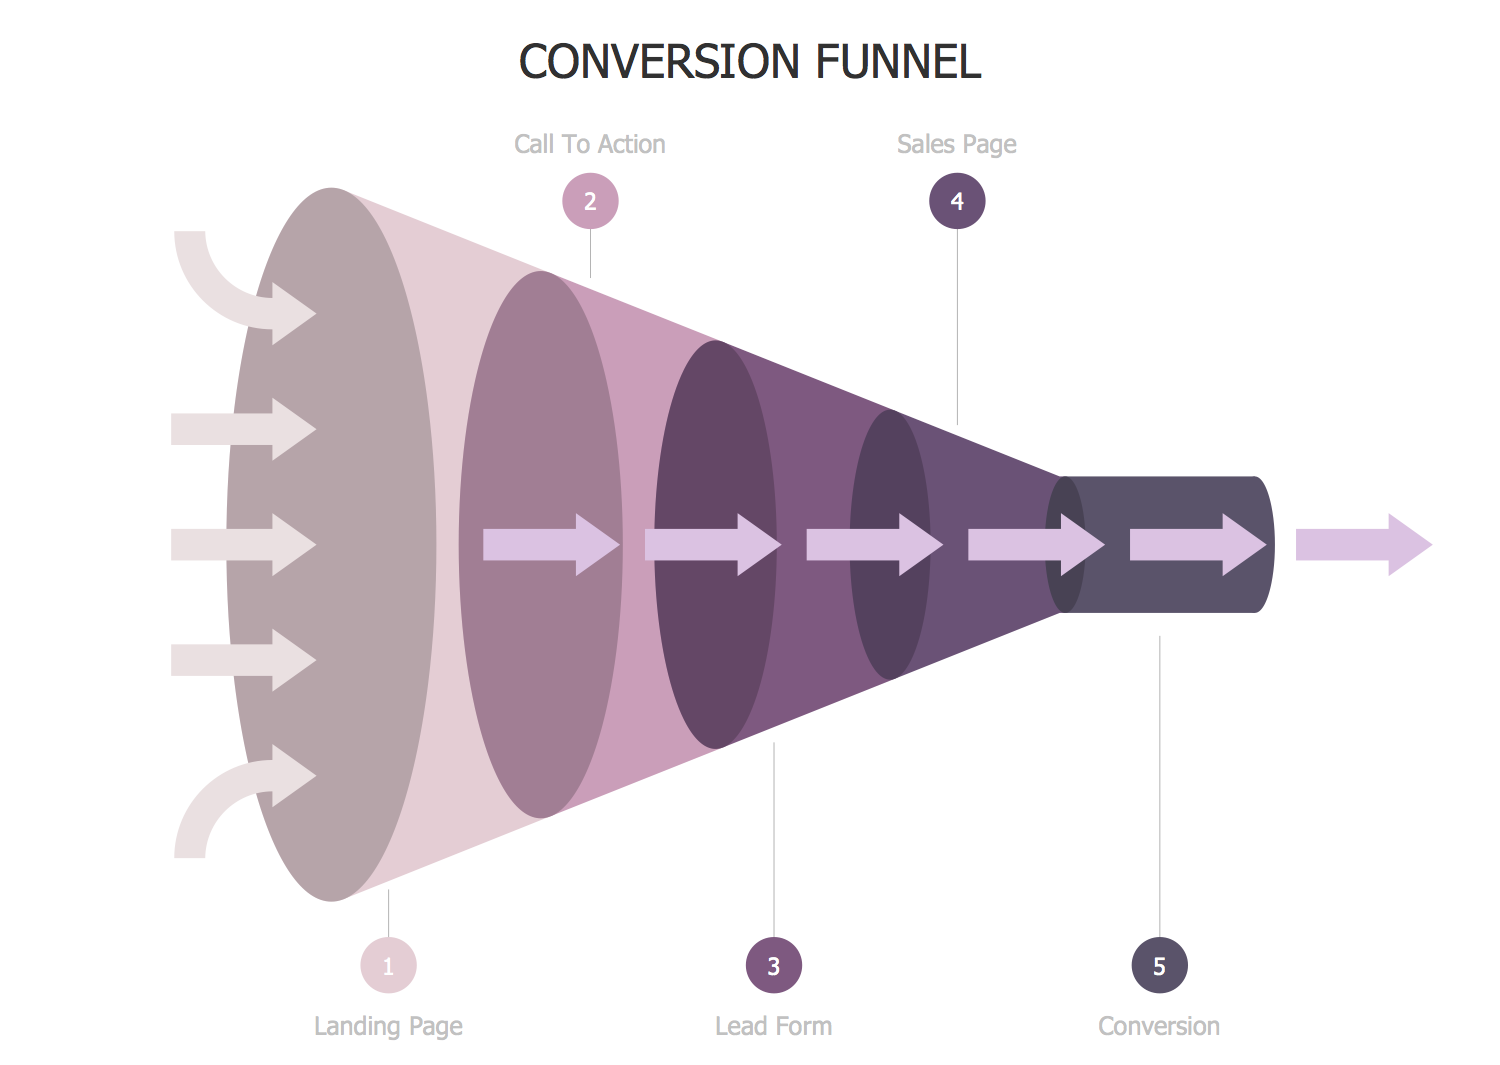
This sample diagram represents 5 stages of the Conversion funnel: Landing Page, Call To Action, Lead Form, Sales Page, and Conversion. The Conversion funnel is a term used in e-commerce. It describes the journey passed by the potential customers, through which they come to the site, with fewer navigation options at each step. A large number of customers are known to search for a product or service on pages associated with an e-commerce site through a link, banner ad, or ad network. But seeing the advertisement or link only little quantity of people click this link and enter on the e-commerce site, and only small percentage of entered customers proceeds to the product pages, moreover even less of them clicks on the product to add it to the basket. The necessity to register and fill the contact and payment details even more decreases the numbers step-by-step totality along the funnel. The large quantity of steps greatly decreases the quantity of visitors that become the paying customers.
Example 10: Customer Conversion Funnel
This diagram was created in ConceptDraw DIAGRAM using the composition of libraries from the Funnel Diagrams Solution. An experienced user spent 5 minutes creating this sample.
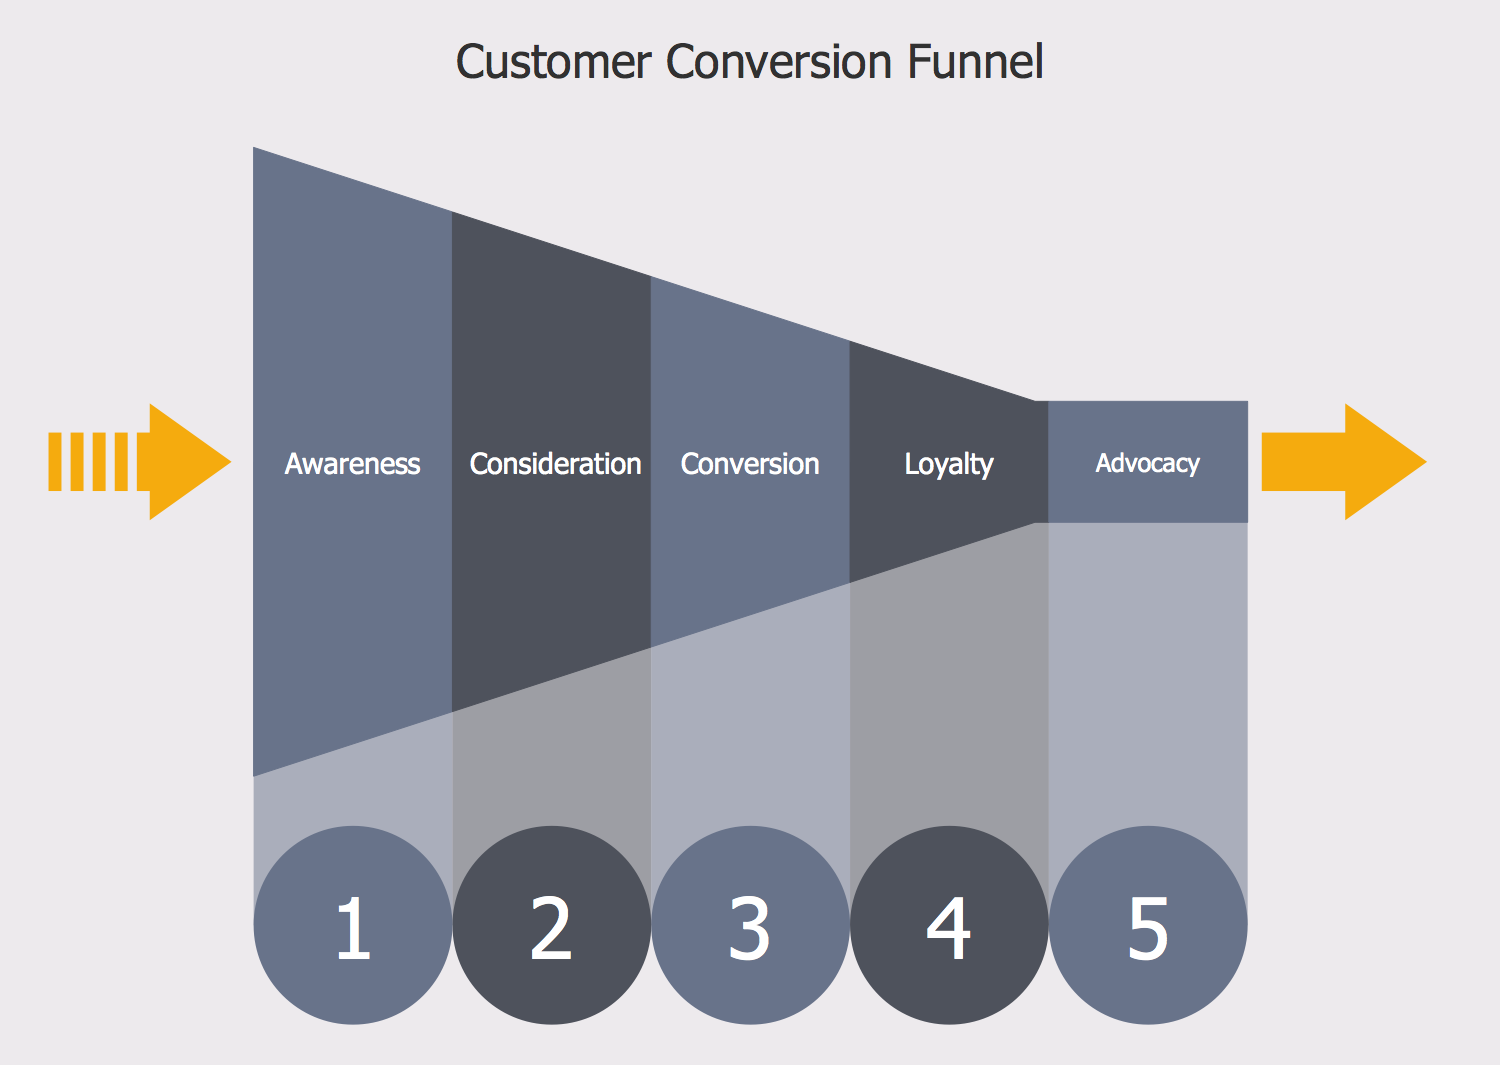
This Funnel diagram sample shows the Customer conversion funnel. It is broken down into 5 stages: Awareness, Consideration, Conversion, Loyalty, and Advocacy. The conversion funnel or sales funnel is the e-commerce term. It describes the different stages leading the buyer to the purchase. This process is described as a funnel because the seller, as a marketer, guides the customer towards the conversion point. The conversion funnel allows you to track and describe the consumer journey on your website through online advertising, e-commerce website navigation, or a search engine finally turning into a sale. Every company selling a product or service online over the Internet has a conversion funnel, and its main goal is to optimize that funnel for maximum results and drive more consumers to the conversion funnel. Conversion rate optimization should occur at each stage of the funnel in order to increase the number of people directed to the most important actions.
Example 11: Customer Life Cycle Funnel
This diagram was created in ConceptDraw DIAGRAM using the composition of libraries from the Funnel Diagrams Solution. An experienced user spent 10 minutes creating this sample.
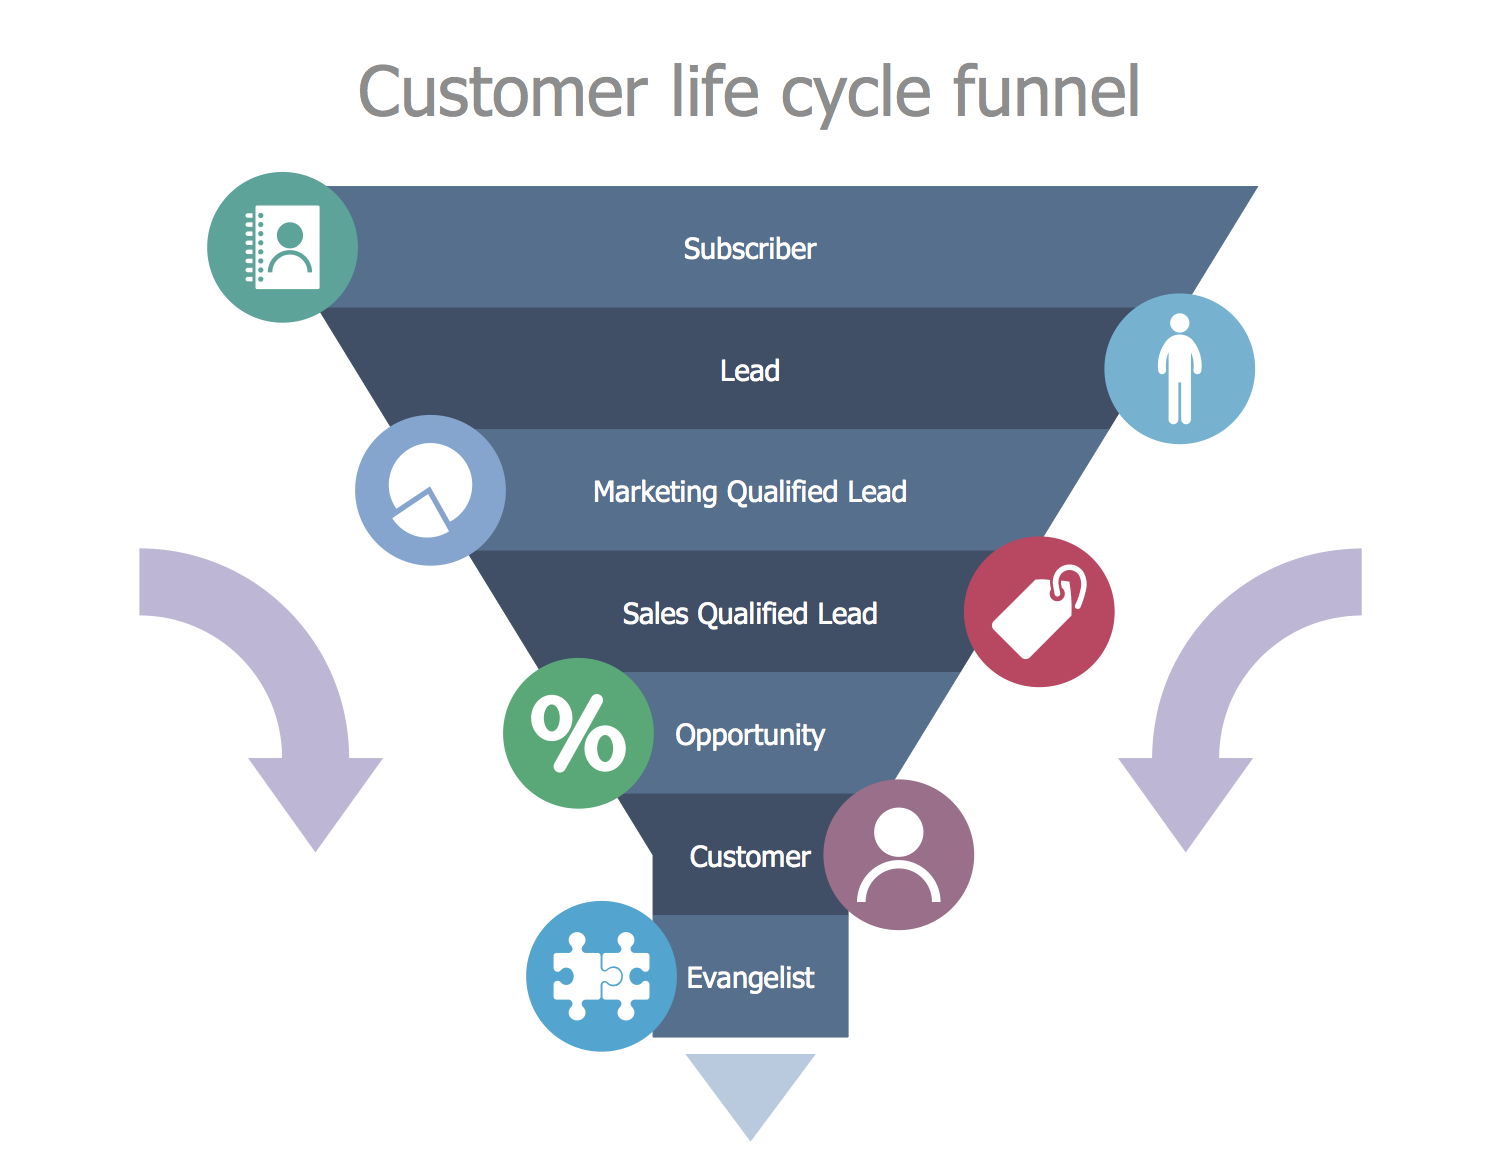
This Funnel diagram sample shows 7 stages of the customer life cycle: Subscriber, Lead, Marketing qualified lead, Sales qualified lead, Opportunity, Customer, Evangelist. The steps are listed in order at which they are placed in the funnel at the moving from a wide edge of funnel to its constriction. The interactions with contacts usually vary depending on the life cycle stage, on which they are. It is convenient and helpful in most cases to have ability to represent your contacts divided basing on this information. The funnel structure helps you to organize your contacts basing on the stage, on which they are in your sales cycle. One business differs from other, in some cases it differs cardinally. And depending on the structure and needs of a given business, you will have maybe all these lifecycle stages or only some of them. This structure is quite useful, when you need to create a custom contact functioning in a similar way.
Example 12: Lavidge et al's Hierarchy of Effects
This diagram was created in ConceptDraw DIAGRAM using the composition of libraries from the Funnel Diagrams Solution. An experienced user spent 10 minutes creating this sample.
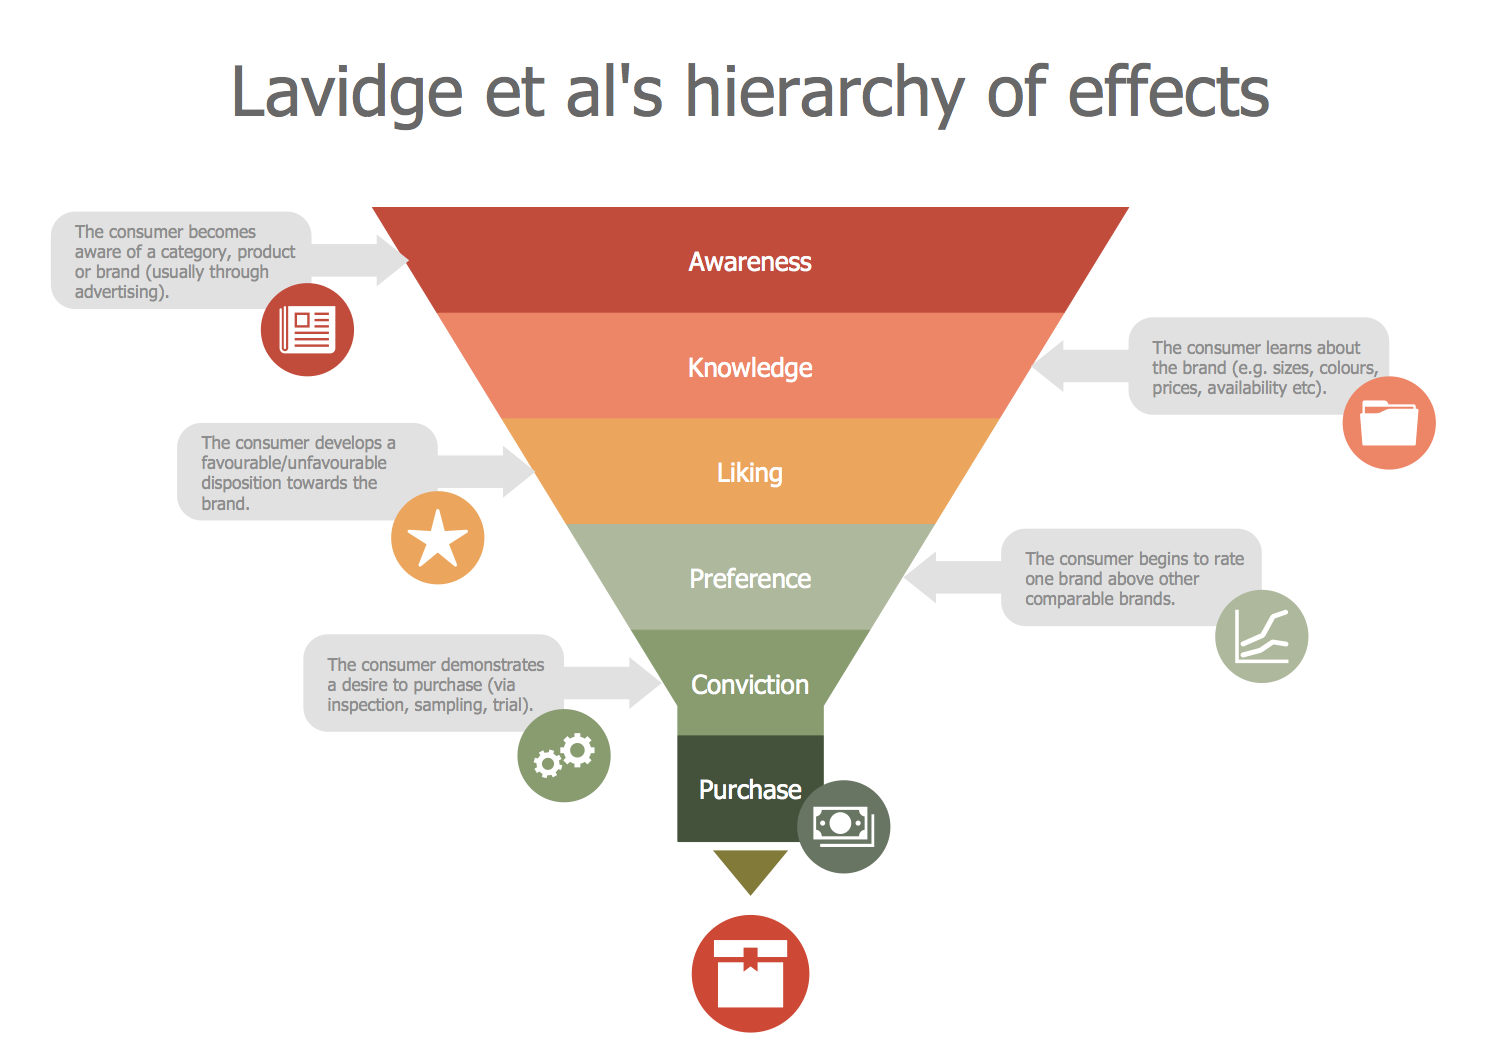
This Funnel diagram example illustrates 6 stages of Lavidge et al's hierarchy of effects: Awareness, Knowledge, Liking, Preference, Conviction, and Purchase. The hierarchy of effects is one of the basic hierarchical models. It was developed by Lavidge in 1960s. This model is based on getting the progress by customers passing the sequence of listed stages, from the brand awareness to the purchase of brand's product. The consumer meets with a product, brand or category on the Awareness stage, typically through the advertising. The Knowledge stage supposes the learning of the brand. On the Liking stage the consumer forms the favorable or unfavorable disposition towards the brand. Then, on the Preference stage the consumer gives the preference for one brand among other comparable brands and demonstrates the desire to make a purchase on the Conviction stage. Finally, we have the Purchase stage, when the consumer buys the product of a liked brand.
Example 13: Lead Generation Funnel
This diagram was created in ConceptDraw DIAGRAM using the composition of libraries from the Funnel Diagrams Solution. An experienced user spent 10 minutes creating this sample.
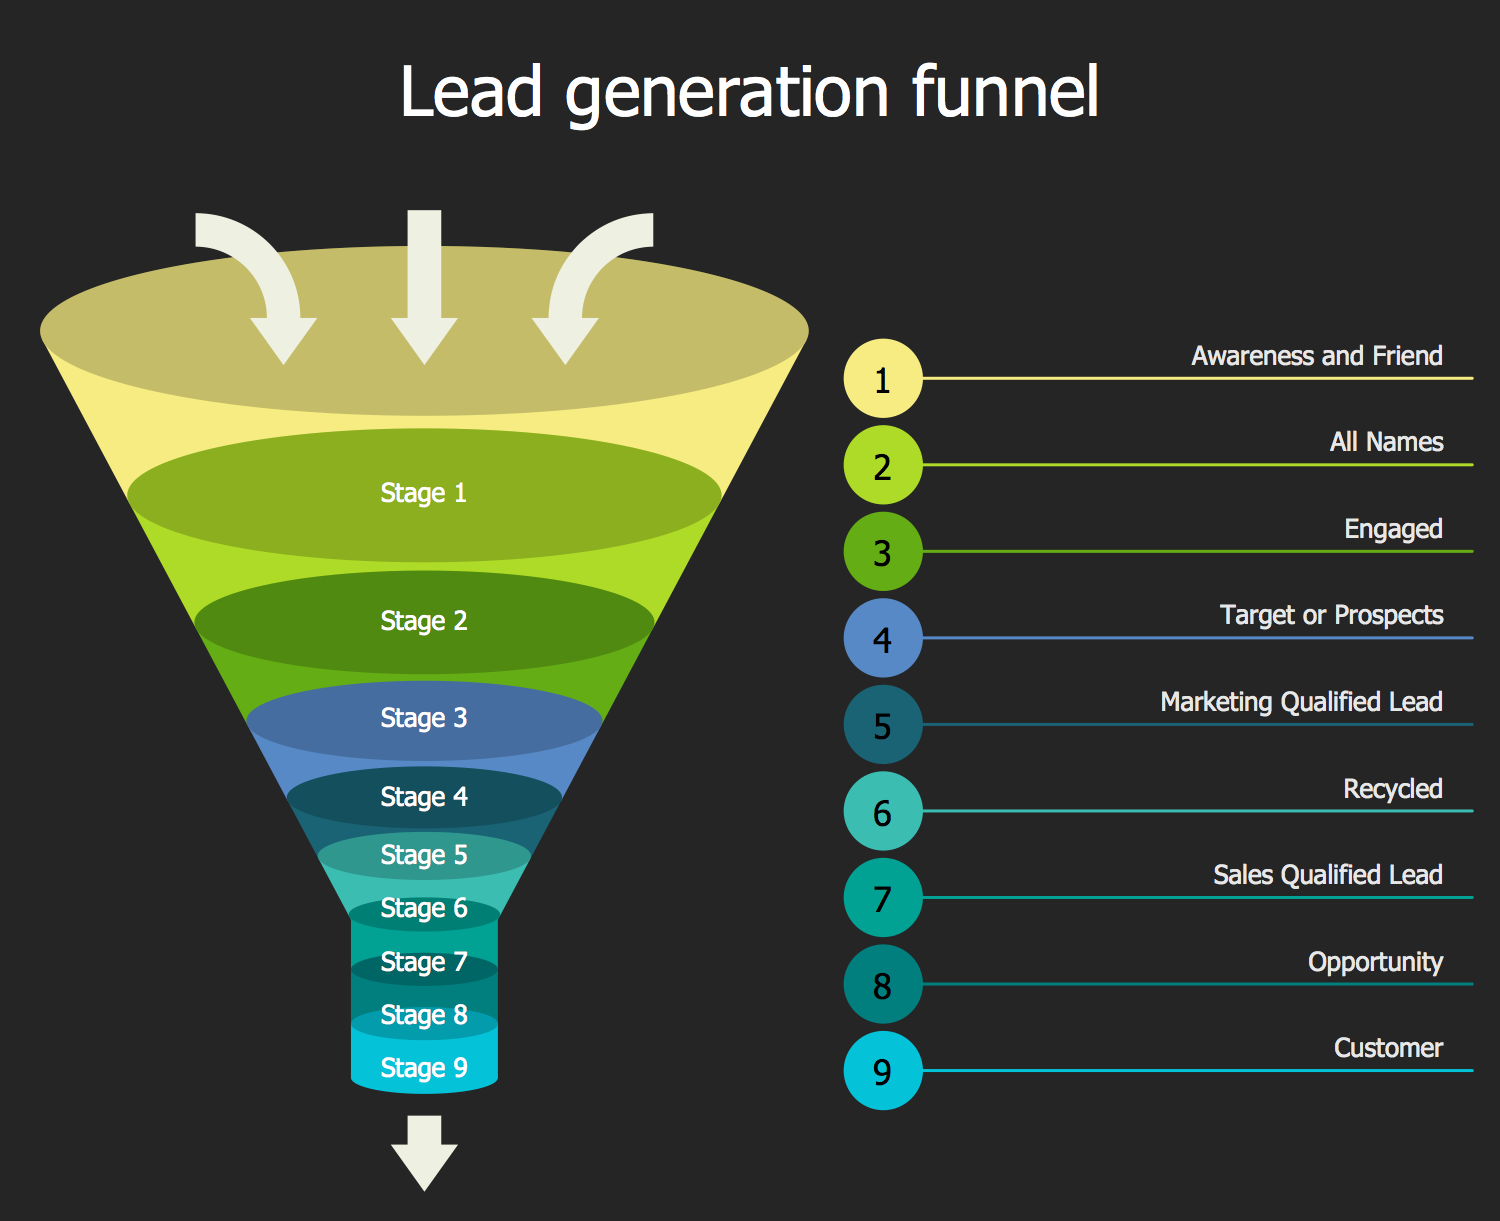
This Funnel diagram example depicts 9 stages of the lead generation funnel. One look at this diagram lets to capture them all: Awareness and Friend, All Names, Engaged, Target or Prospects, Marketing Qualified Lead, Recycled, Sales Qualified Lead, Opportunity, and Customer. The lead generation is one of the most important steps in marketing and sales. It is a marketing tactic aimed at the search of potential customers with defined contact data. In the future, they can become loyal paying customers. That’s why the lead generation process is quite important and assists in quick company's development and achievement maximal profitability in a shortest possible time. The clear representation of funnel's stages in this Funnel diagram and their right comprehension can help the marketers to gather the contacts of potential clients and effectively turn them into the customers. This Lead funnel diagram is colorful and attractive, each funnel stage is colored uniquely. You can study in details the colors' influence on people perception to choose the correct color gammas for your diagrams.
Example 14: Marketing Funnel
This diagram was created in ConceptDraw DIAGRAM using the composition of libraries from the Funnel Diagrams Solution. An experienced user spent 7 minutes creating this sample.
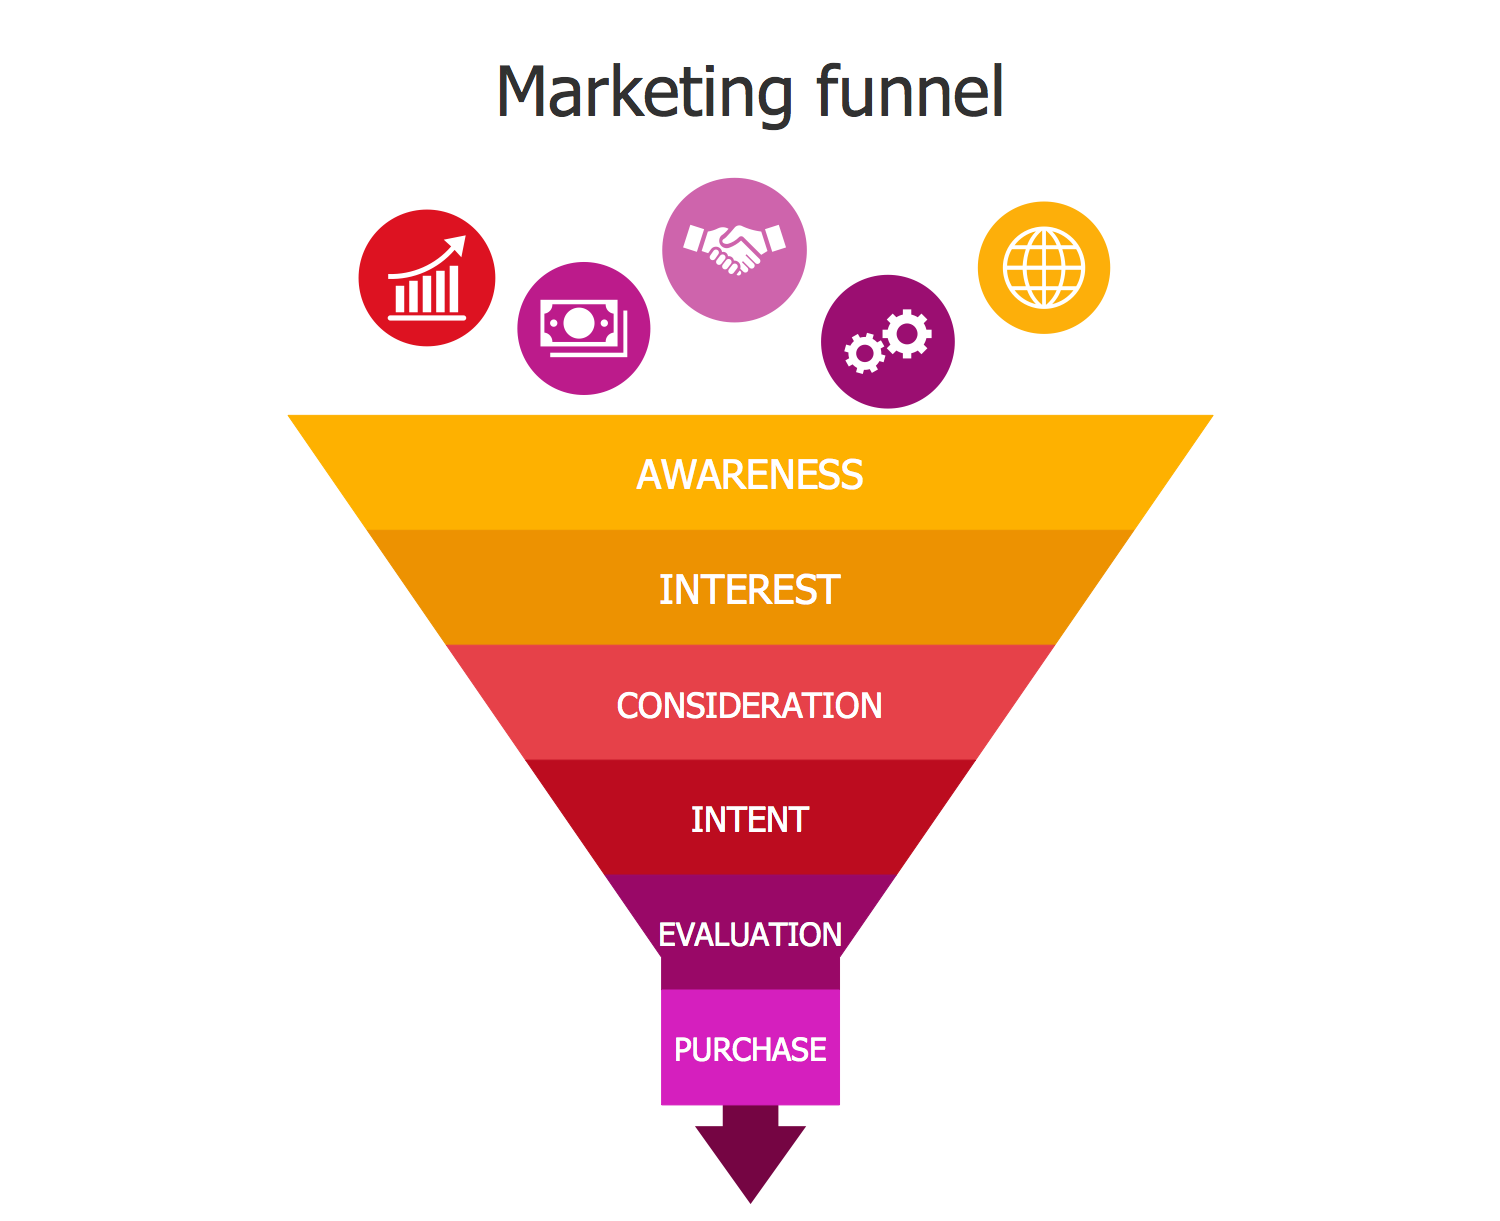
This sample is an example of the Marketing funnel with 6 stages: Awareness, Interest, Consideration, Intent, Evaluation, and Purchase. The Marketing funnel, also named a purchase funnel, purchasing funnel, or customer funnel, is a consumer-focused marketing model. It describes the theoretical journey of customers from the awareness about a product or service (the initial stage) to the actual conversion and purchase of a product or service (the final stage). It is a model widely used in marketing at the realization of promotional campaigns and in customer relationship management. Along with most of marketing models existing today, the Marketing funnel is the most resourceful and capacious, it includes many stages and is designed with accounting the modern technologies, specifics of consumers' behavior, repurchase intent, and other details. For additional clearness, you can add callouts on your Funnel diagram, they can include detailed descriptions for each stage represented on your diagram.
Example 15: Modified AIDA Model
This diagram was created in ConceptDraw DIAGRAM using the composition of libraries from the Funnel Diagrams Solution. An experienced user spent 5 minutes creating this sample.
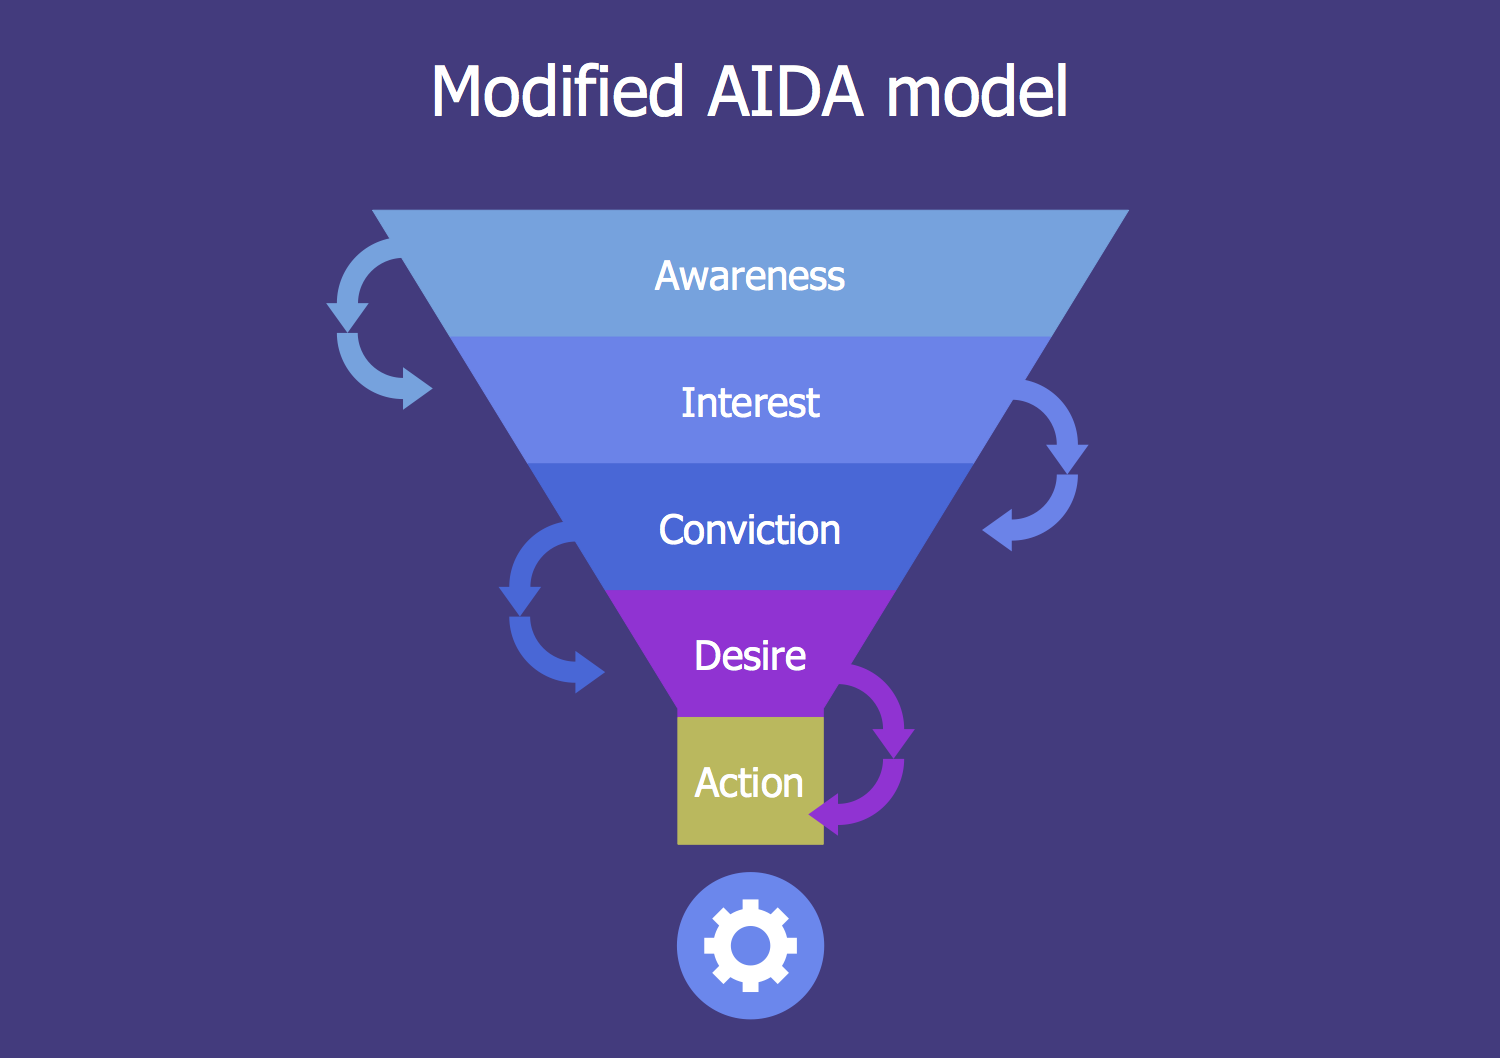
The abbreviation AIDA is decoded as Attention – Interest – Desire – Action. It is a model of consumer's behavior describing the sequence of events on the path of making a purchase. According to this model, you must first attract attention of the potential consumers (A) and provoke interest to the proposed product (I). Then, you need to cause the desire to make the purchase of product (D) and at the last step to turn the interested human into a buyer (A). Developed in 1898, the classic AIDA model had since some modifications in accordance with changes in realities of life and in consumers' psychology. However, the basic mechanisms remained unchanged many years. If we will talk about today's market, the large segment of the market is now occupied in e-Commerce, however the classic techniques are also applicable for them. This Funnel diagram sample shows 5 stages of the modified AIDA model: Awareness, Interest, Conviction, Desire, and Action.
Example 16: Online Sales Funnel
This diagram was created in ConceptDraw DIAGRAM using the composition of libraries from the Funnel Diagrams Solution. An experienced user spent 10 minutes creating this sample.
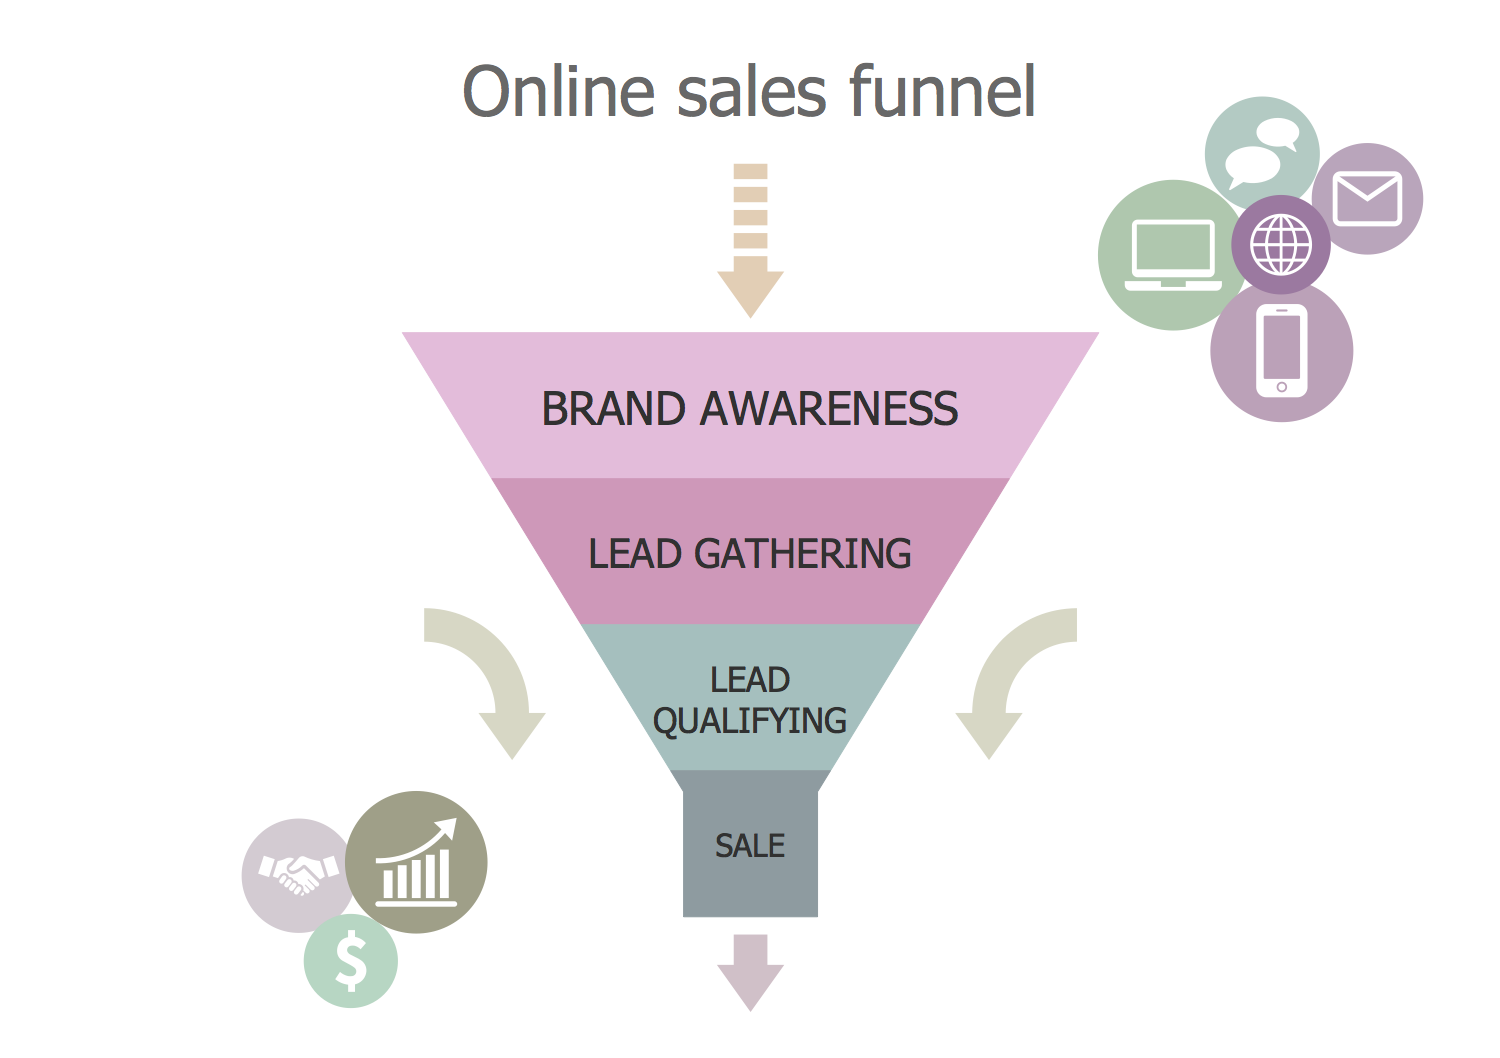
This sample is an Online sales funnel consisting of 4 stages: Brand Awareness, Lead Gathering, Lead Qualification, Sales. An Online sales funnel is very similar to, but slightly different from, a traditional sales funnel. The process starts with the brand awareness stage, then customers are collected and qualified, after which the sale takes place, and potential customers turn into solid customers. The Online sales funnel resembles a roadmap that takes consumers to purchase from the moment they become potential buyers. Every time you see a banner, research a product online and then buy it, you are taken into an online sales funnel. Colorful and attractive clipart is the best addition to your diagram. It makes it more informative and interesting for the audience when showing these diagrams on the big screen. From the ConceptDraw libraries, you can add a variety of pictures and clipart to make your diagrams successful.
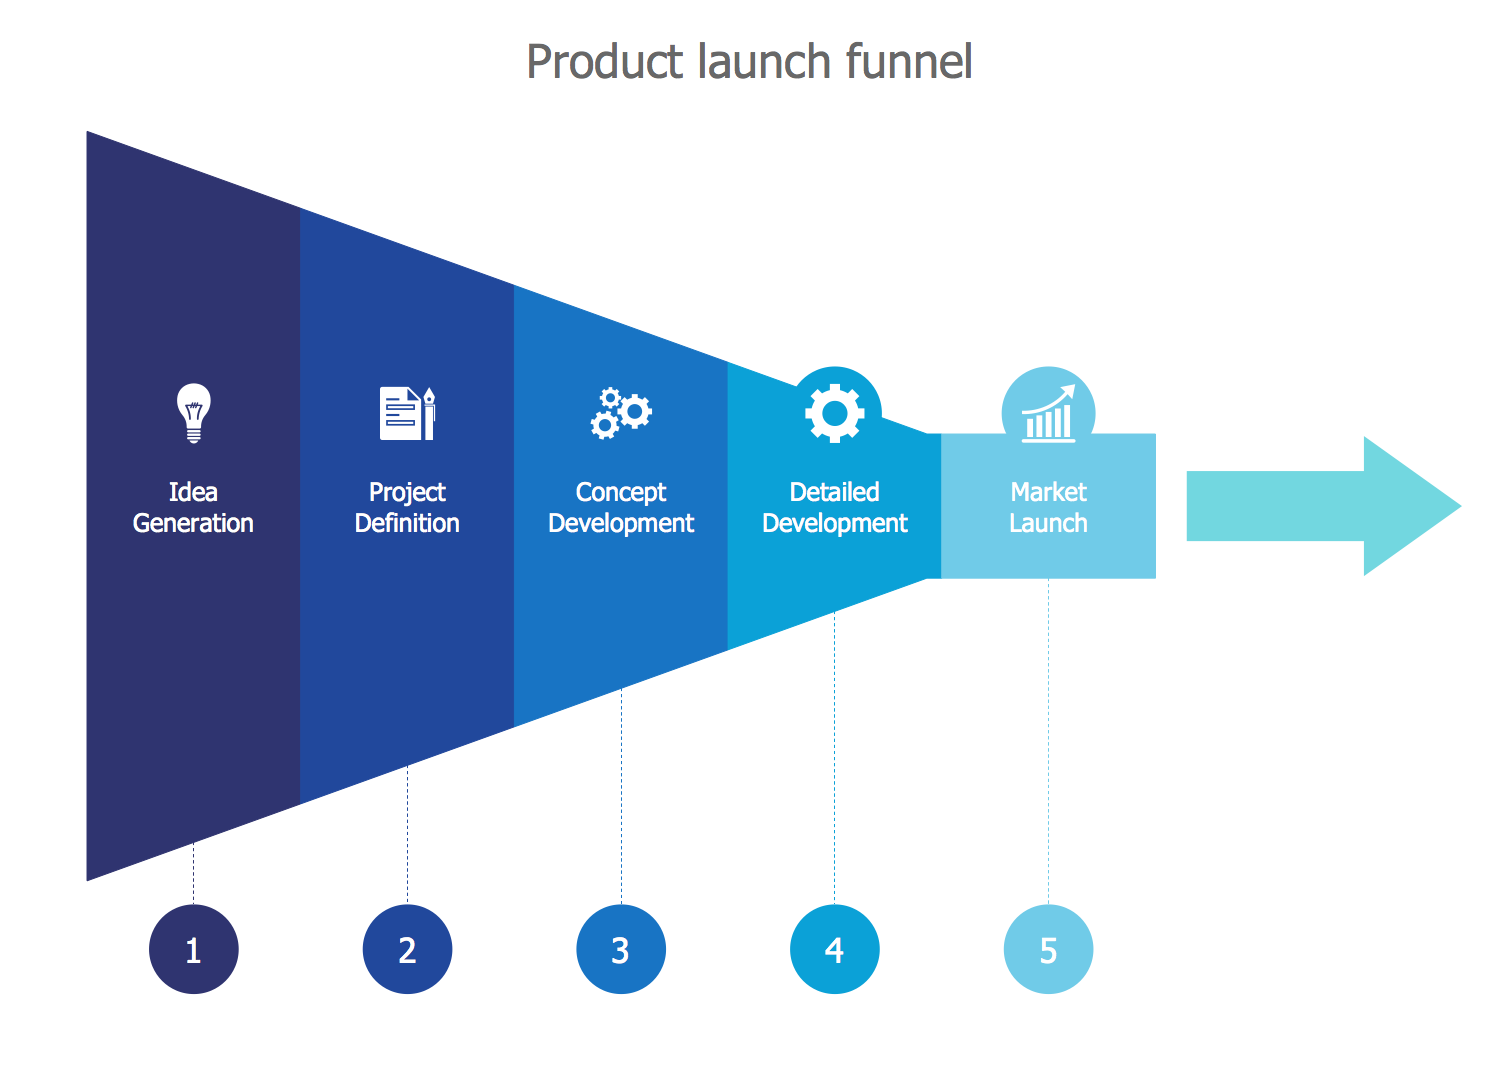
Example 17: Product Launch Funnel
This diagram was created in ConceptDraw DIAGRAM using the composition of libraries from the Funnel Diagrams Solution. An experienced user spent 7 minutes creating this sample.
This sample of Funnel diagram depicts 5 stages of the product launch funnel: Idea generation, Project definition, Concept development, Detailed development, and Market launch. The product launch is an introduction of a new product on the market and its first appearance before consumers. The step of the product launch occurs after the moment when new product is developed and finished by the company, and is ready to hit on the market. The product launch can be both easy and complex process according to the type of product, company's capabilities and staff qualification. But the product launch is only beginning. Since this moment you need regularly research the market, spend effective PR and advertising companies directed on the capture of wide target audience. In addition, you need to monitor the product promotion on the market, control and enhance its competitiveness and development. This Funnel diagram is quite strict, meanwhile the placement of vector clipart makes it more vivid and live.
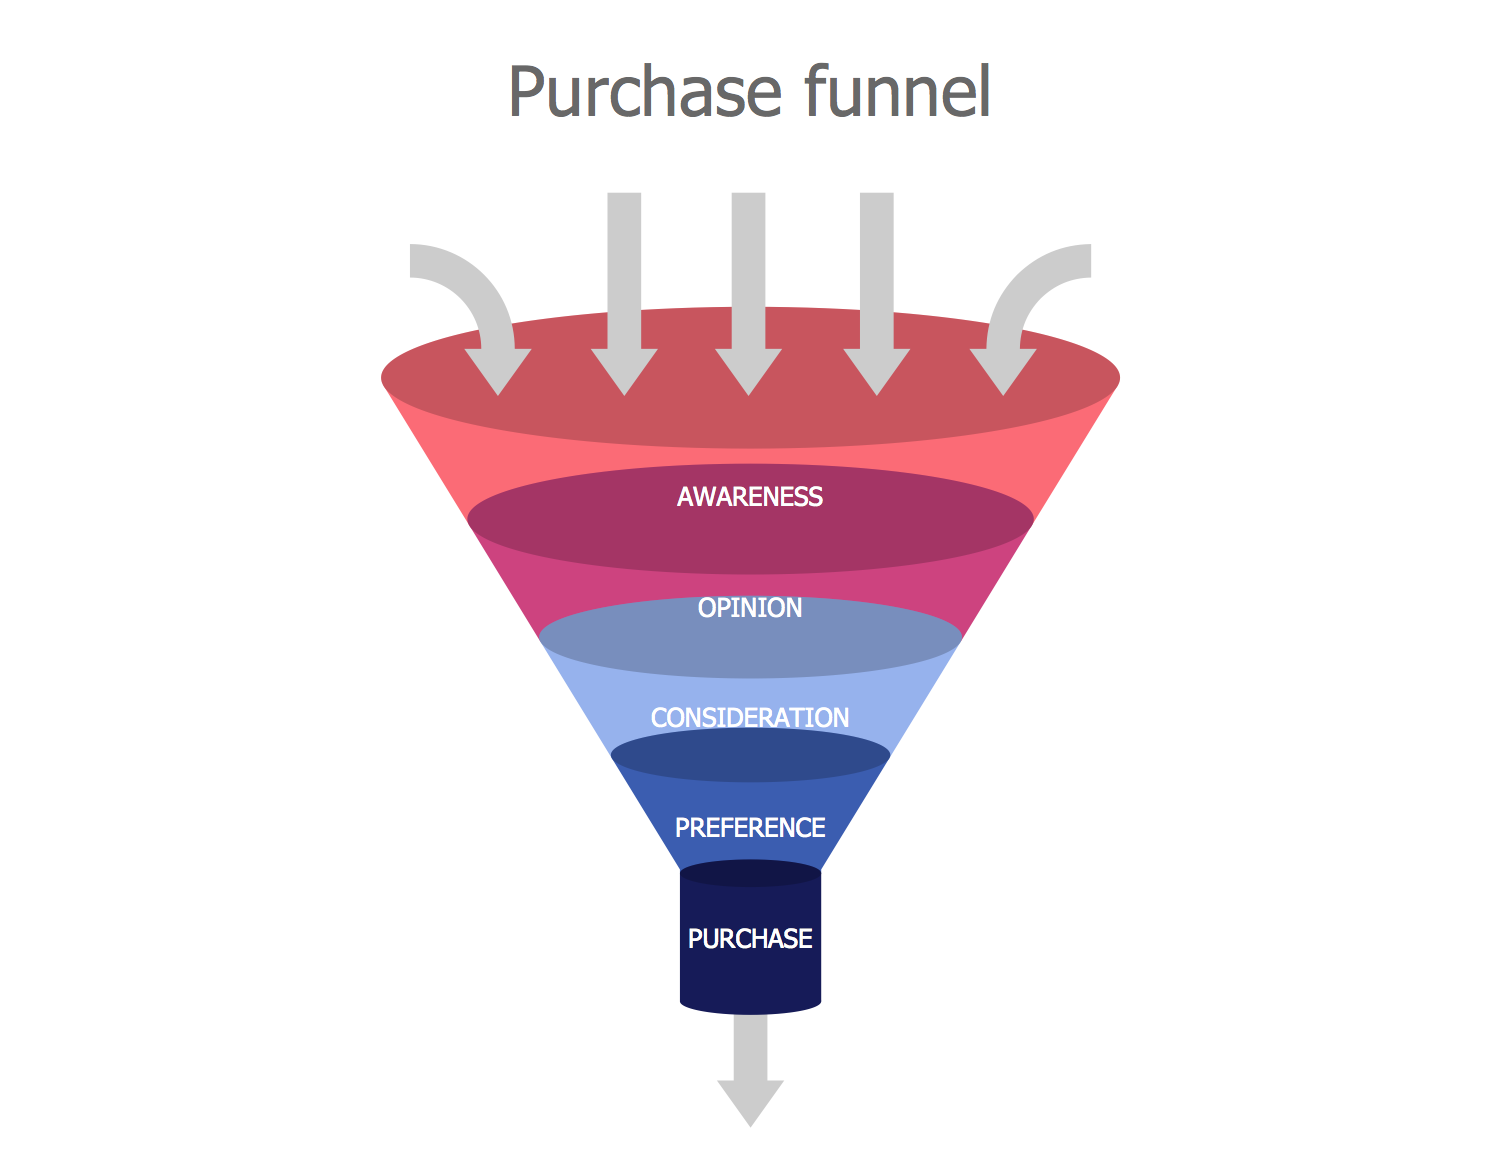
Example 18: Purchase Funnel
This diagram was created in ConceptDraw DIAGRAM using the composition of libraries from the Funnel Diagrams Solution. An experienced user spent 5 minutes creating this sample.
This sample diagram presents a Purchase Funnel that includes 5 stages: Awareness, Opinion, Consideration, Preference, and Purchase. It summarizes the modern shopping funnel in view of the emergence of internet research. There are many people who do not become instant shoppers, they carefully study, compare and evaluate several options before choosing the one they want and buying it. And the purchase funnel makes it easy to track and show the long journey of potential customers to regular customers of a particular product. This allows you to effectively analyze the customer acquisition process, how potential customers discover a new product or brand, and how they become loyal customers. This diagram shows a typical and simple purchase funnel. In some cases, it can be expanded with additional steps, for example, pre-informing and research, and reflect post-purchase behavior. ConceptDraw DIAGRAM with Funnel Diagrams Solution helps you manage your funnel and make diagrams as detailed as you need them.
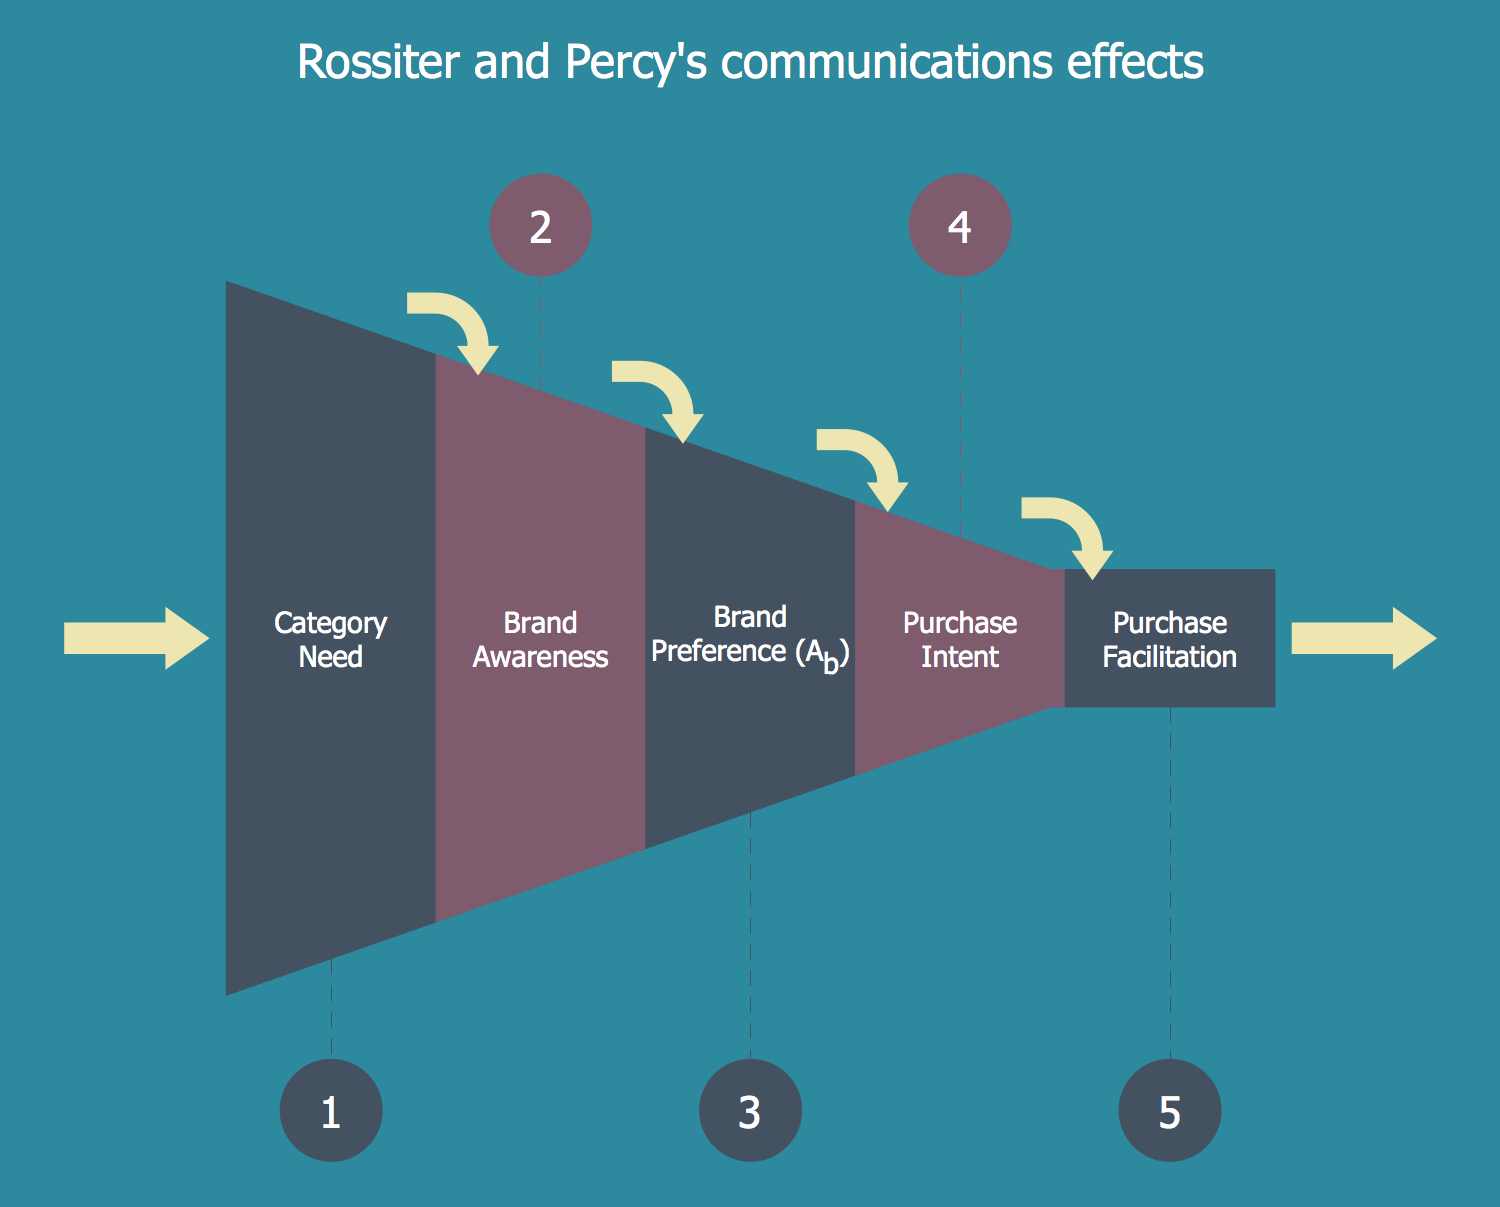
Example 19: Rossiter and Percy's Communications Effects
This diagram was created in ConceptDraw DIAGRAM using the composition of libraries from the Funnel Diagrams Solution. An experienced user spent 10 minutes creating this sample.
This sample Funnel diagram shows 5 stages of the Rossiter and Percy's communications effects, these are: Category Need, Brand Awareness, Brand Preference (Ab), Purchase Intent, and finally Purchase Facilitation. This is a hierarchical model. Similarly to other models of this type, it includes the sequence of following components: Cognition (C), Affect (A) and Behavior (B). This is why hierarchical models are also known as C-A-B models. While the stages may differ, the brand awareness and purchase stages are fundamental to the group of hierarchical exposure patterns. It is a linear sequential model, it assumes that consumers go through a series of stages before making a purchase decision, and this process usually begins with brand awareness. In these models, advertising and marketing communications play a large role in a shopper's purchasing decision. The Rossiter and Percy model is a simplified hierarchical model that deals with advertising influence.
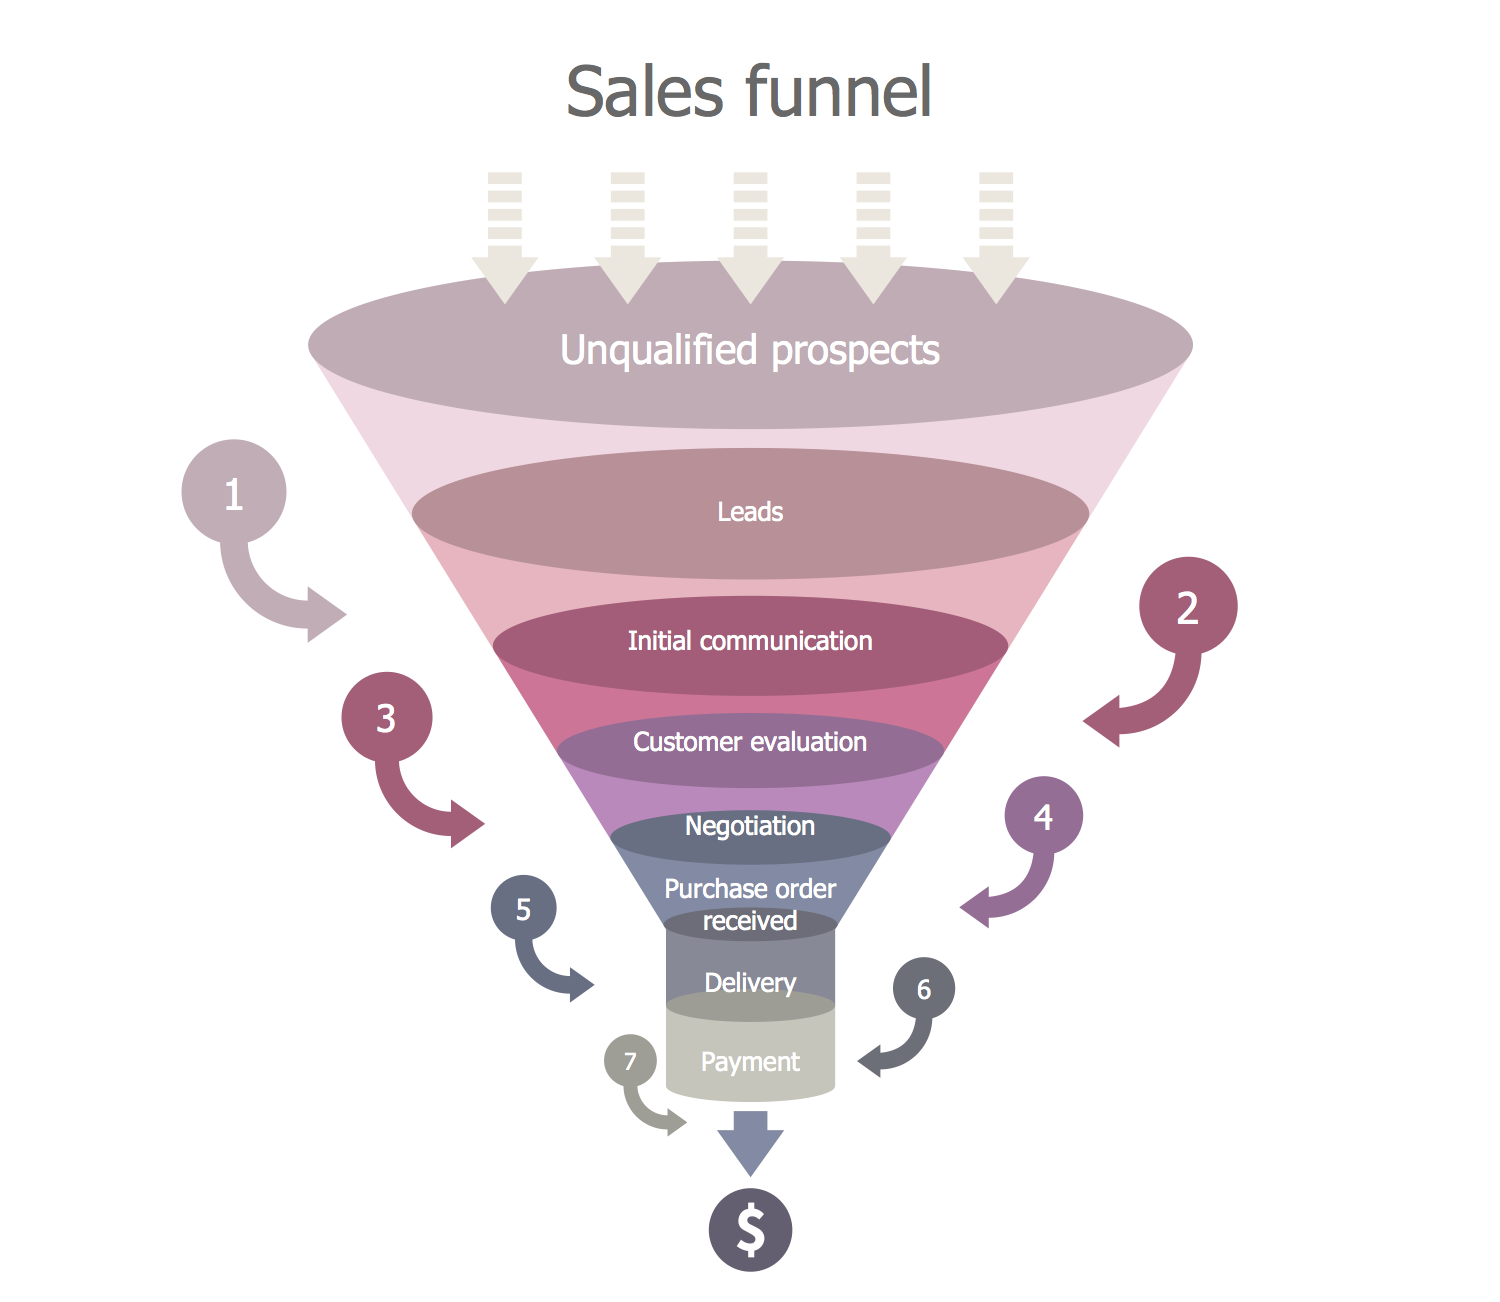
Example 20: Sales Funnel
This diagram was created in ConceptDraw DIAGRAM using the composition of libraries from the Funnel Diagrams Solution. An experienced user spent 10 minutes creating this sample.
This Funnel diagram sample depicts the 7 stages of a sales funnel (plus a purchase funnel, marketing funnel, or customer funnel): Leads, Initial Communication, Customer Rating, Negotiations, Purchase Order Received, Shipping, and Checkout. A sales funnel is one of the main business tools for any business and business people. This is an ideal way to demonstrate and observe the stages of the customer's movement towards the main goal, that is, to buy a service or product of the desired brand, starting with the proposal of the product and the first contact with it. A well-built sales funnel helps your business operate efficiently, increase sales of your goods or services, and, accordingly, significantly increase profits. Moreover, the correct use of the sales funnel allows you to subtly, unobtrusively influence potential customers and imperceptibly adjust to their needs. With ConceptDraw DIAGRAM, you can easily create an effective sales funnel and business funnel.
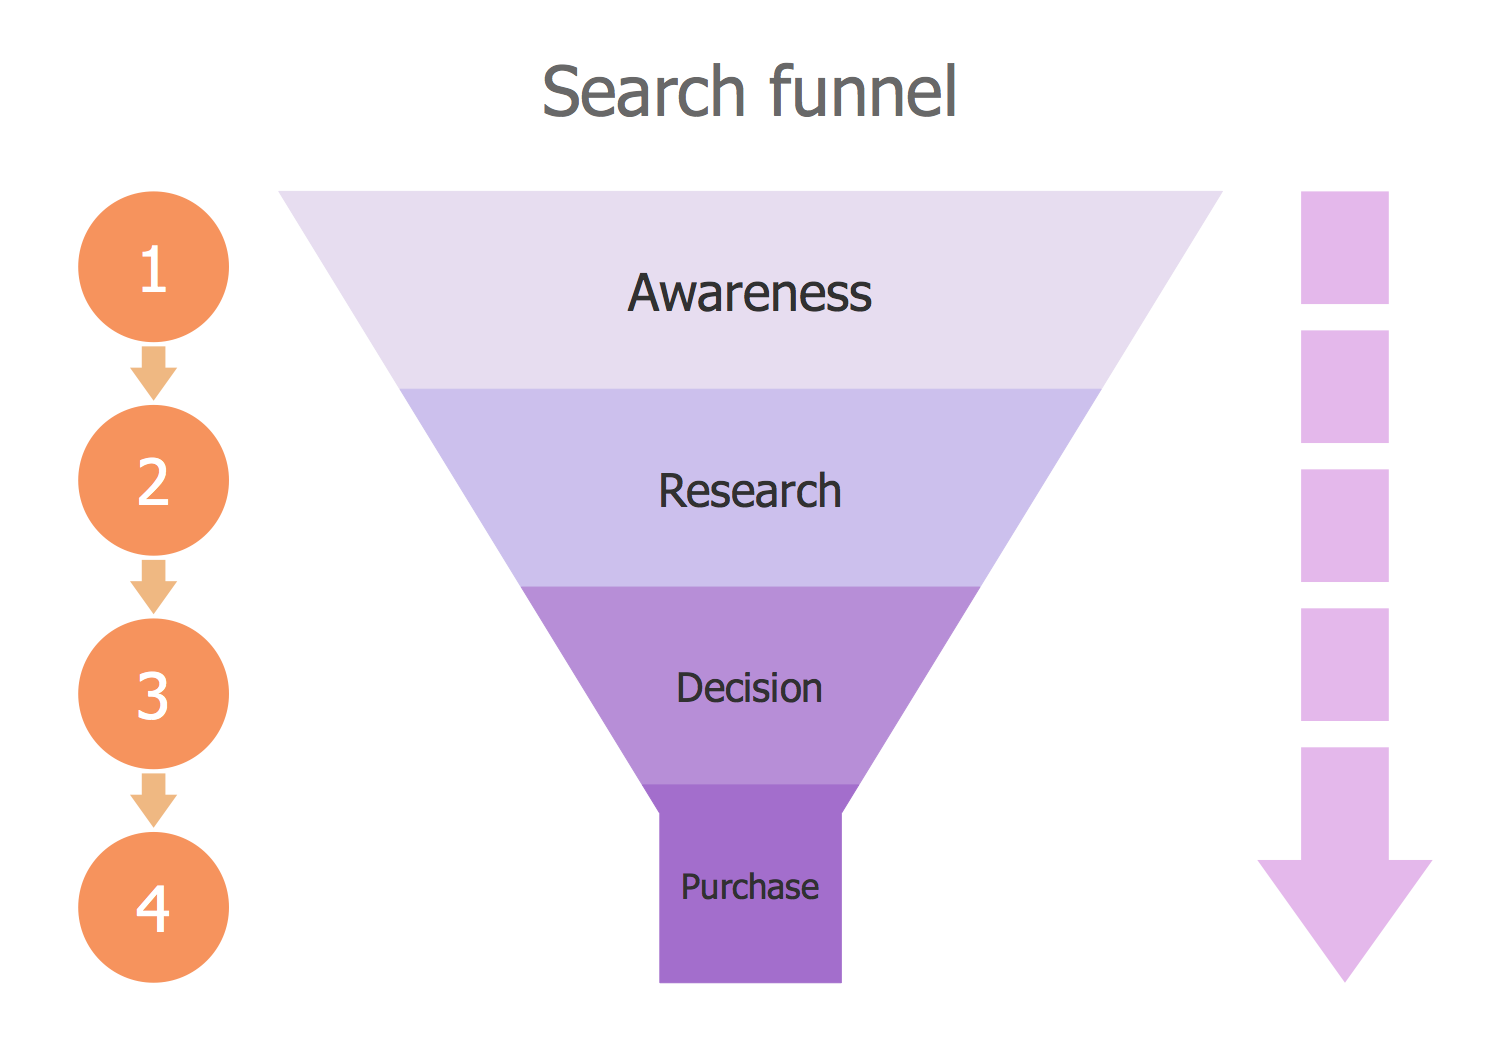
Example 21: Search Funnel
This diagram was created in ConceptDraw DIAGRAM using the composition of libraries from the Funnel Diagrams Solution. An experienced user spent 5 minutes creating this sample.
This Search funnel diagram sample shows 4 keyword categories: Awareness, Research, Decision, and Purchase. The Search Funnel is a professional and popular tool for the marketers, advertisers, businessmen, and all other people who are interested in selling their production and development effective marketing strategy. It is a visual way to depict the stages of the customer path to the purchase and its behavior during this path. Each funnel stage is important in its own way and the customer's behavior greatly differs on each stage. This path typically begins from the curiosity, awareness, then moves to the mindset and conduction specific researches, and ends by the customer's decision to buy the product and by actual making the purchase. ConceptDraw DIAGRAM software extended with Funnel Diagrams solution allows you to construct your Funnel diagrams of any design, direction of arrangement the funnel object, color intensity, etc. Besides, it is visually effective to number the stages of your funnel on the diagram.
More Examples and Templates

1 Stage 3D Horizontal Funnel Template
1 Stage 3D Vertical Funnel Template
1 Stage Horizontal Funnel Template
1 Stage Vertical Funnel Template
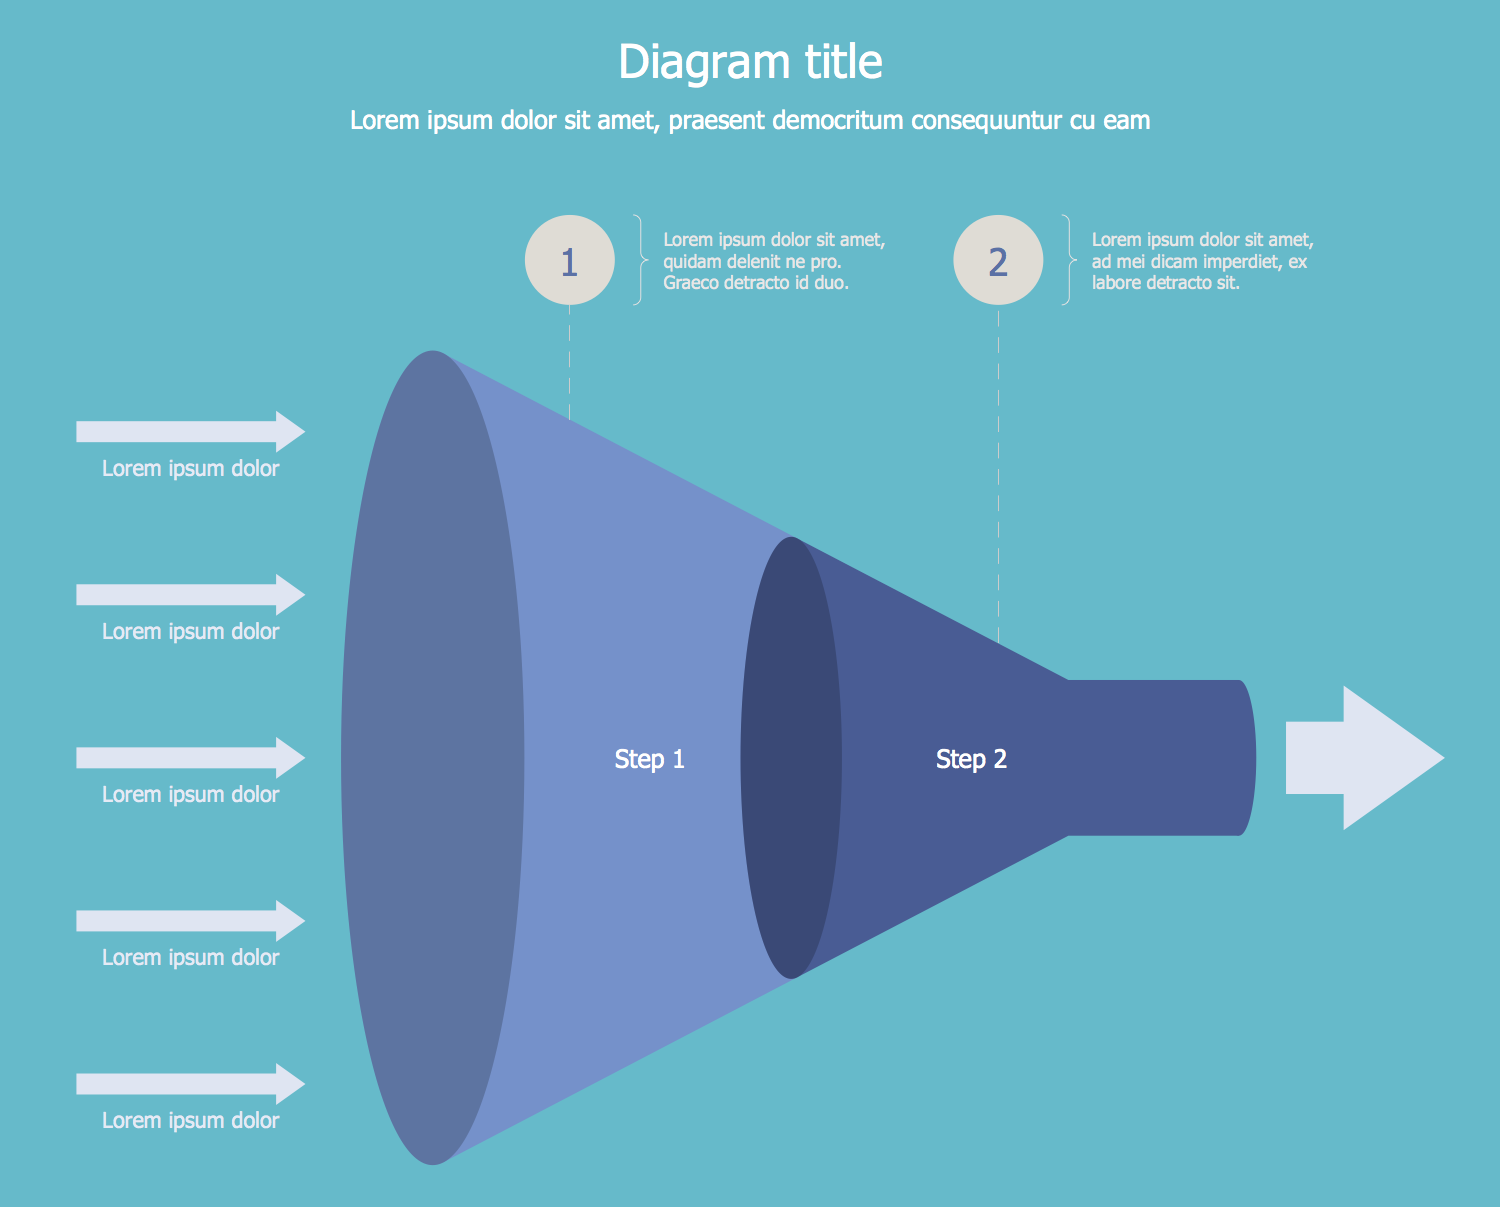
2 Stage 3D Horizontal Funnel Template
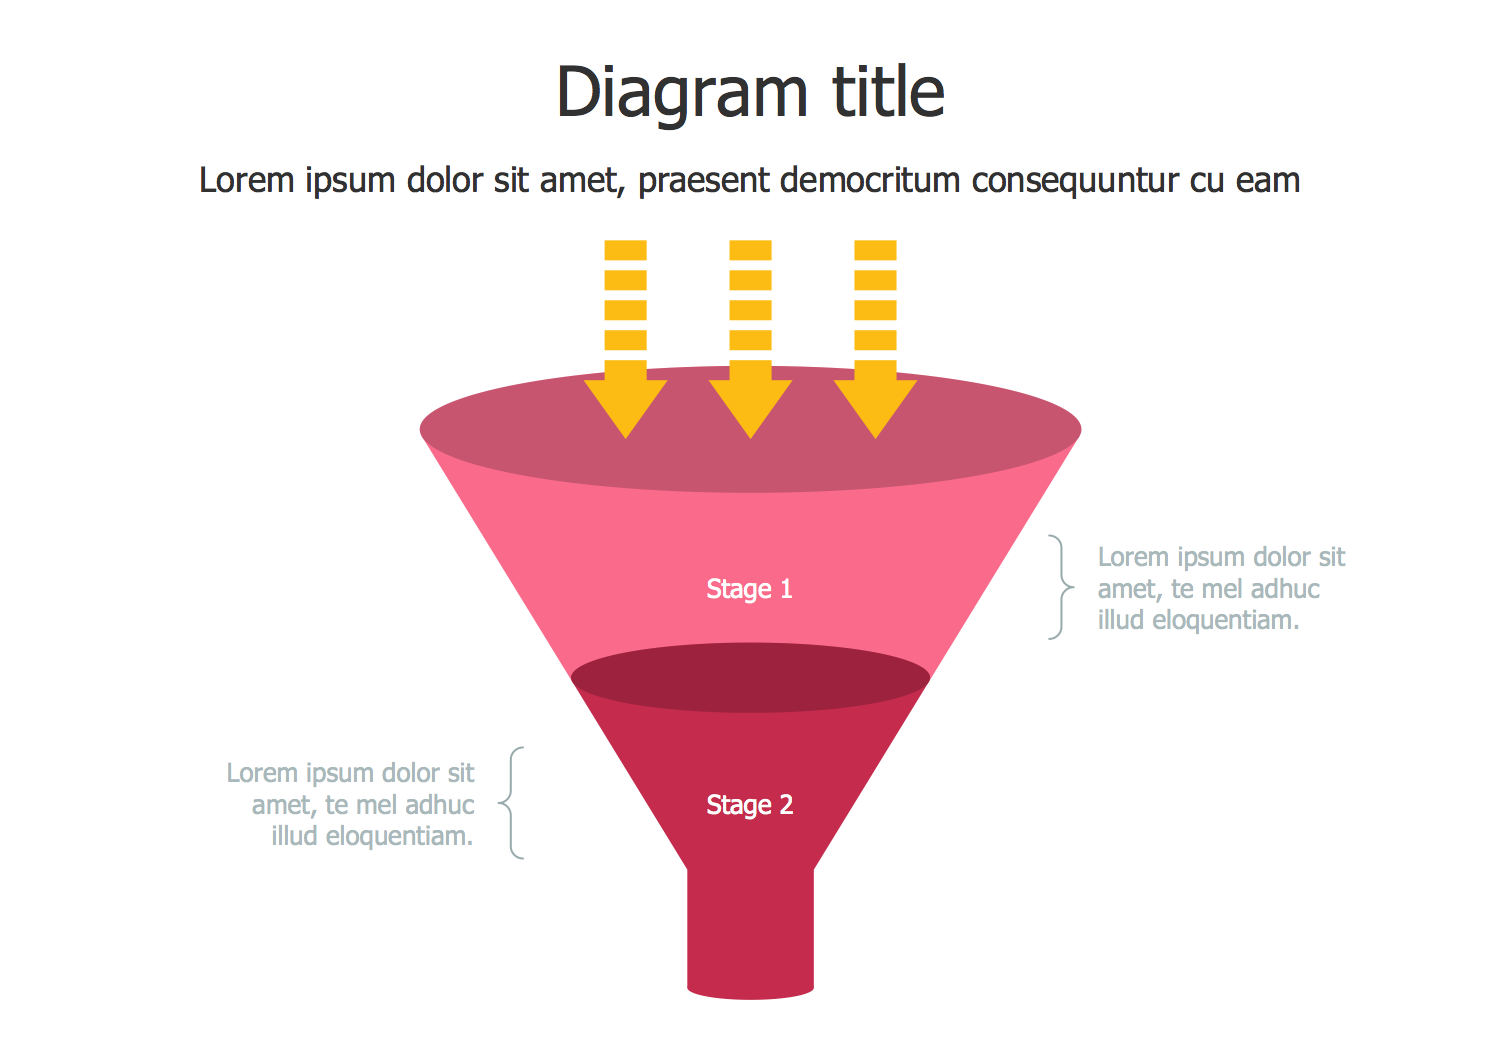
2 Stage 3D Vertical Funnel Template
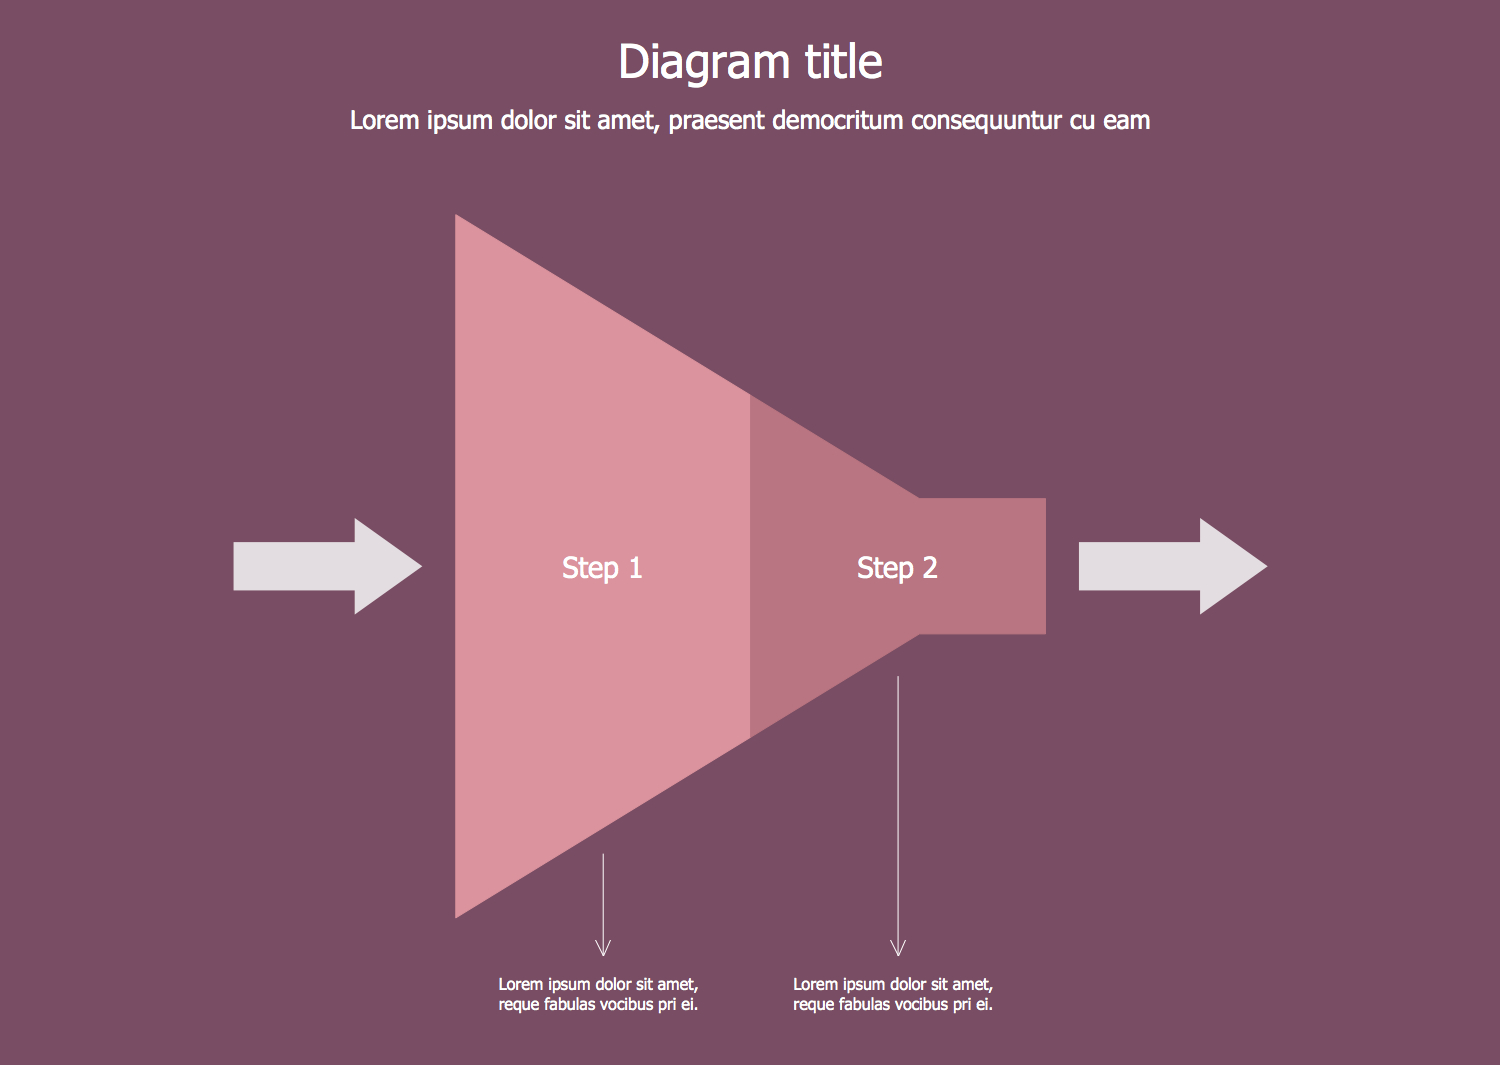
2 Stage Horizontal Funnel Template
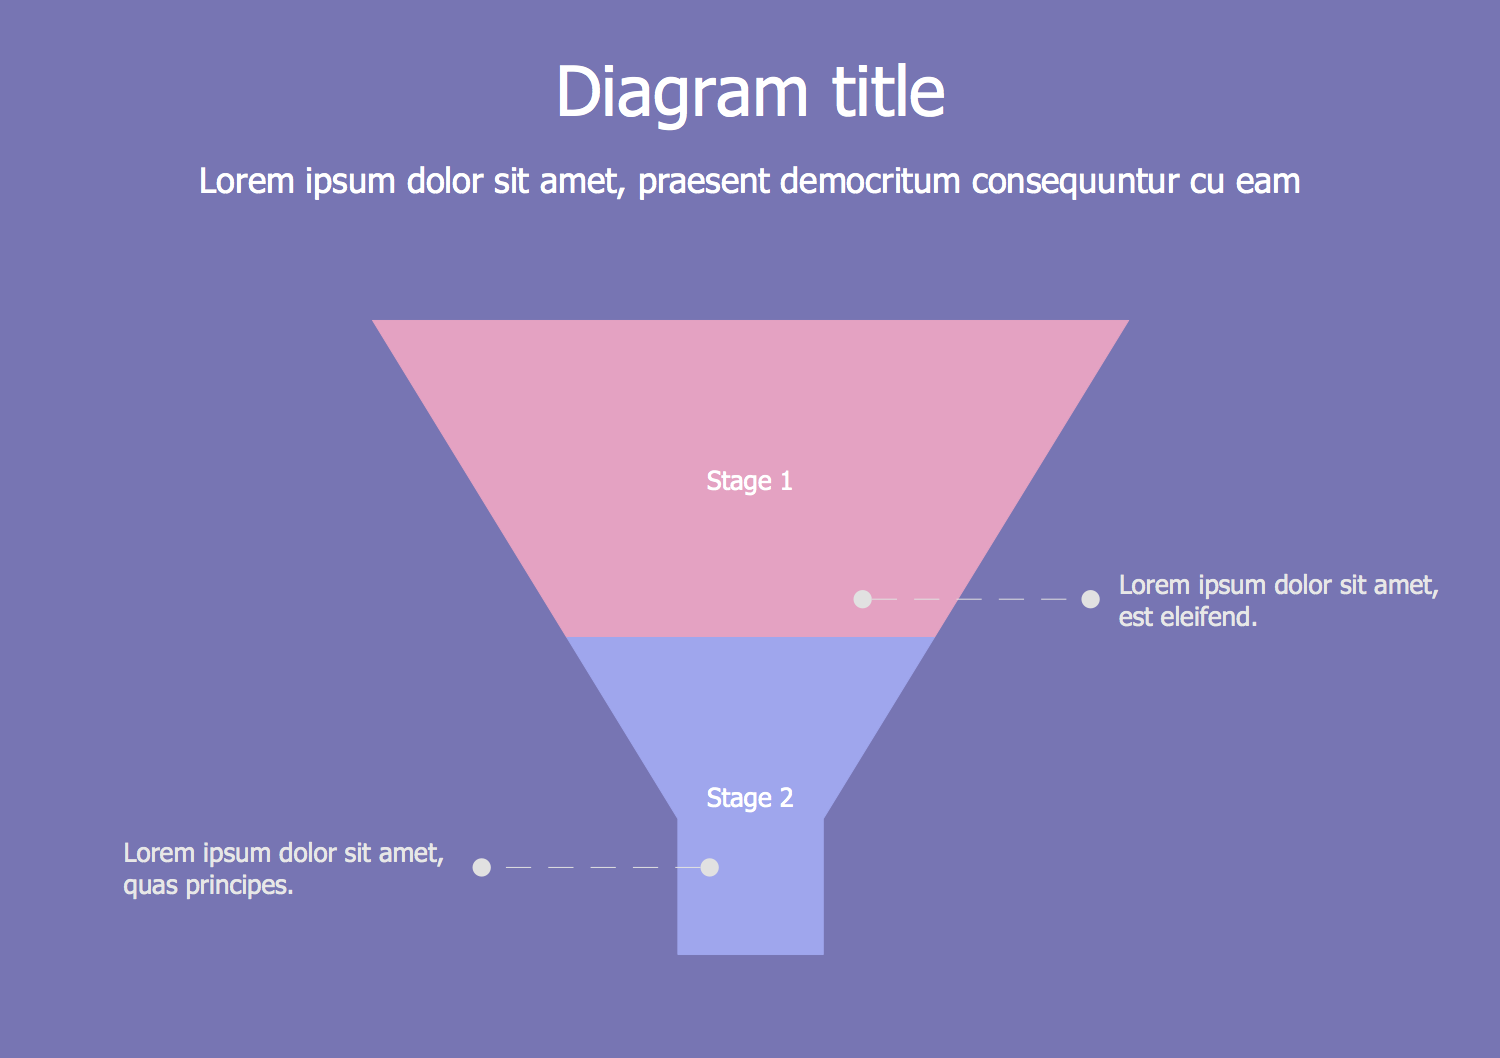
2 Stage Vertical Funnel Template
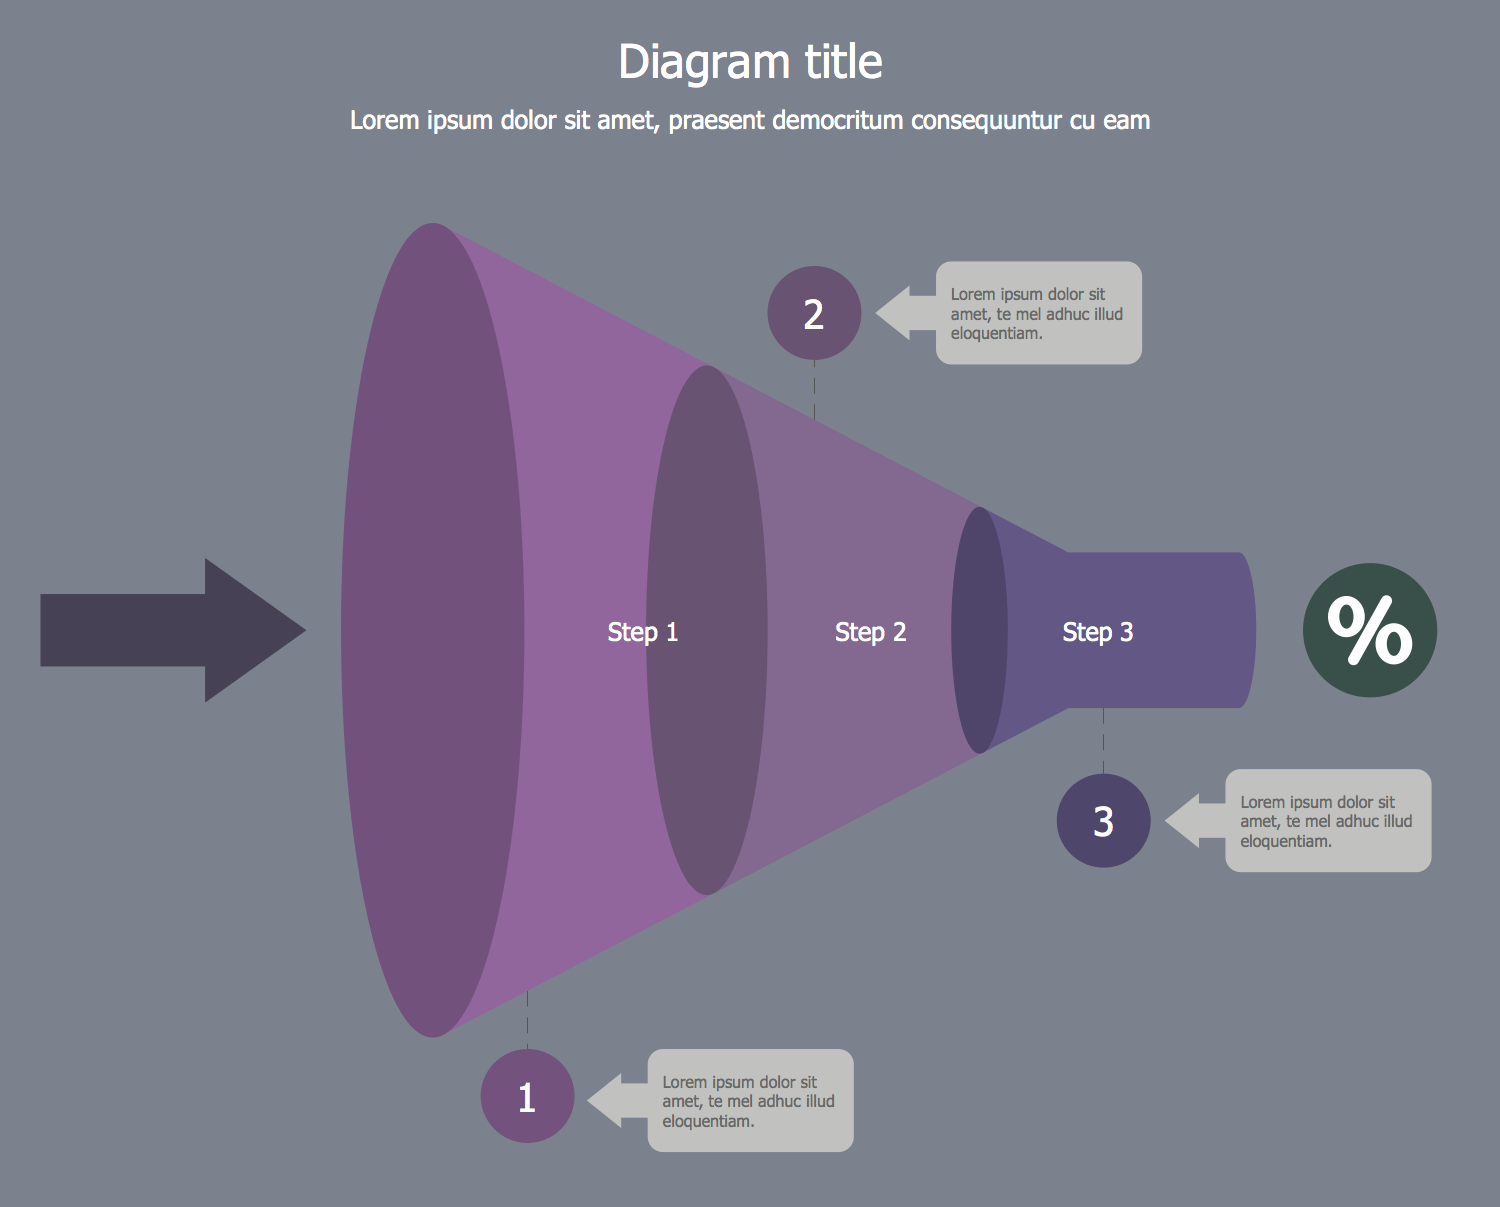
3 Stage 3D Horizontal Funnel Template
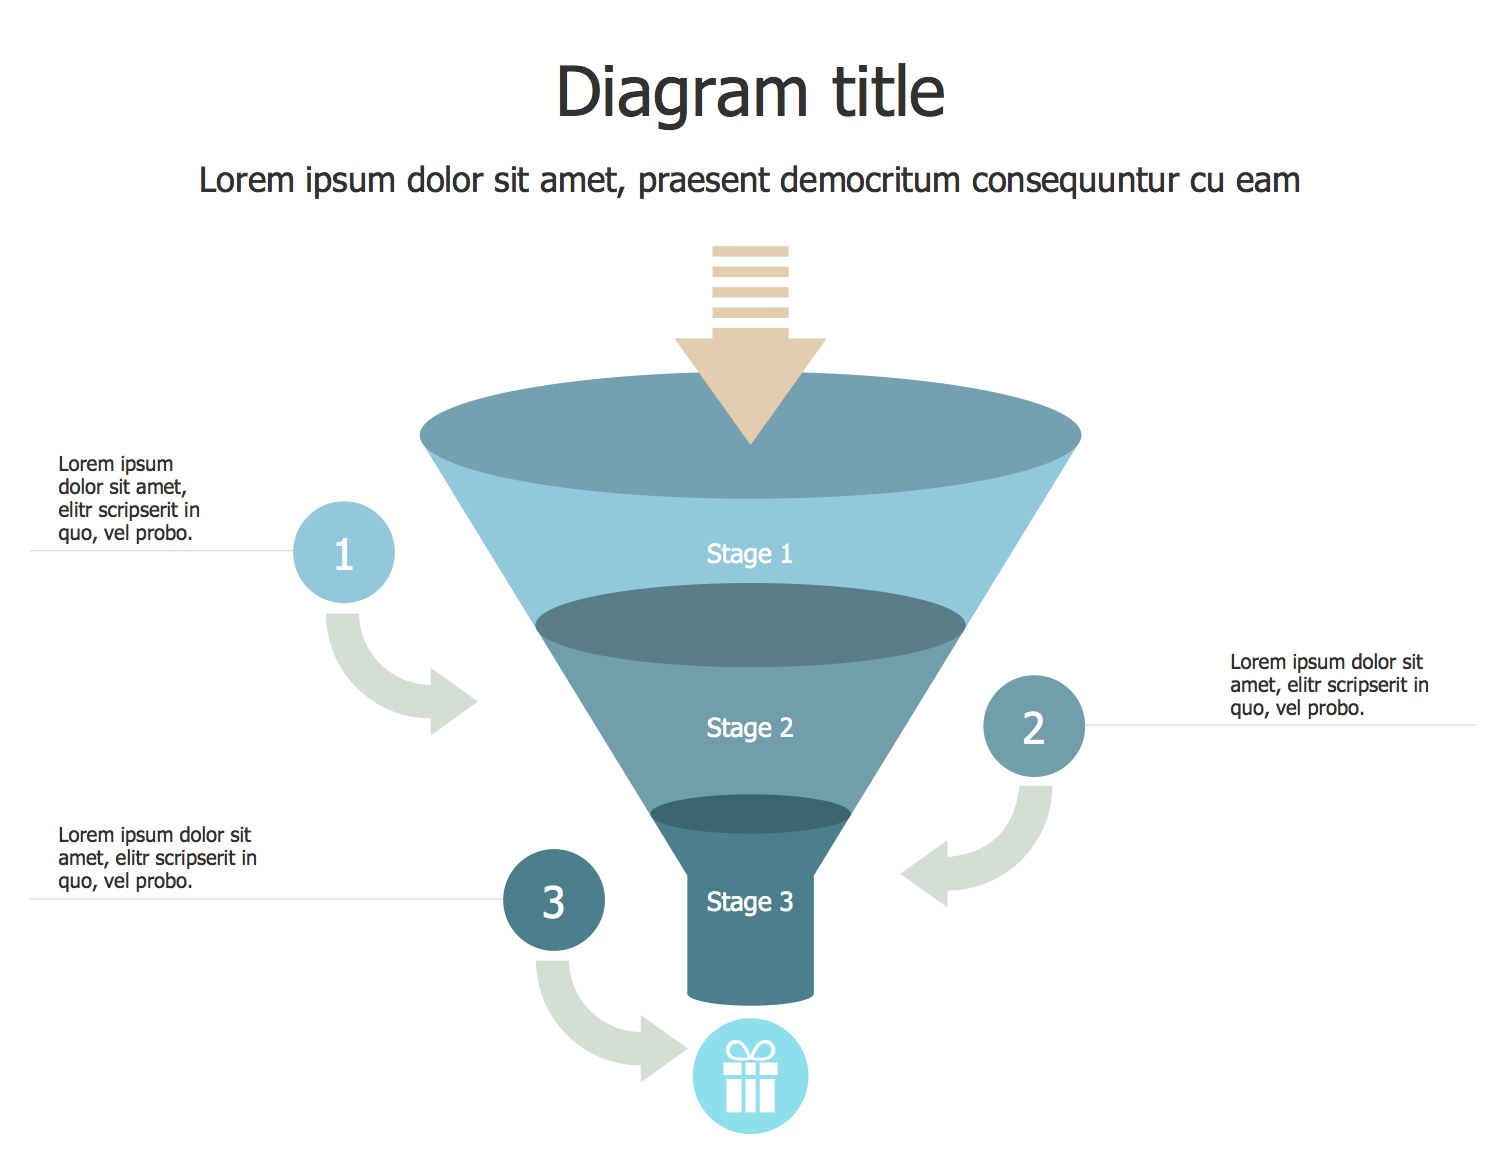
3 Stage 3D Vertical Funnel Template

3 Stage Horizontal Funnel Template
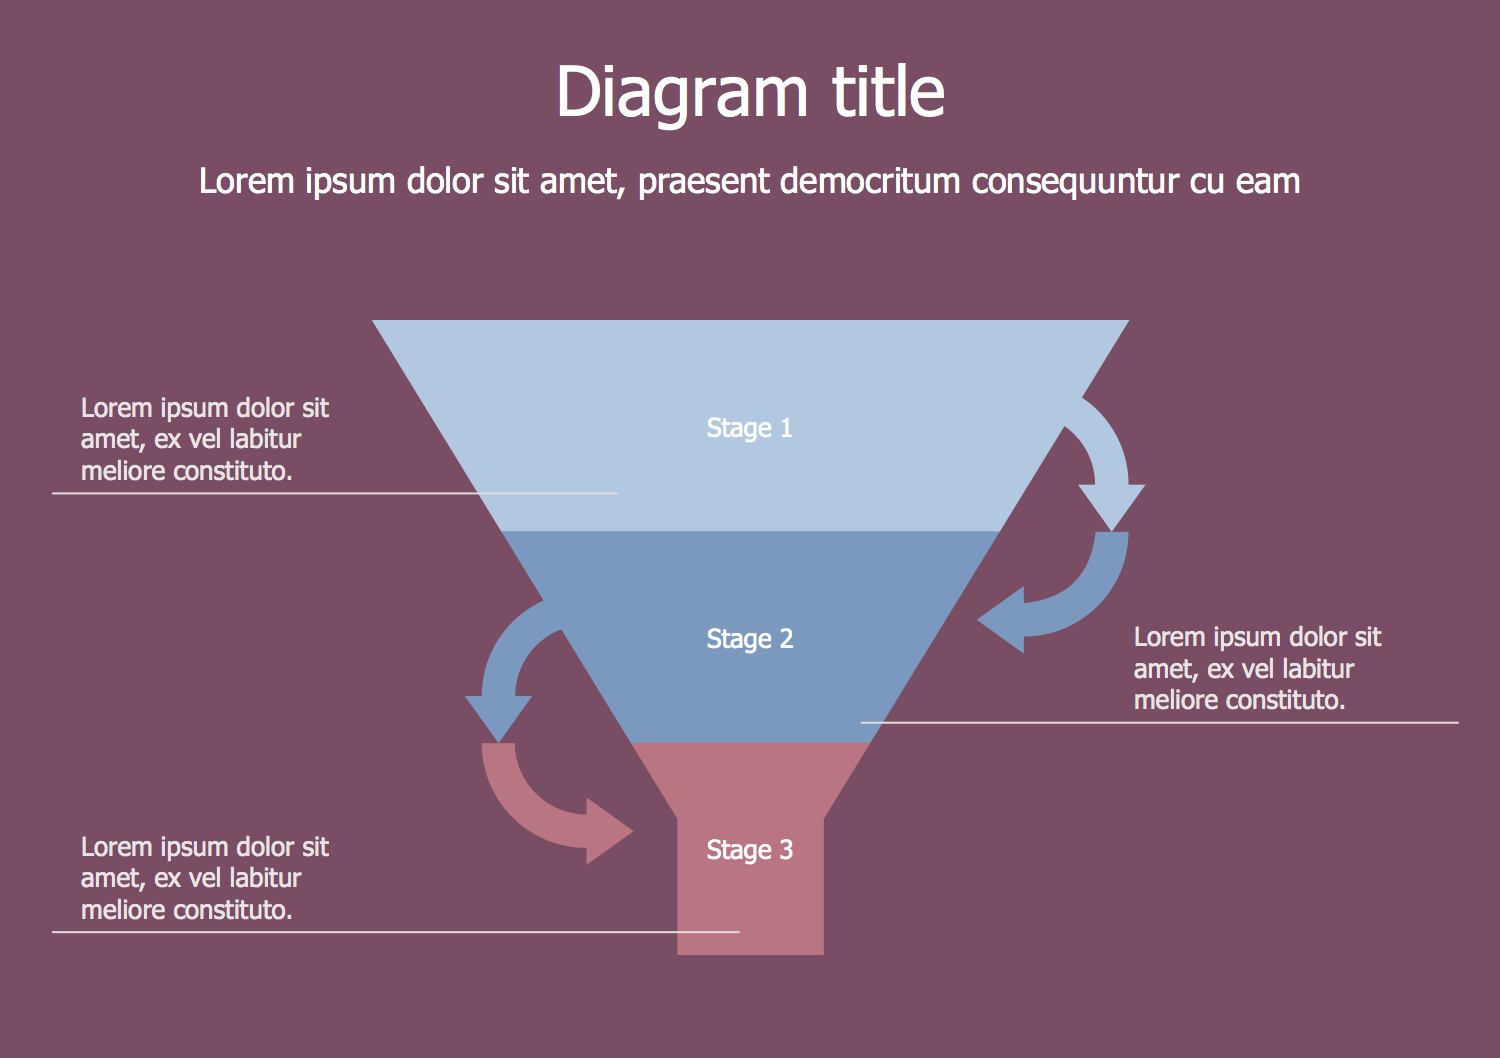
3 Stage Vertical Funnel Template
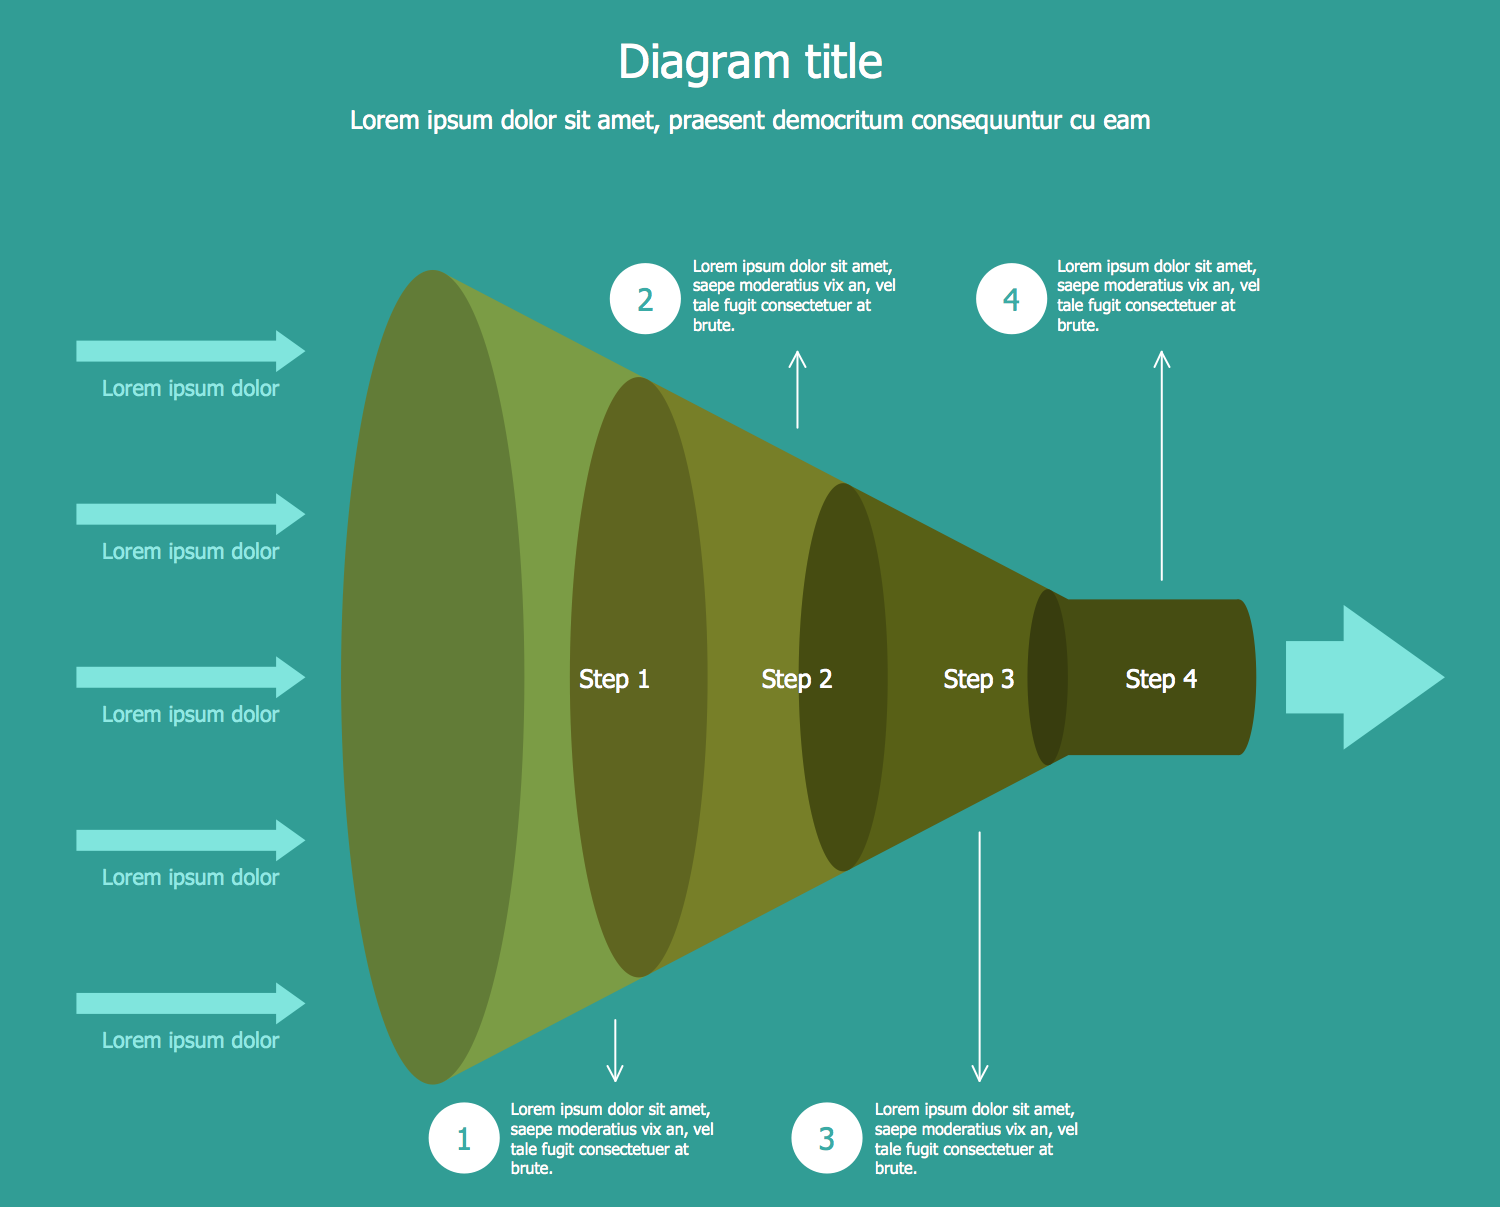
4 Stage 3D Horizontal Funnel Template
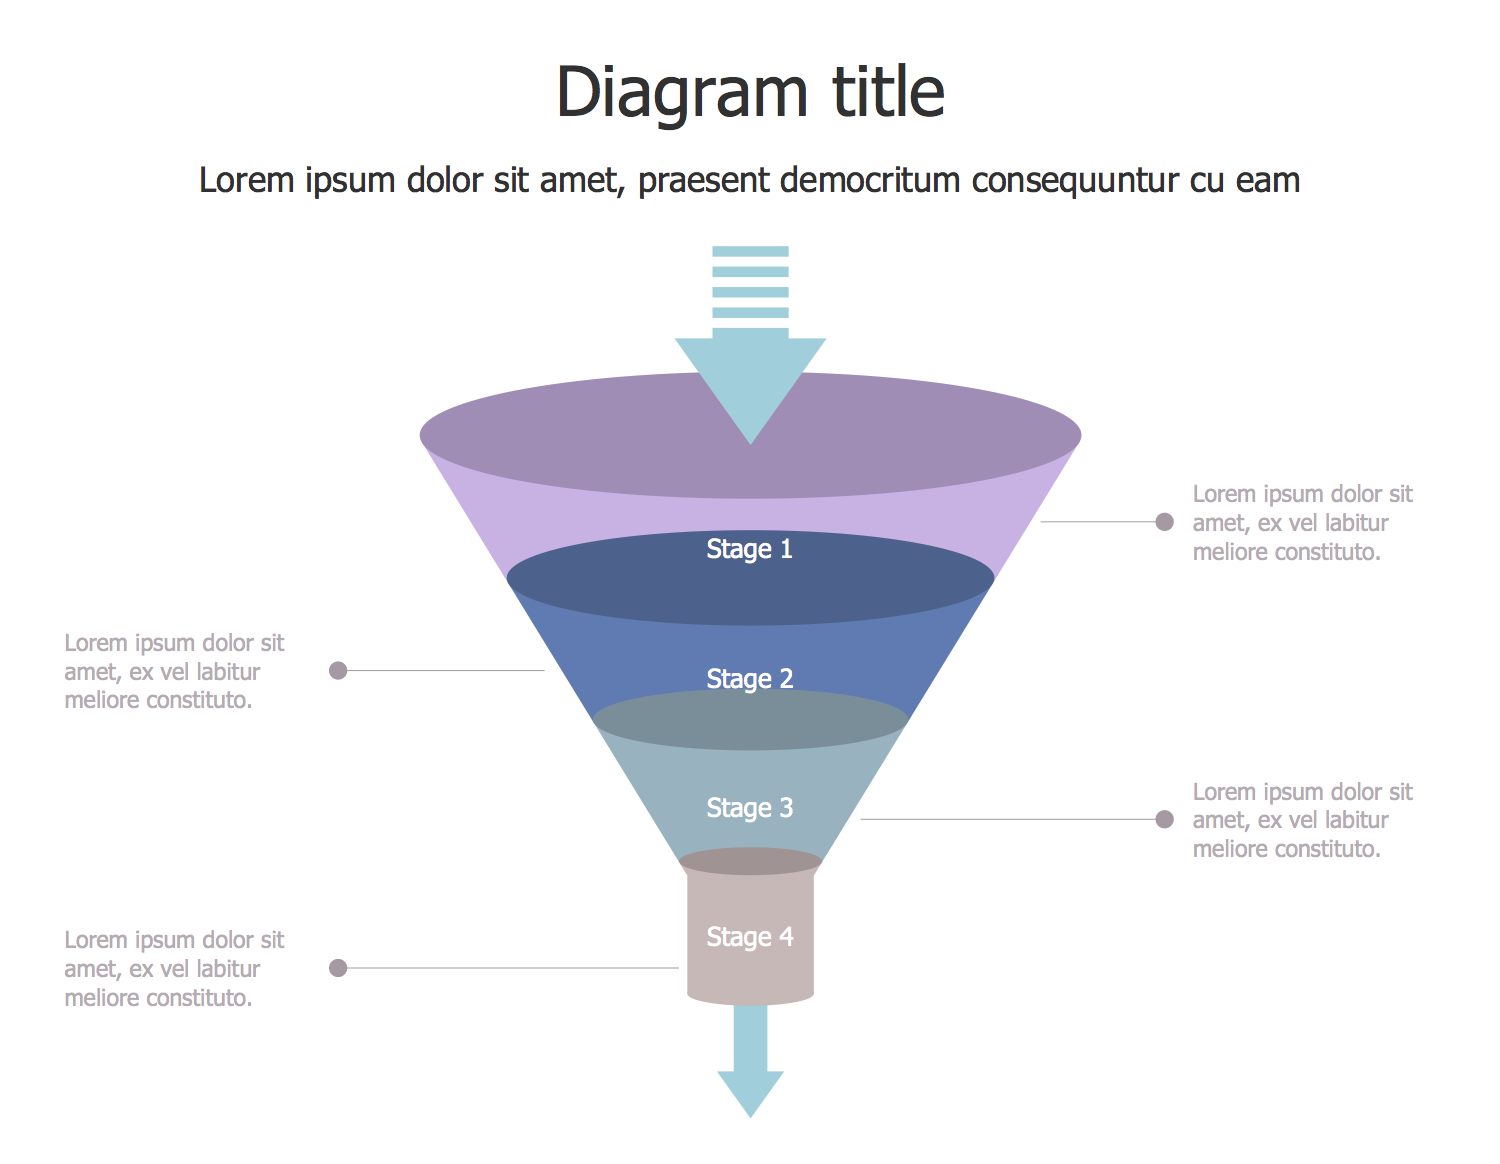
4 Stage 3D Vertical Funnel Template
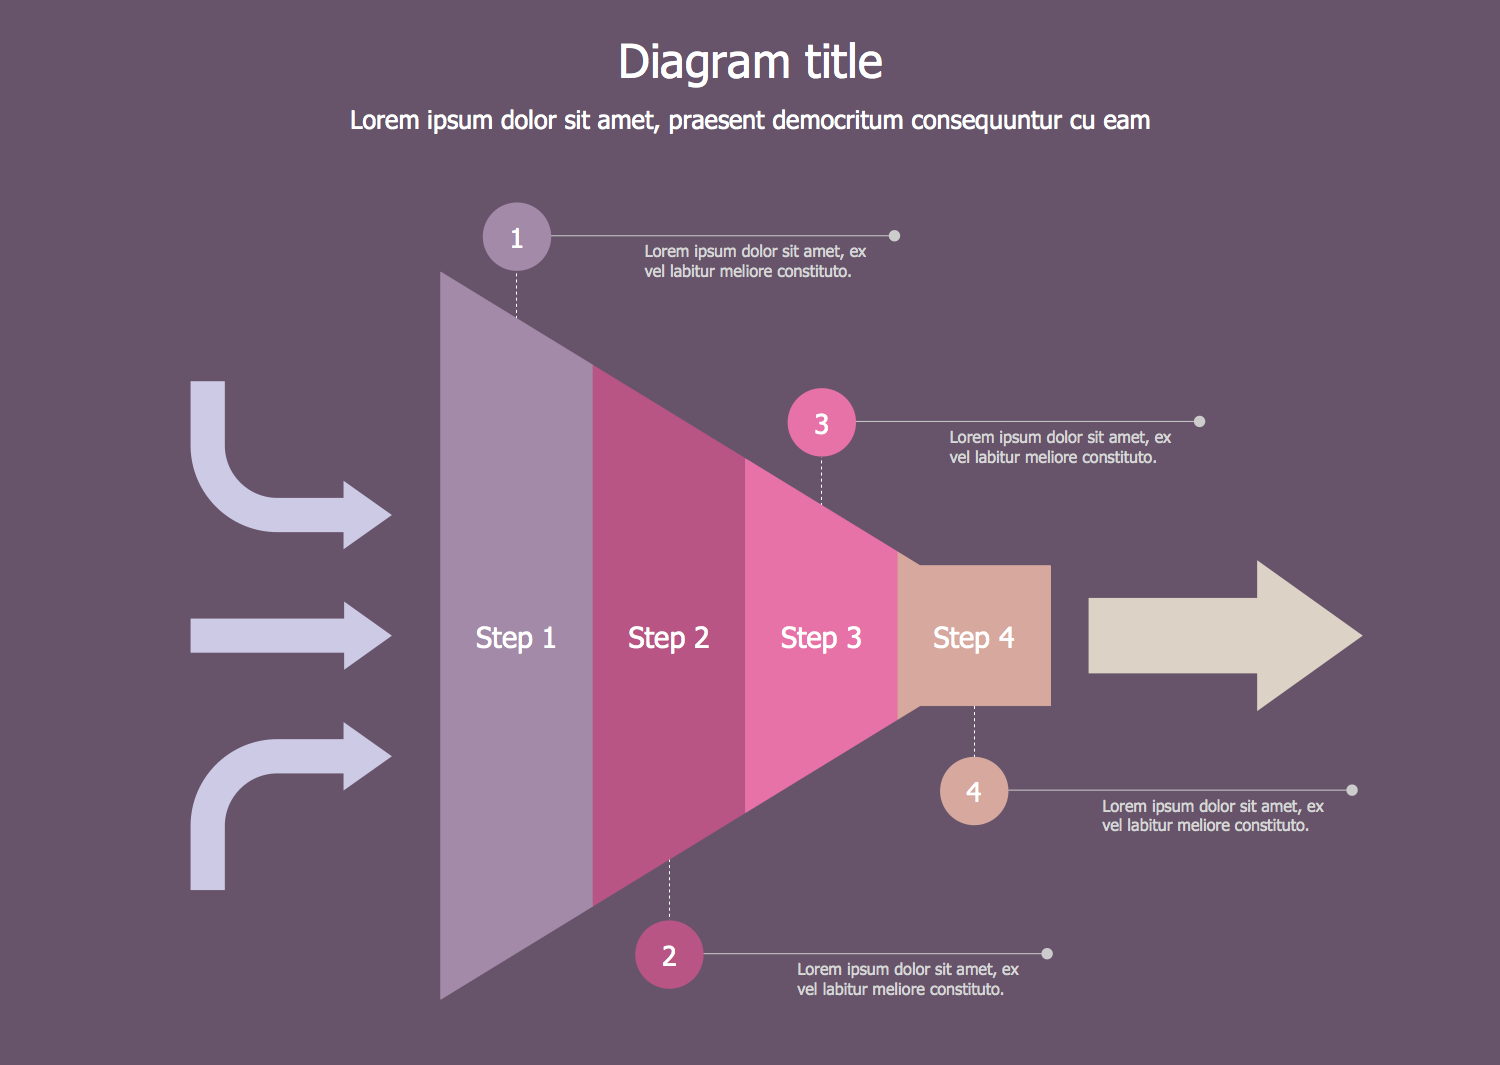
4 Stage Horizontal Funnel Template
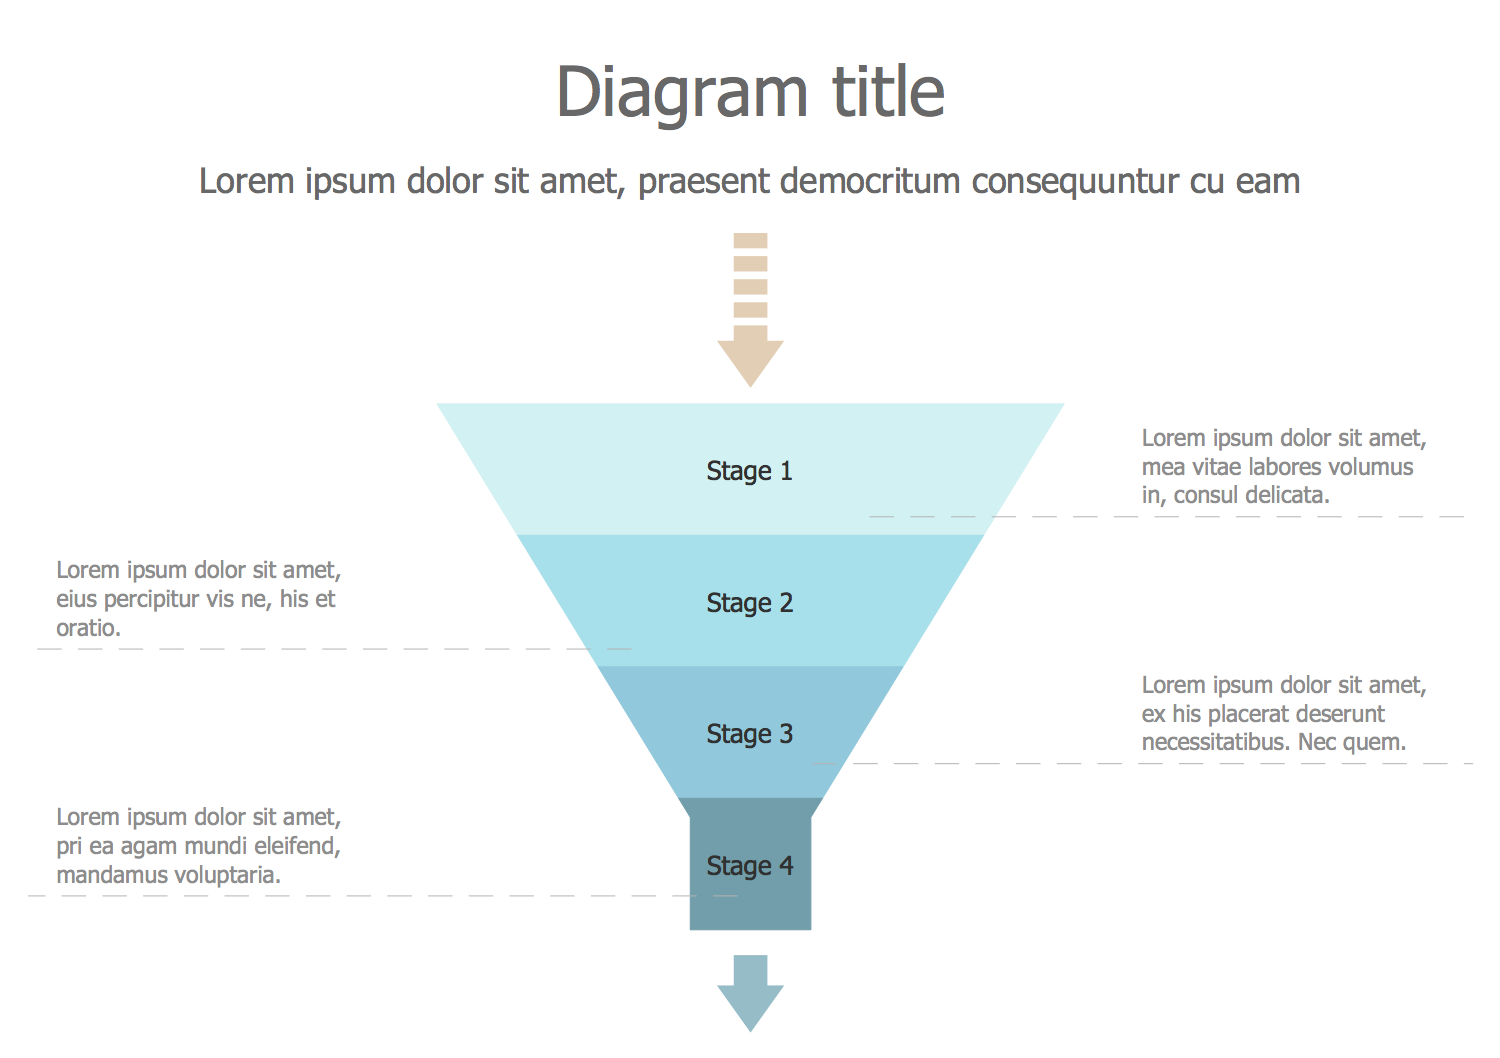
4 Stage 3D Vertical Funnel Template
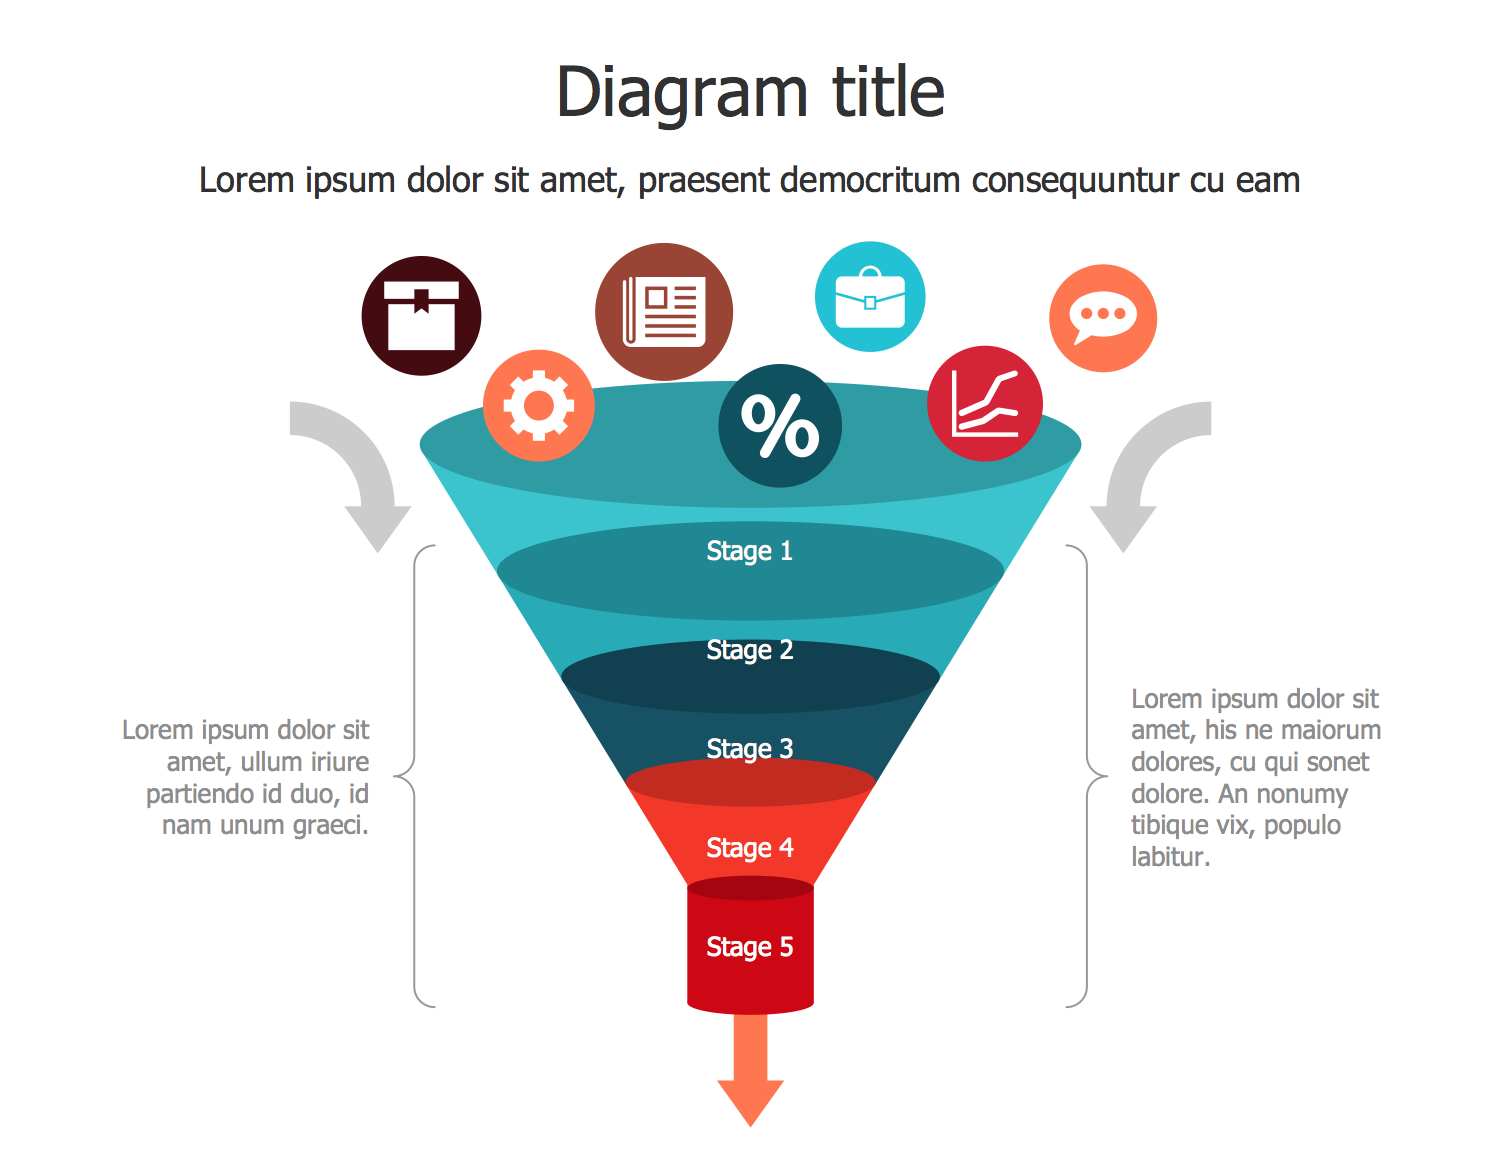
5 Stage 3D Horizontal Funnel Template
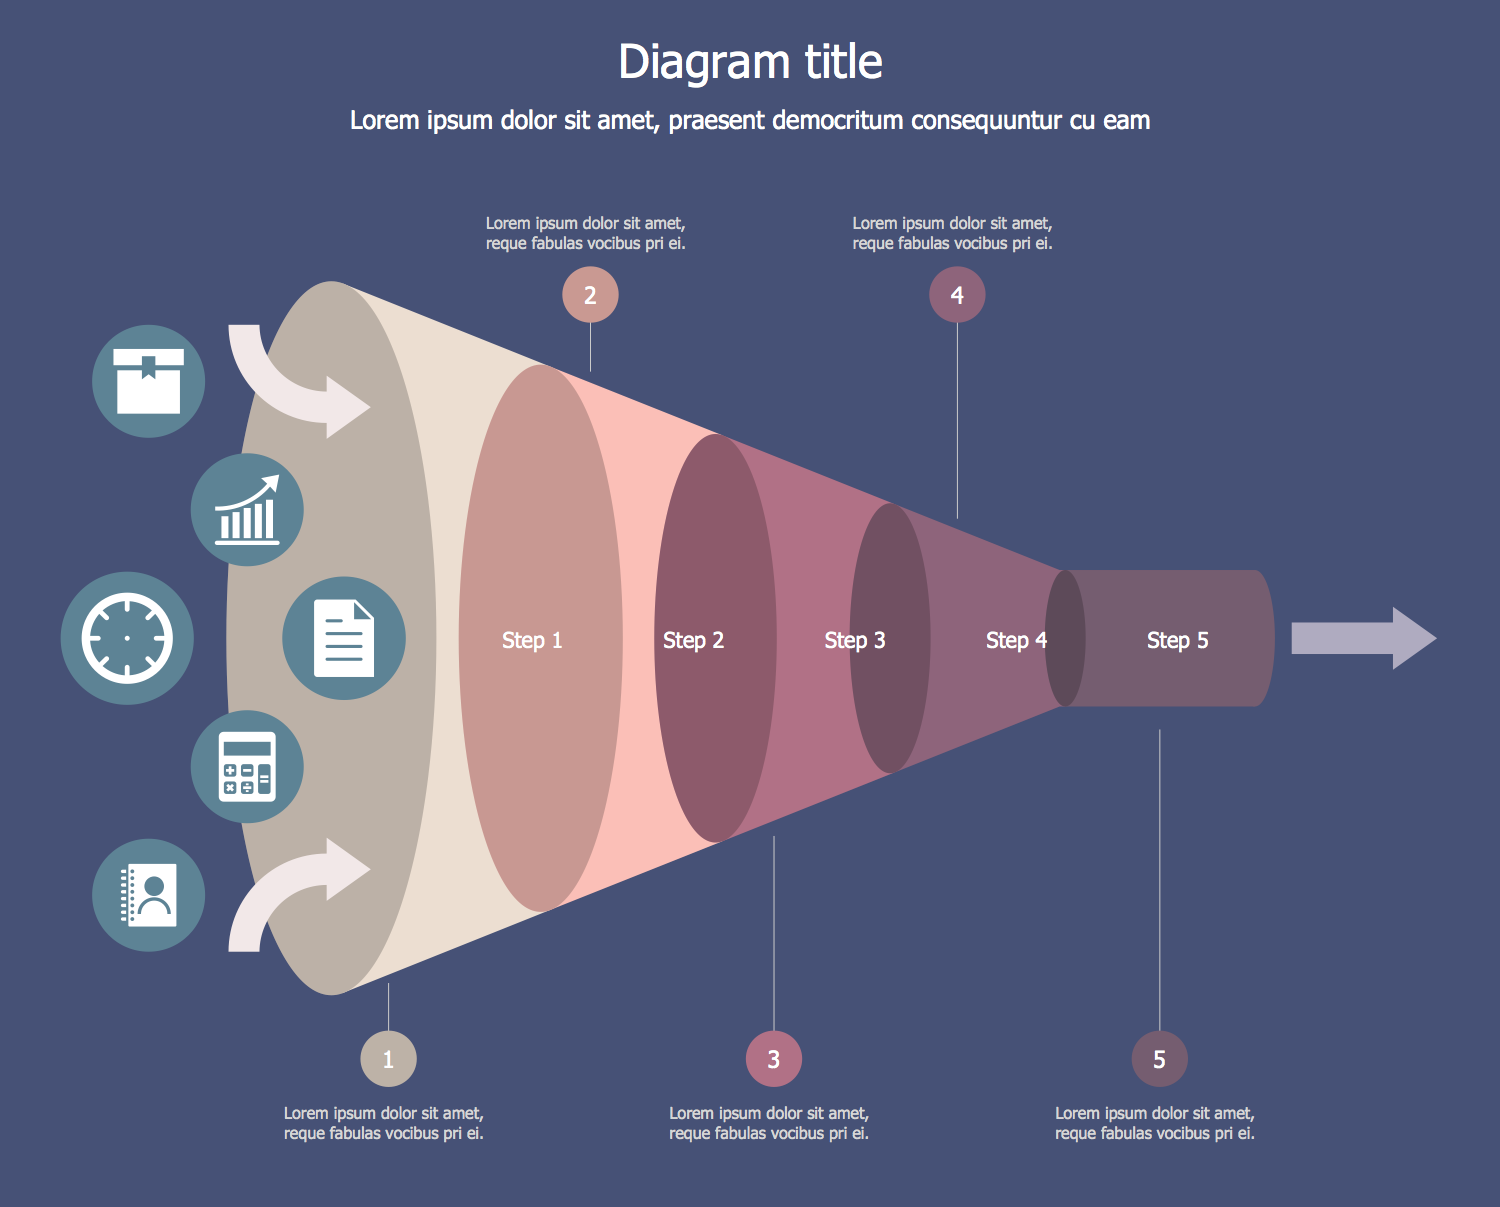
5 Stage 3D Vertical Funnel Template
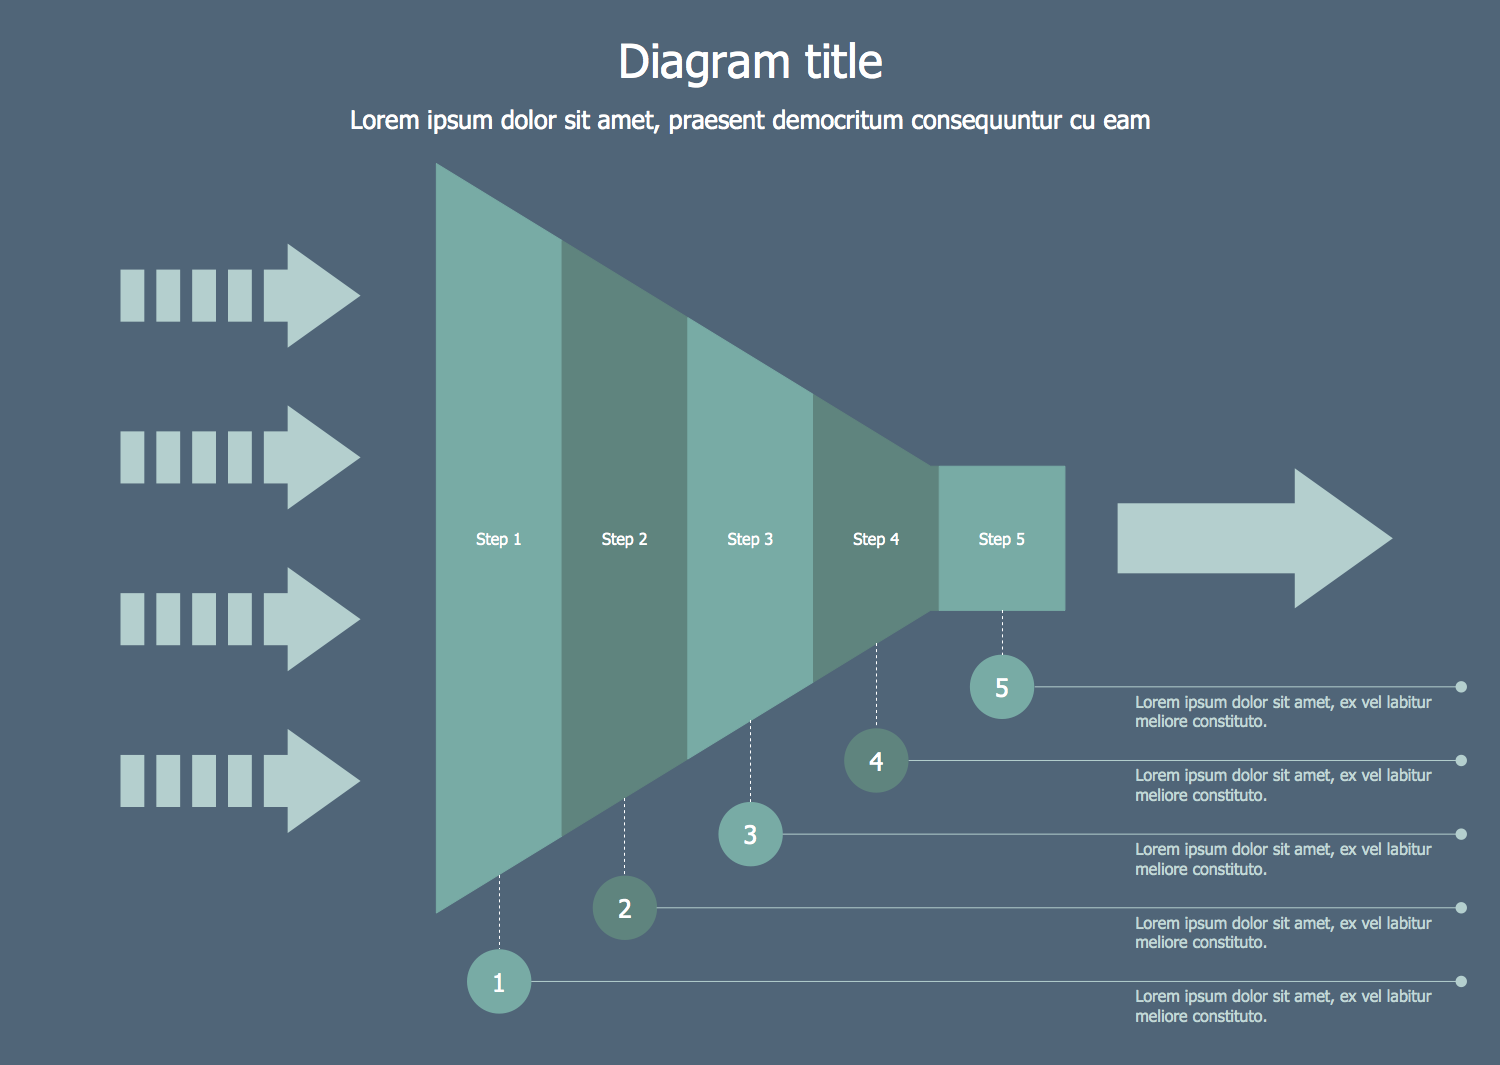
5 Stage Horizontal Funnel Template
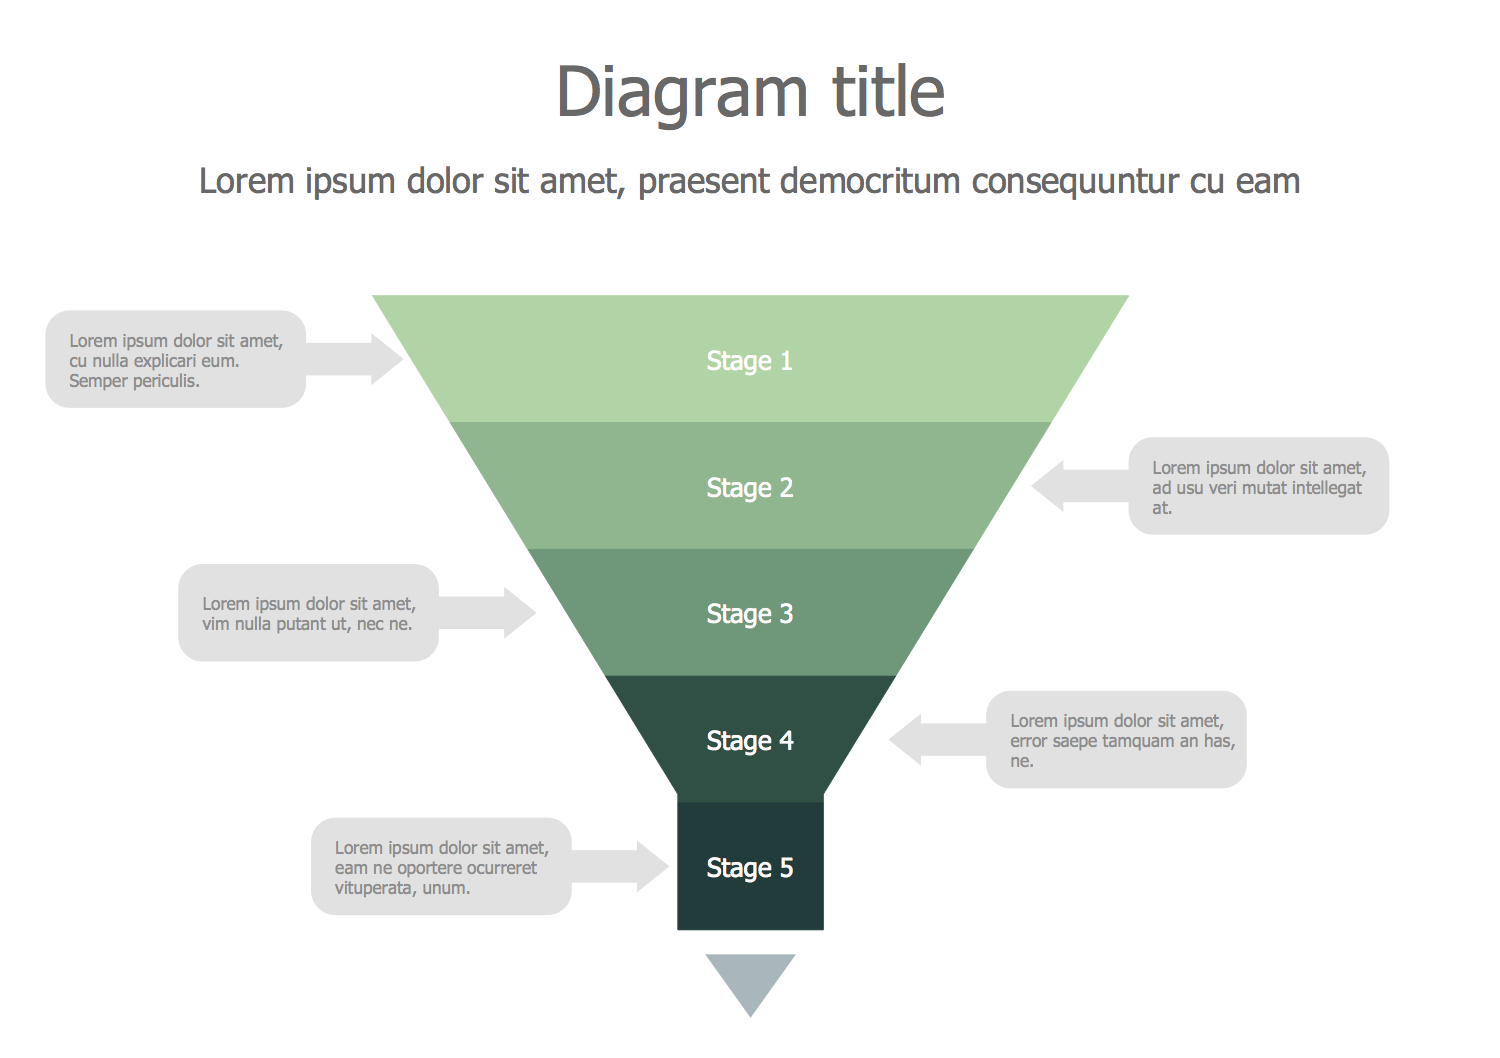
5 Stage Vertical Funnel Template
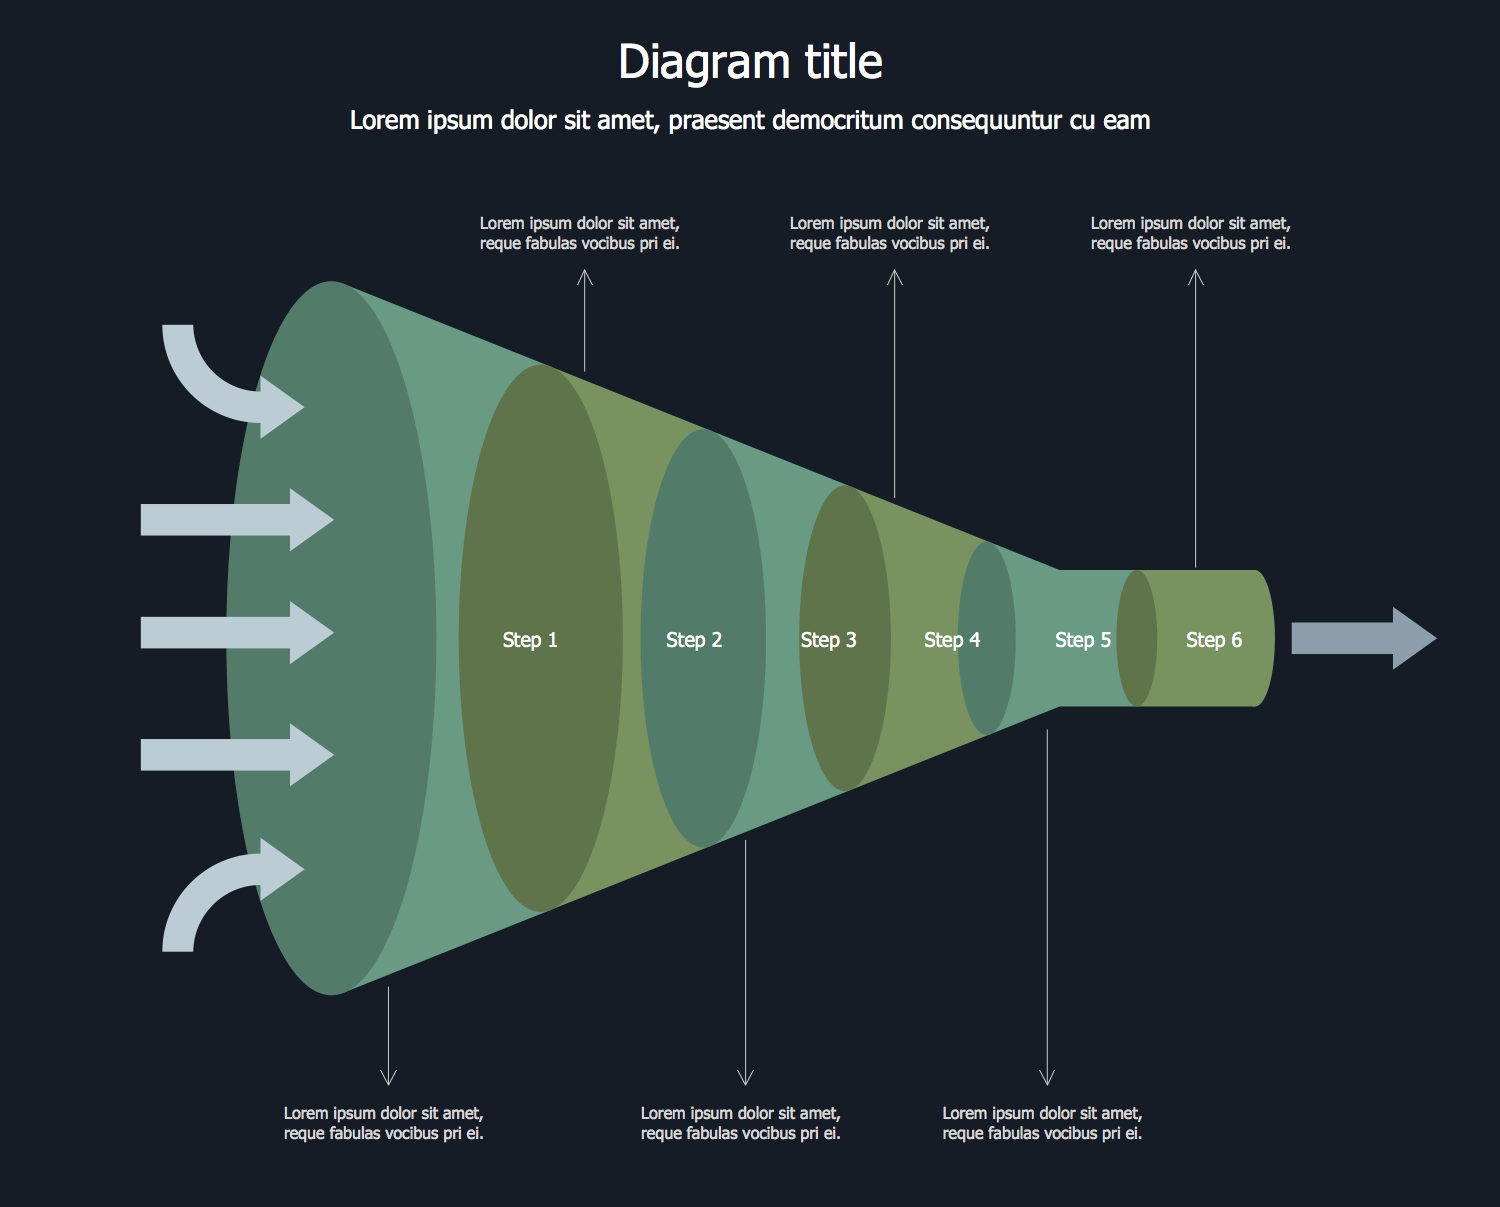
6 Stage 3D Horizontal Funnel Template
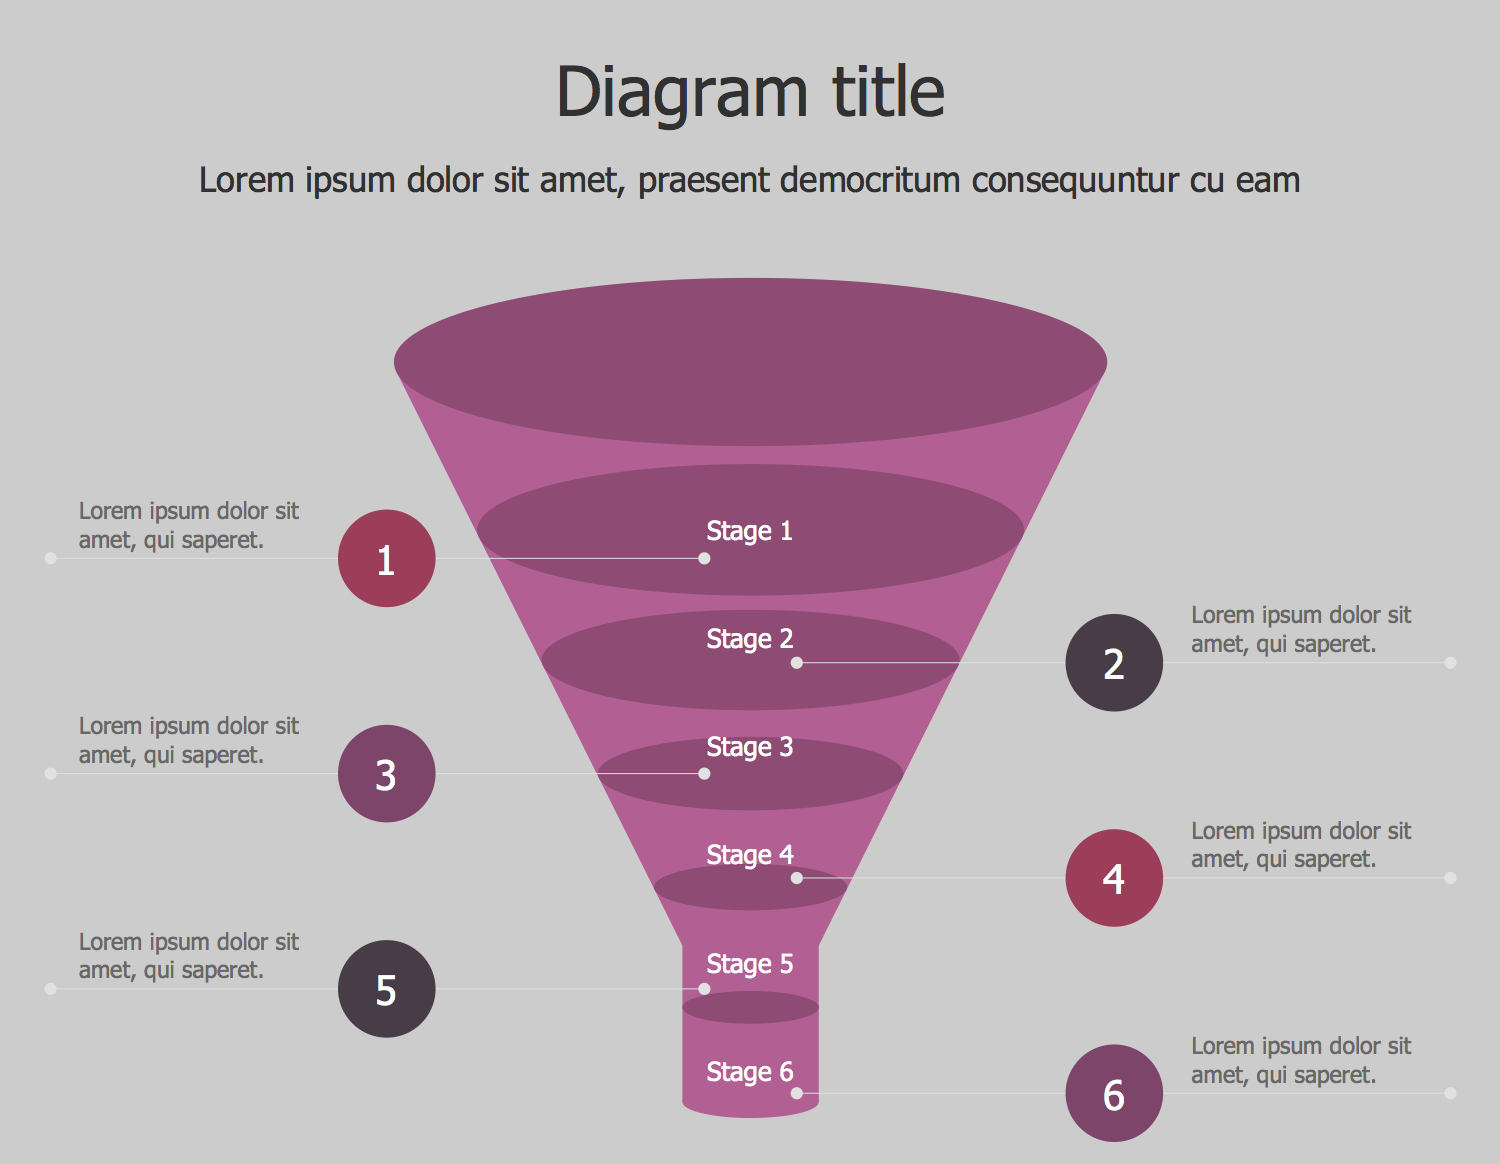
6 Stage 3D Vertical Funnel Template
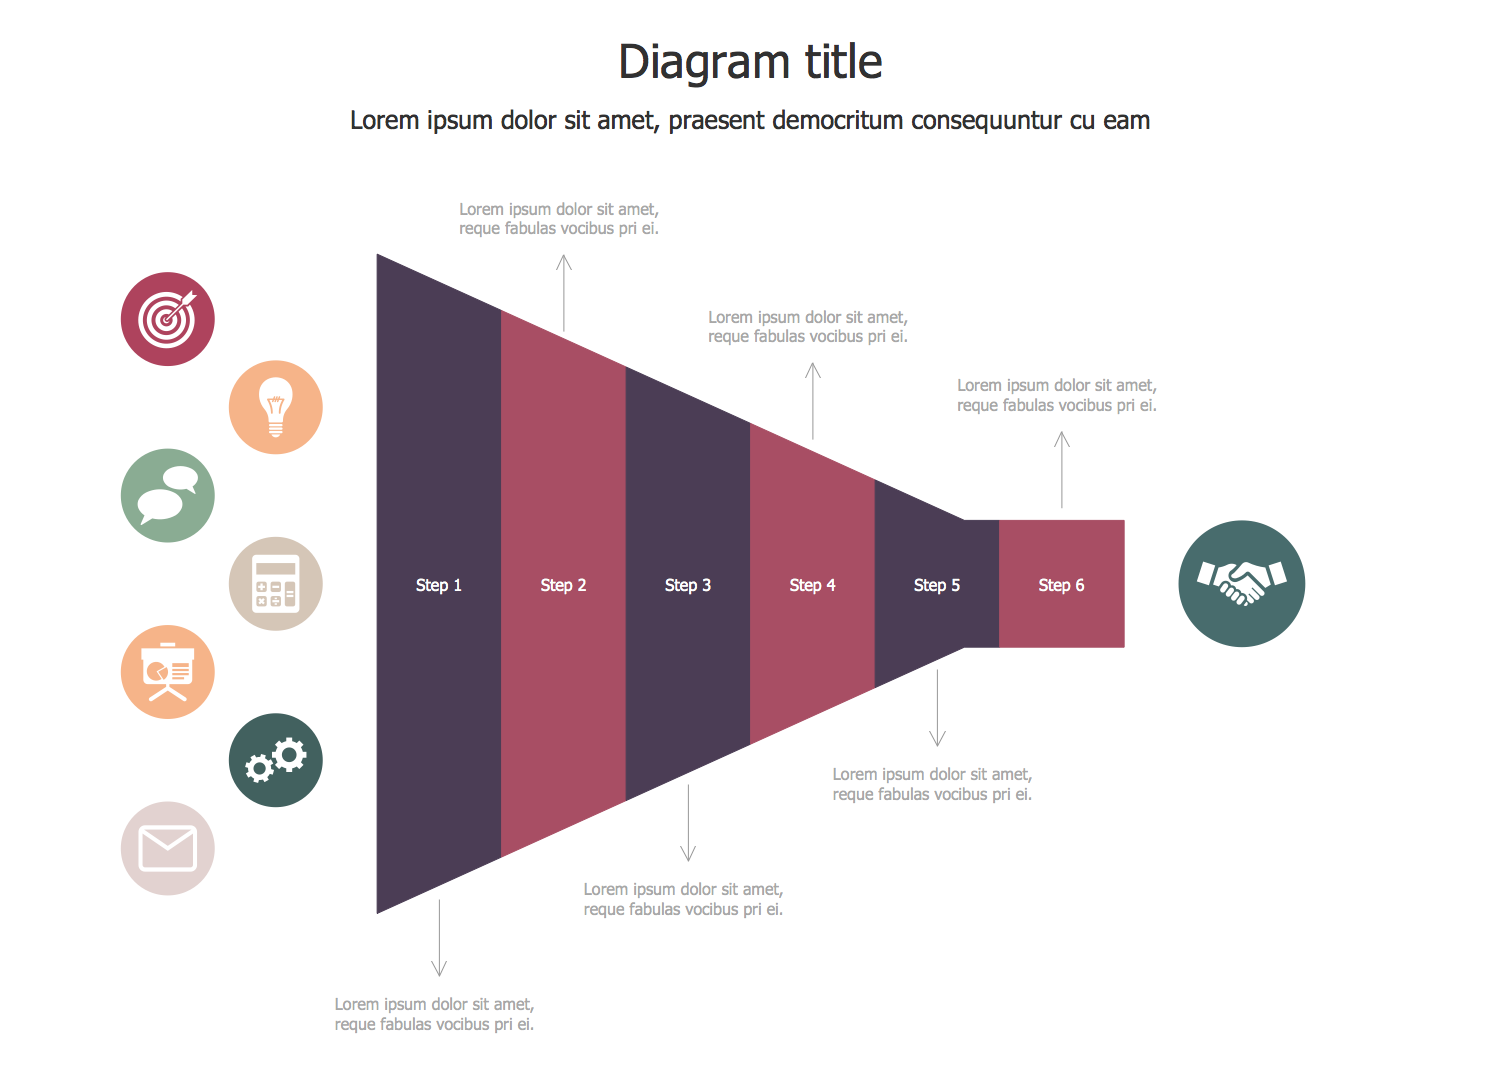
6 Stage Horizontal Funnel Template
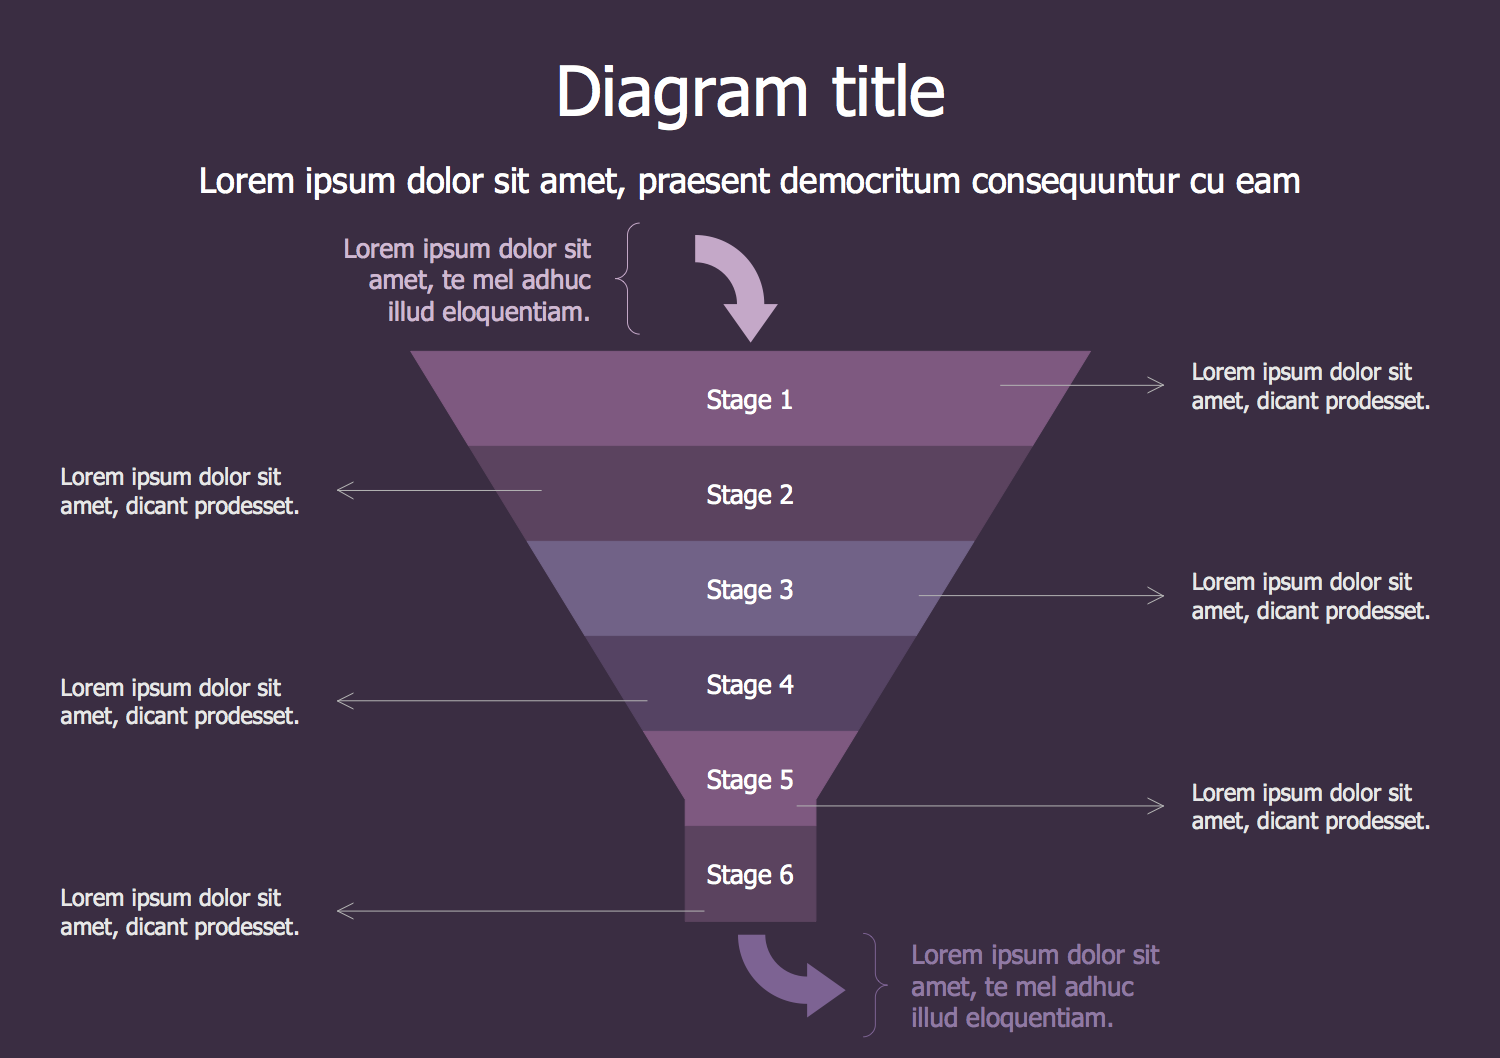
6 Stage Vertical Funnel Template
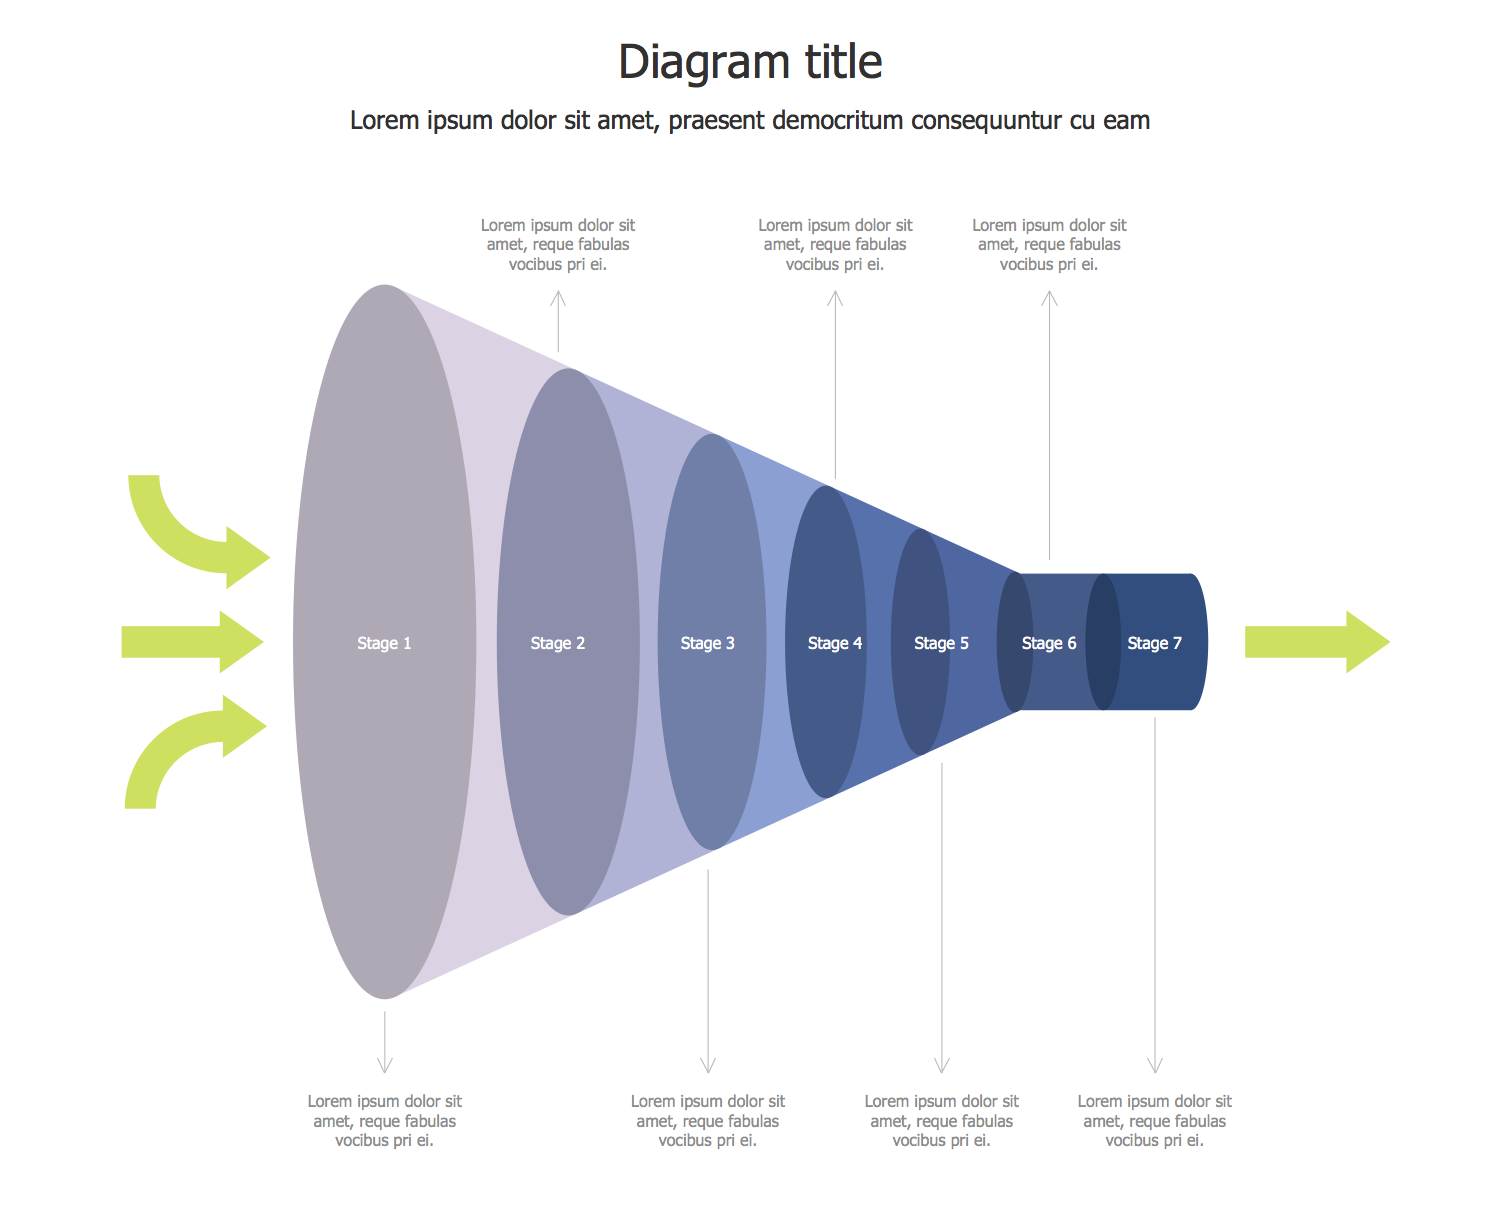
7 Stage 3D Horizontal Funnel Template
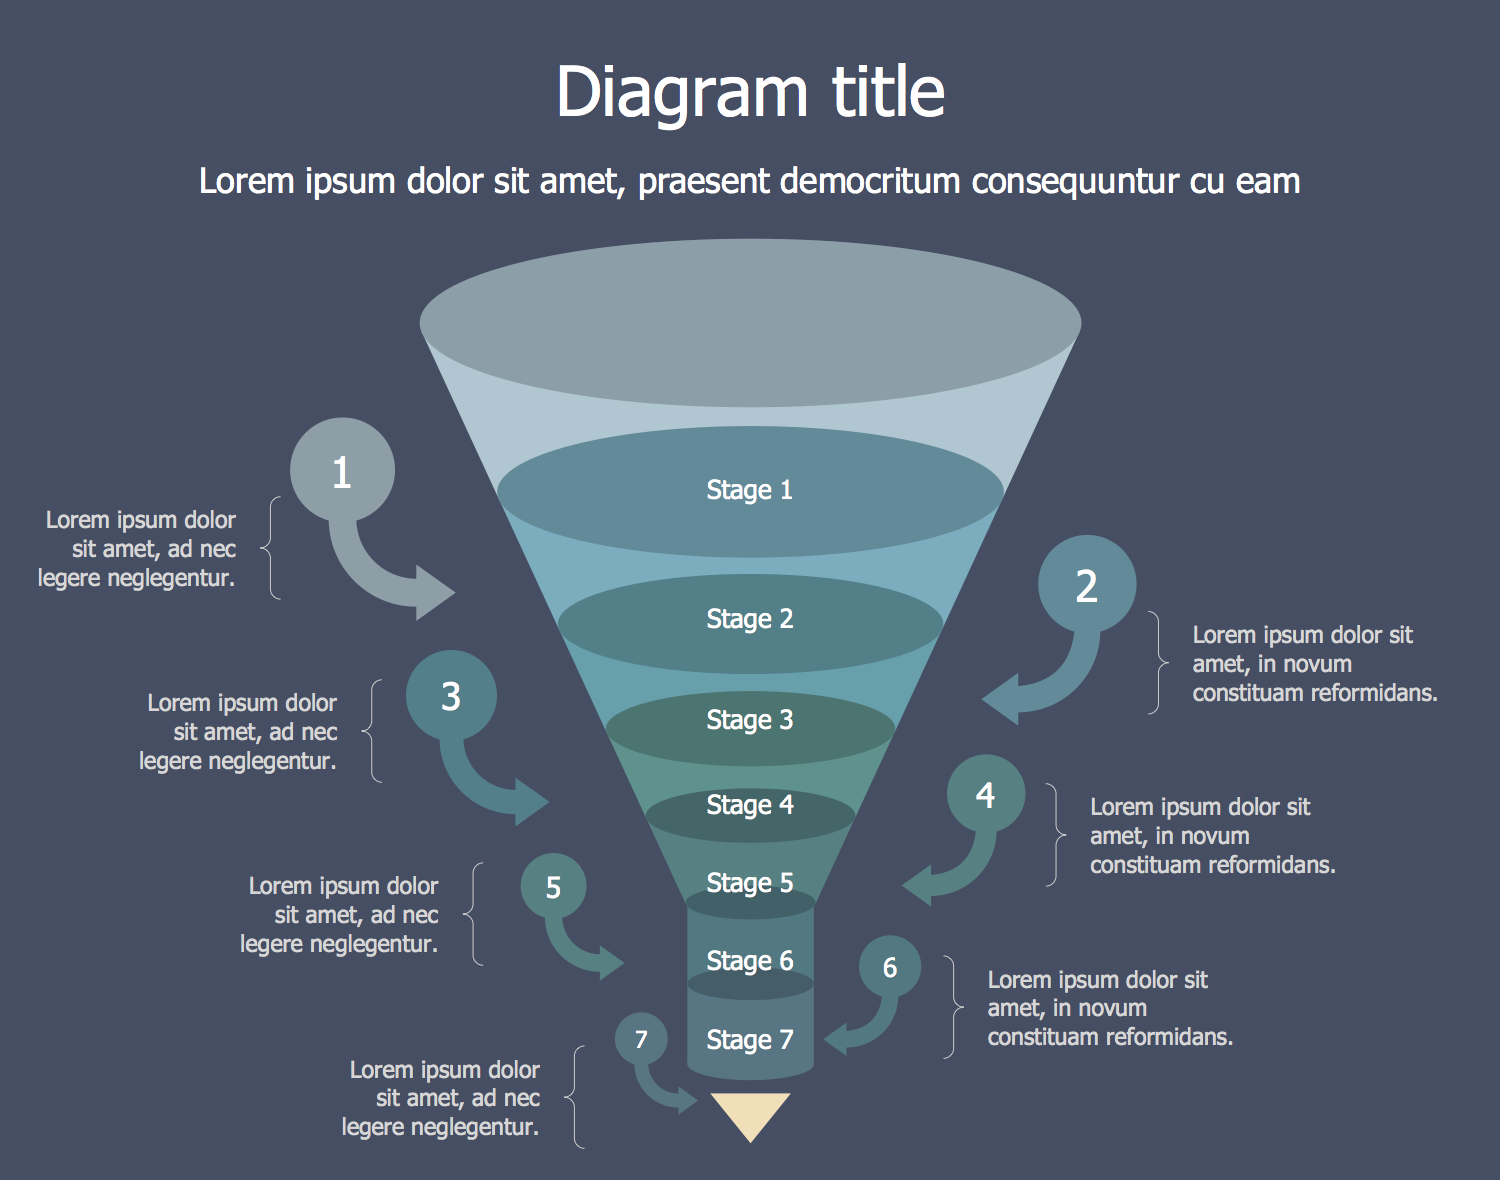
7 Stage 3D Vertical Funnel Template
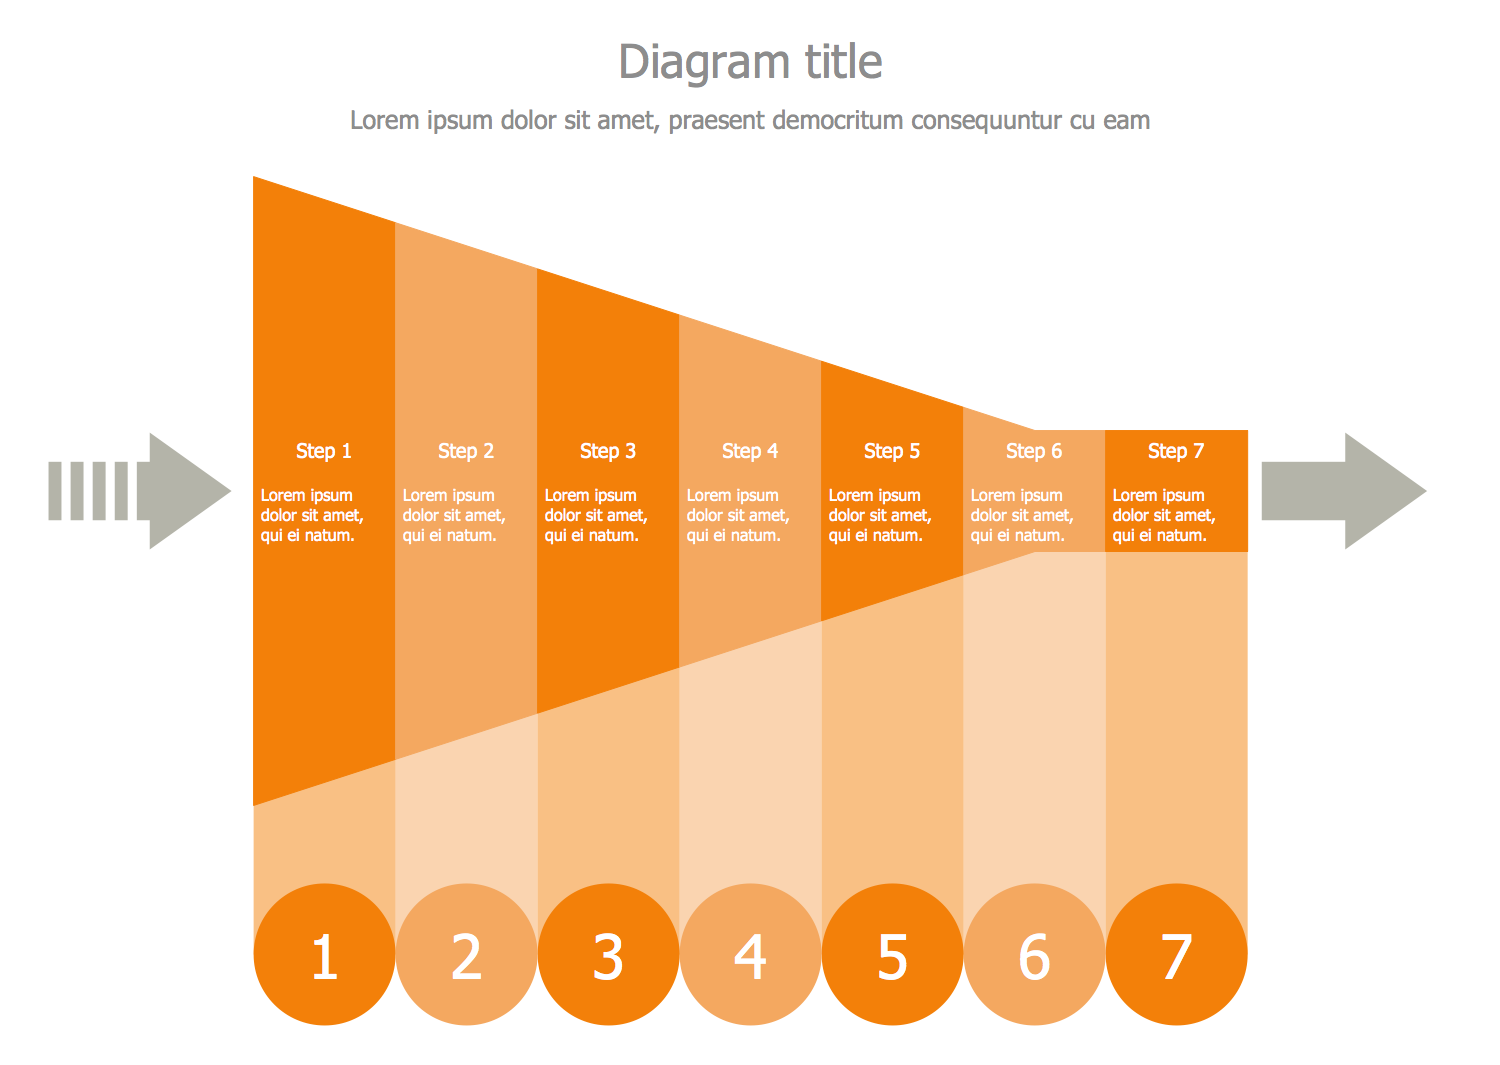
7 Stage Horizontal Funnel Template
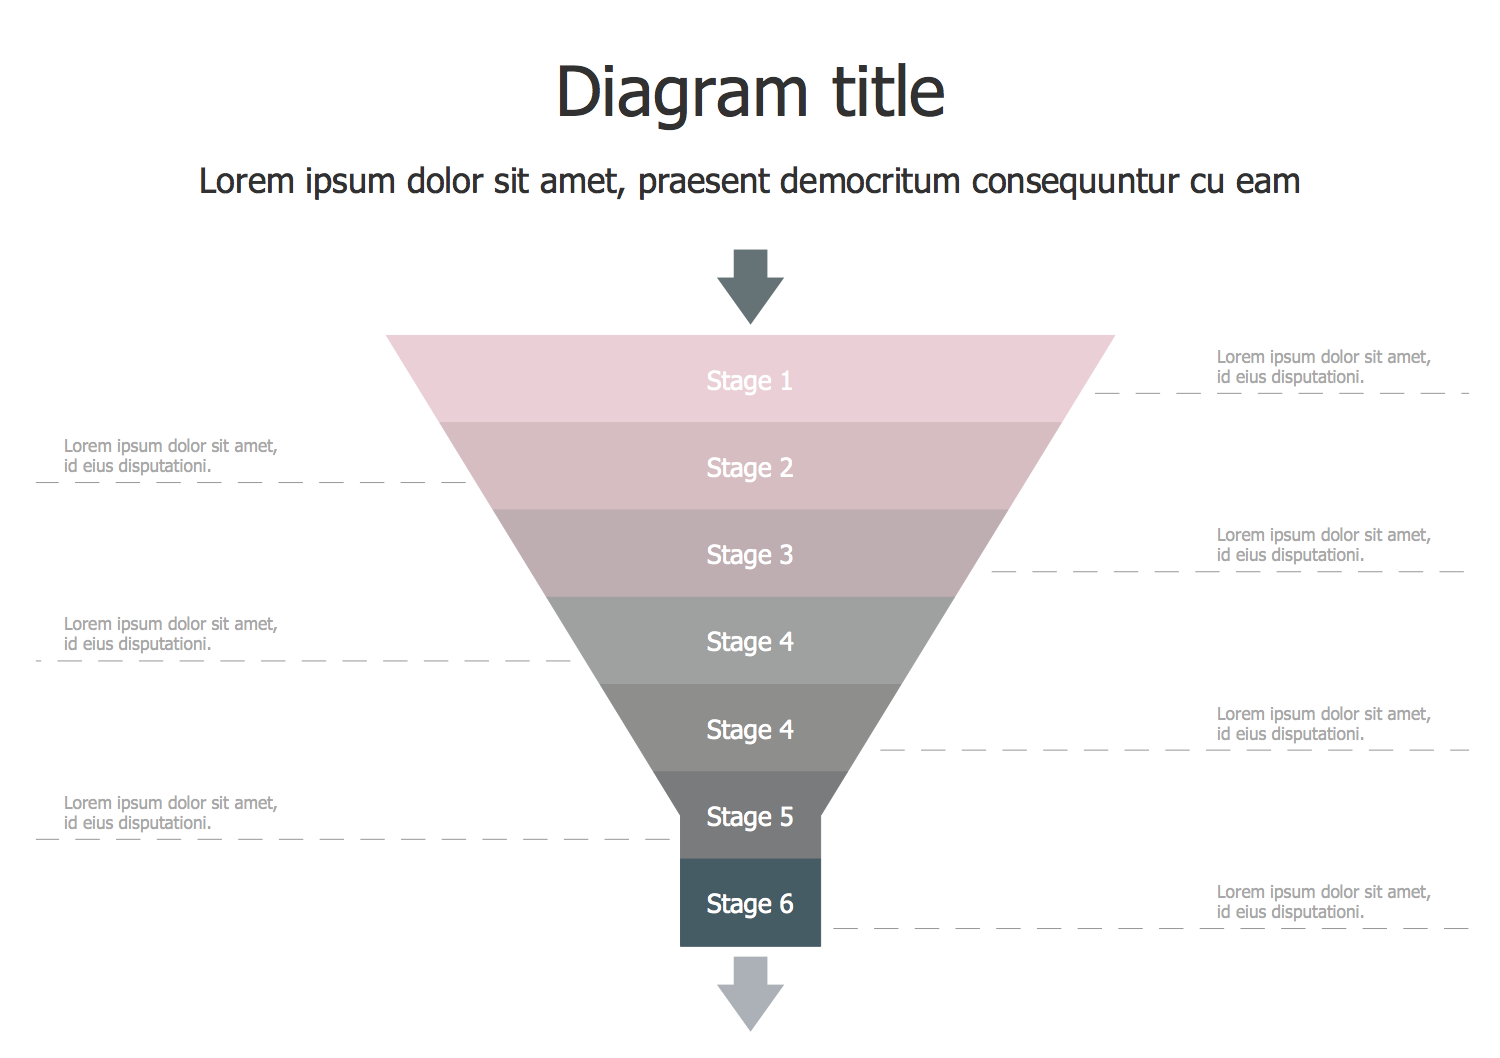
7 Stage Vertical Funnel Template
Inside
What I Need to Get Started
After ConceptDraw DIAGRAM is installed, the Funnel Diagrams solution can be purchased either from the Marketing area of ConceptDraw STORE itself or from our online store. Thus, you will be able to use the Funnel Diagrams solution straight after.
How to install
First of all, make sure that both ConceptDraw STORE and ConceptDraw DIAGRAM applications are downloaded and installed on your computer. Next, install the Funnel Diagrams solution from the ConceptDraw STORE to use it in the ConceptDraw DIAGRAM application.
Start Using
Start using the Funnel Diagrams solution to make the professionally looking marketing and sales communication diagrams by adding the design elements taken from the stencil libraries and editing the pre-made examples that can be found there.
Funnel Diagrams
Considering creating a funnel diagram might mean you need to make a sales funnel, marketing funnel, customer conversion funnel, customer lifecycle funnel (used in customer lifecycle management), purchase funnel, recruiting funnel, lead generation funnel or launch funnel diagram. If there is a need for drawing a funnel diagram, you can make any by using the ConceptDraw DIAGRAM diagramming and vector drawing software extended with the Funnel Diagrams solution. In order to evaluate the success as well as to analyze the sales, to score prospects and leads, such visual representations of business data might be used.
Funnel charts are often used for representing different stages in a sales process or/and showing the amount of potential revenue for each of the stages. Funnel diagrams may also be very useful for identifying the potential problem areas in an organization's sales processes.
Any funnel chart is known to be displaying different values as progressively decreasing proportions amounting to 100% in total, but there are always some exceptions. The size of the area of such chart may be determined by the series value as a percentage of the total of all values. Any funnel chart consists of the higher part which is known to be called either a "head" or a "base" and the lower part which may be referred to as "neck".
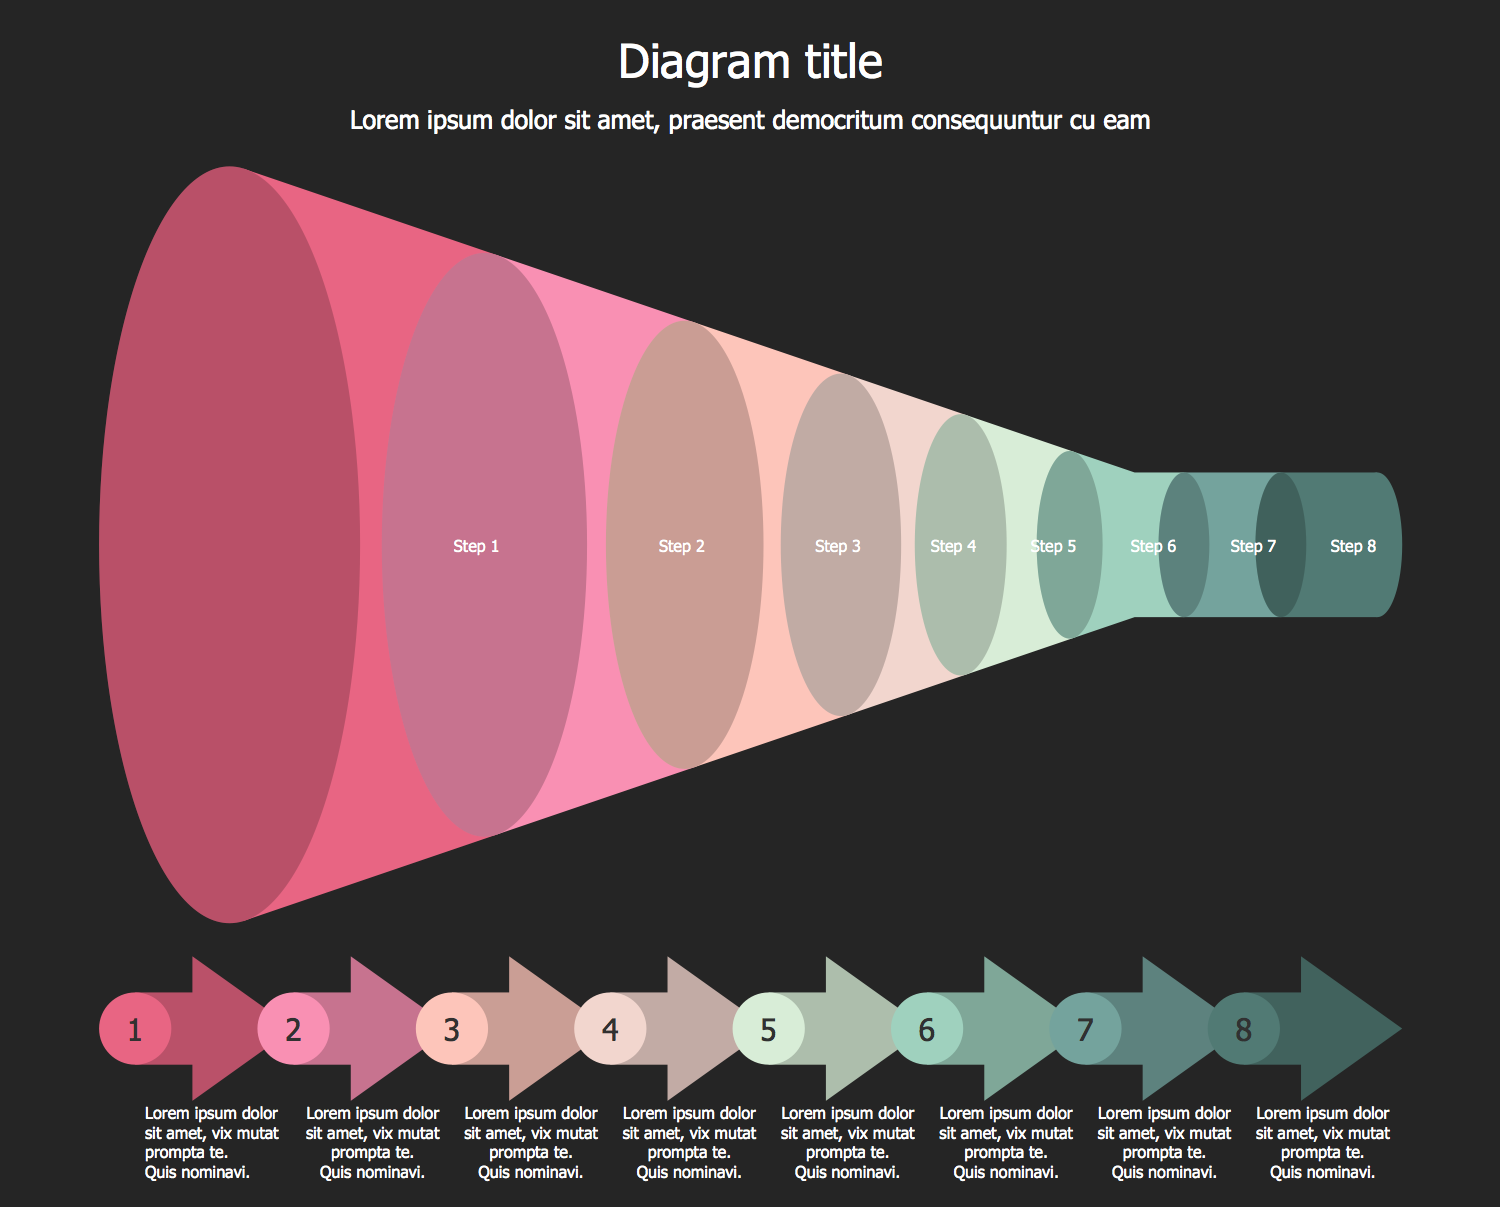
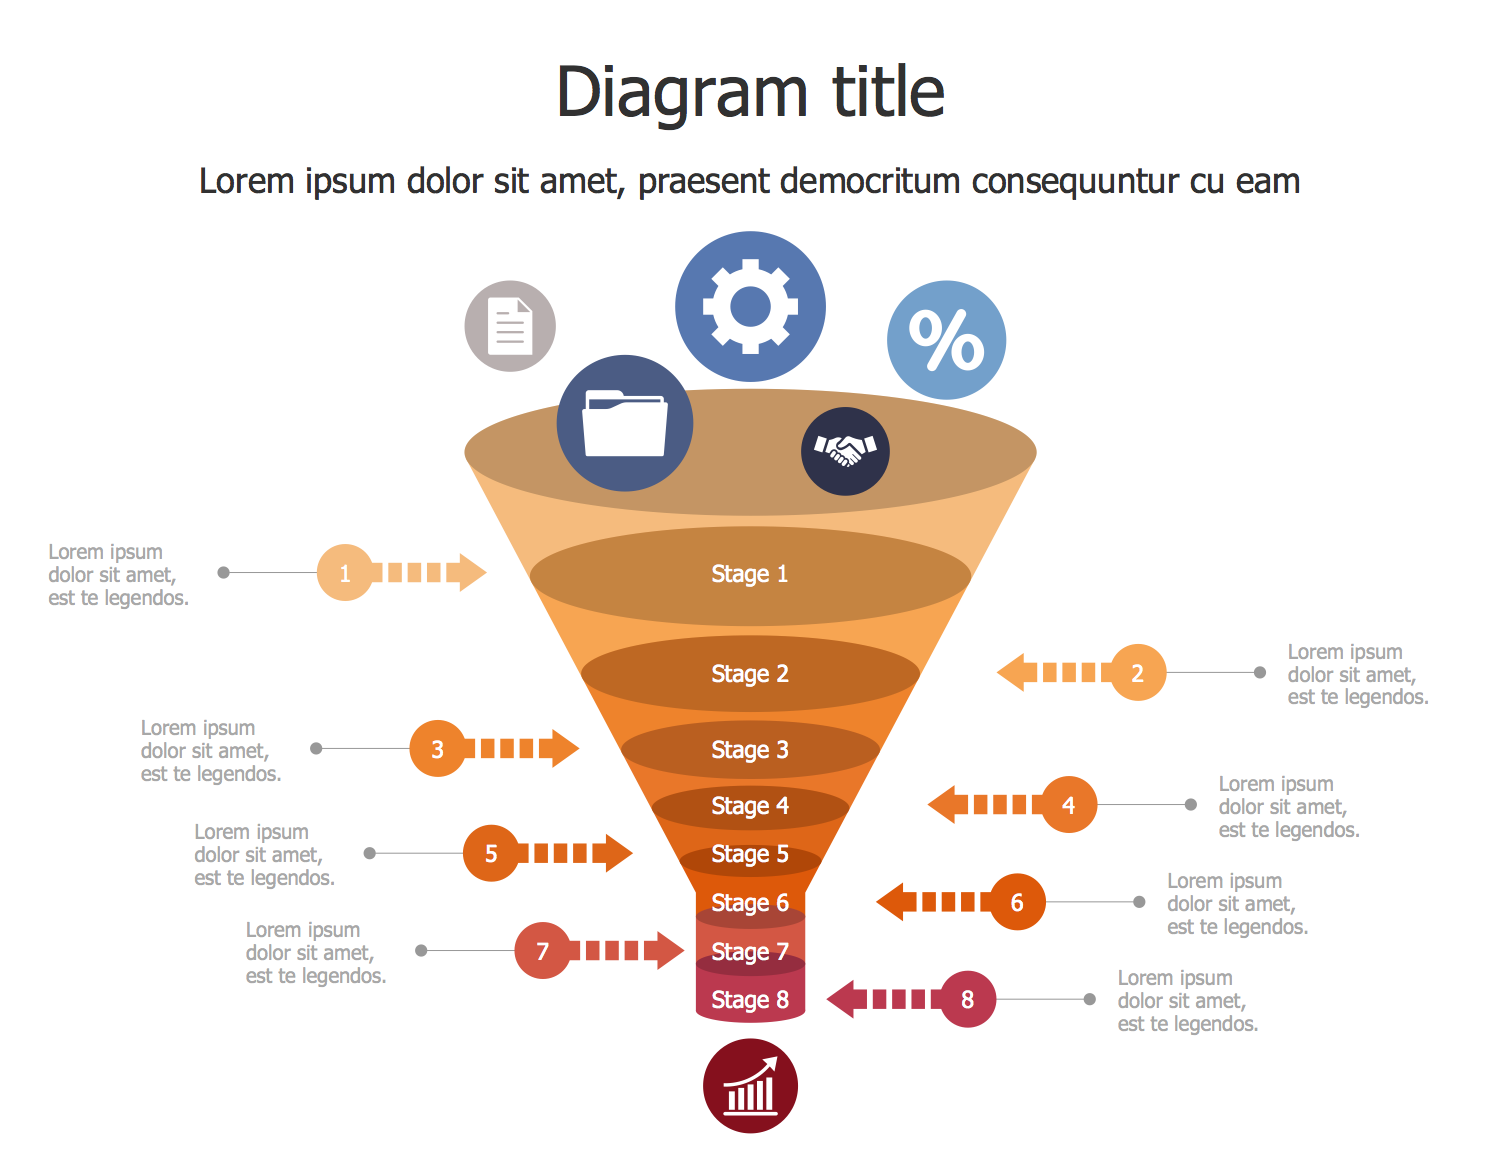
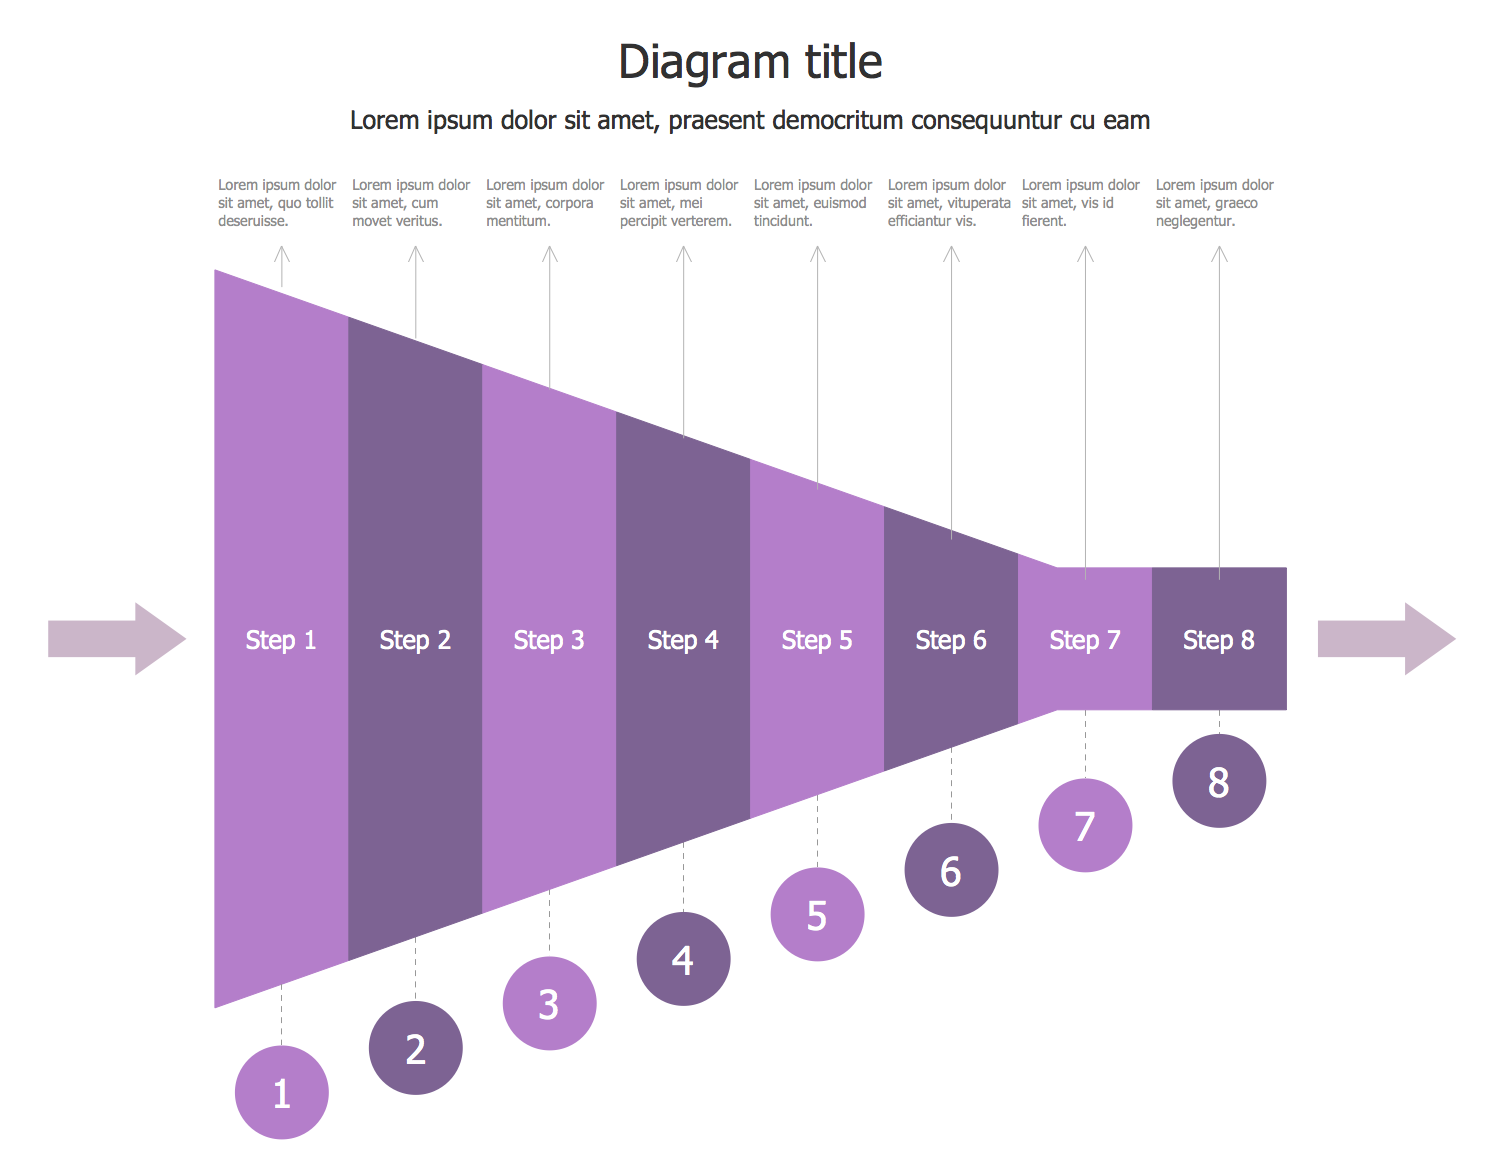
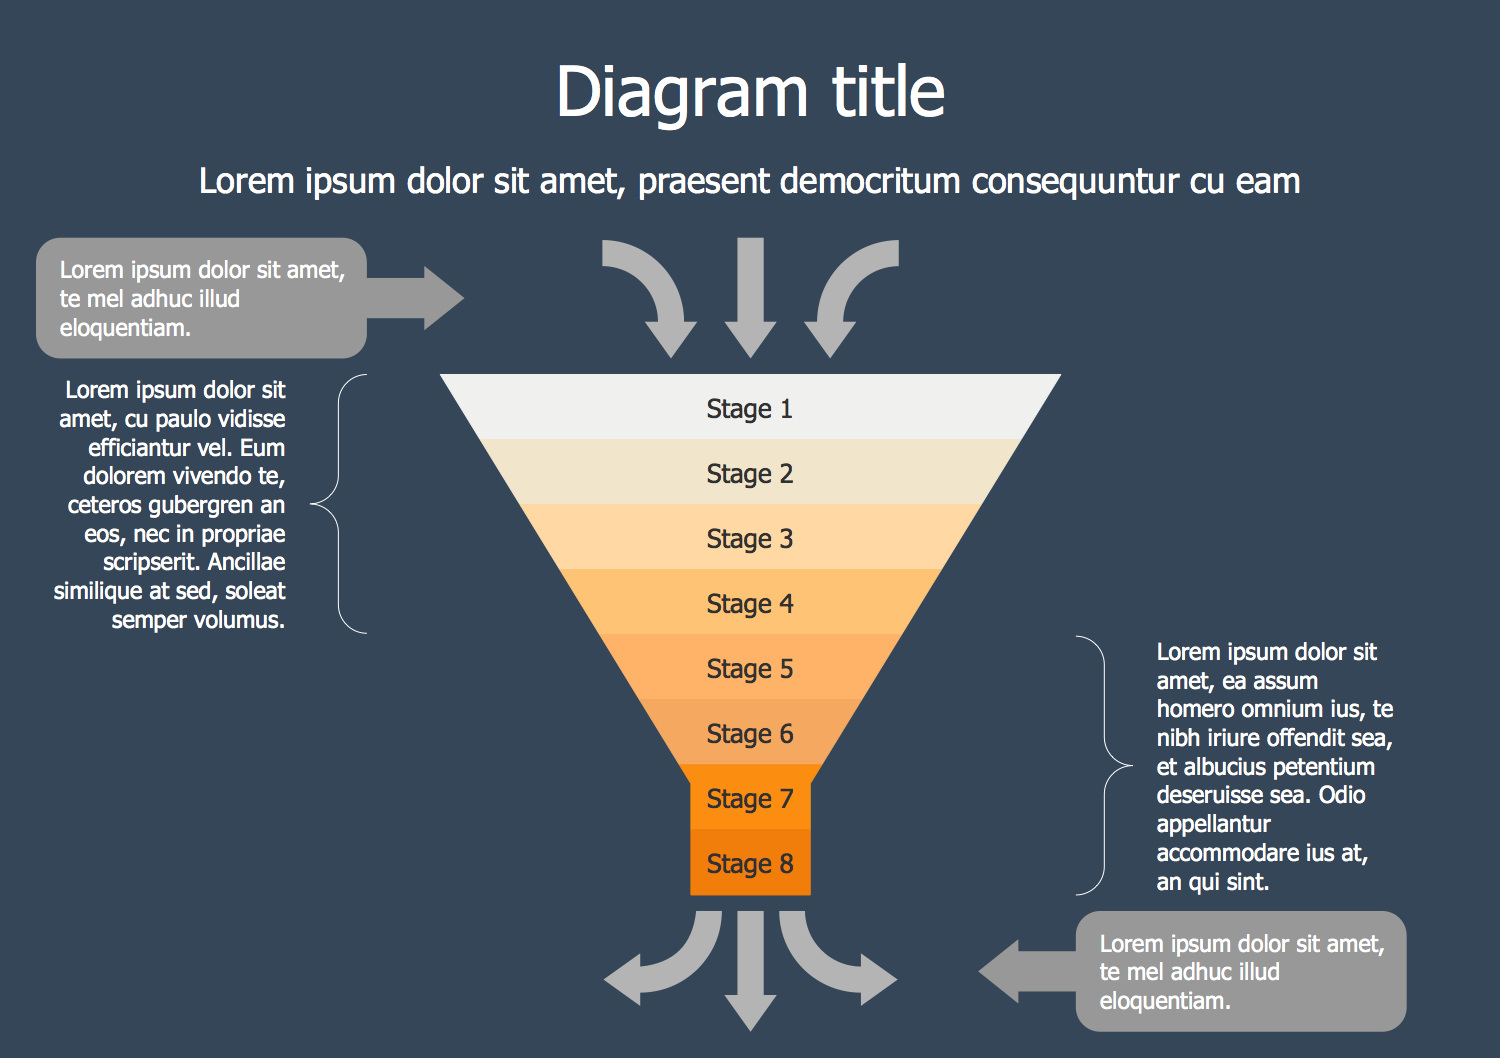
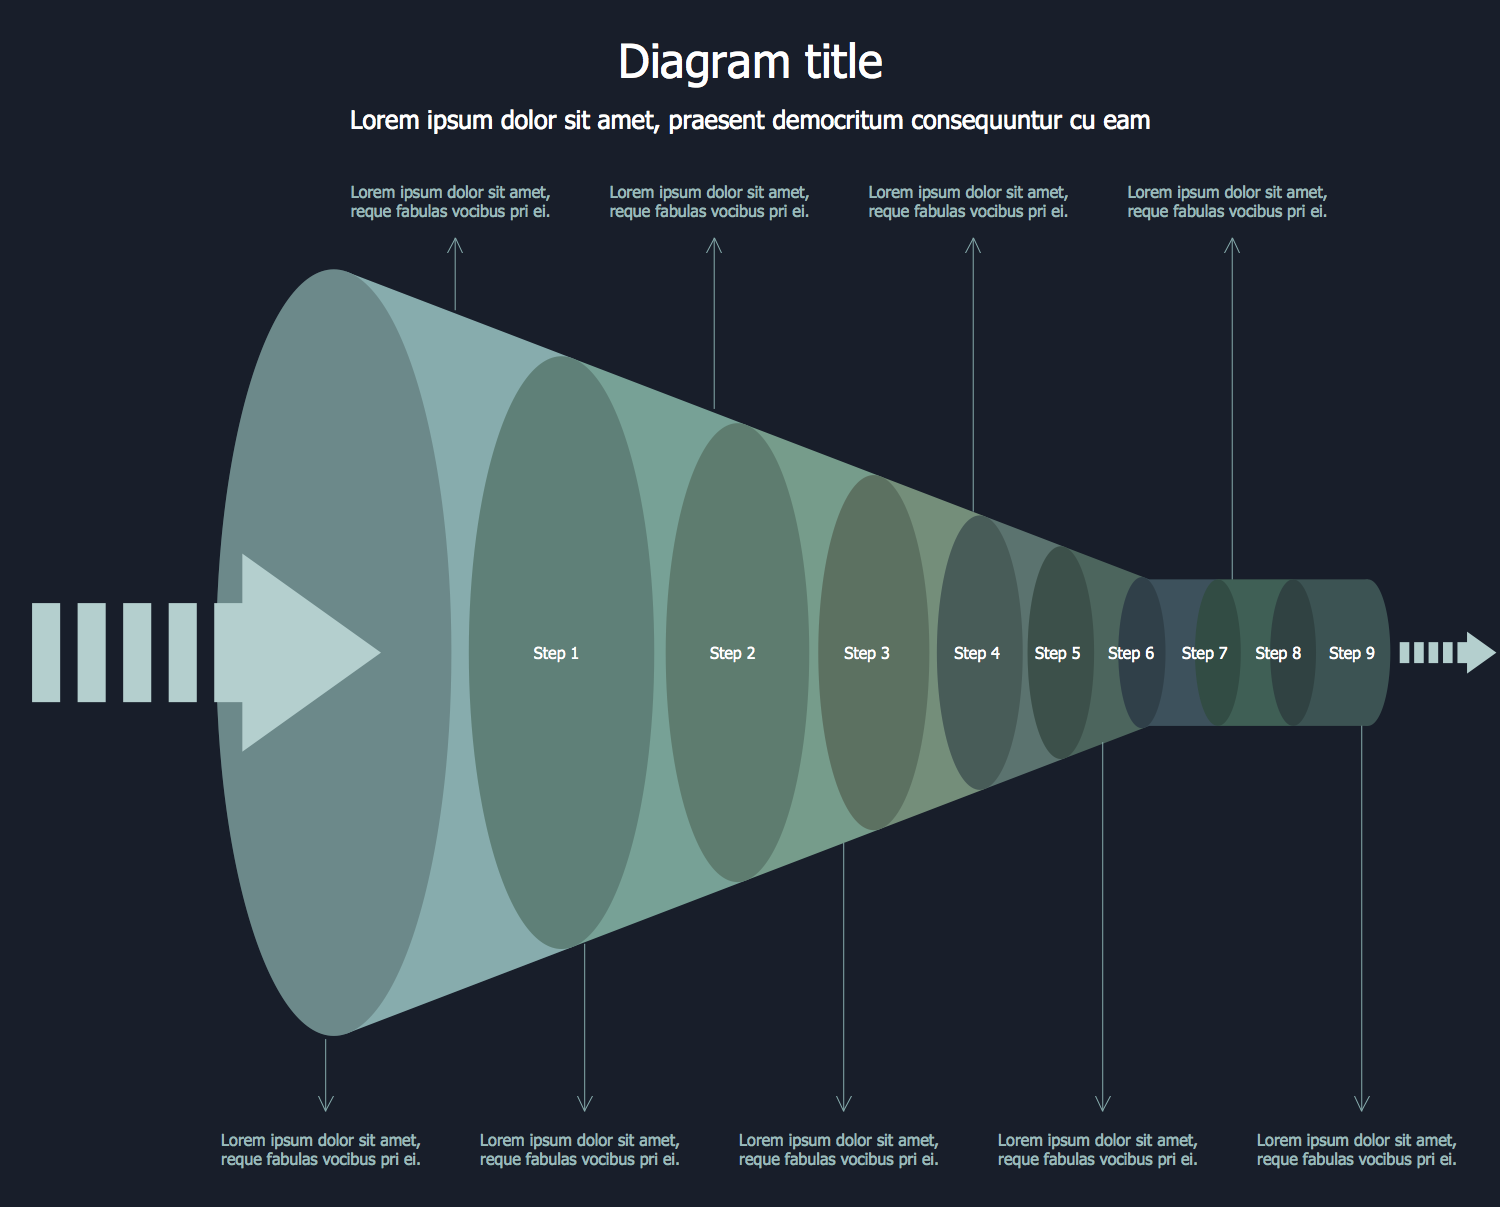
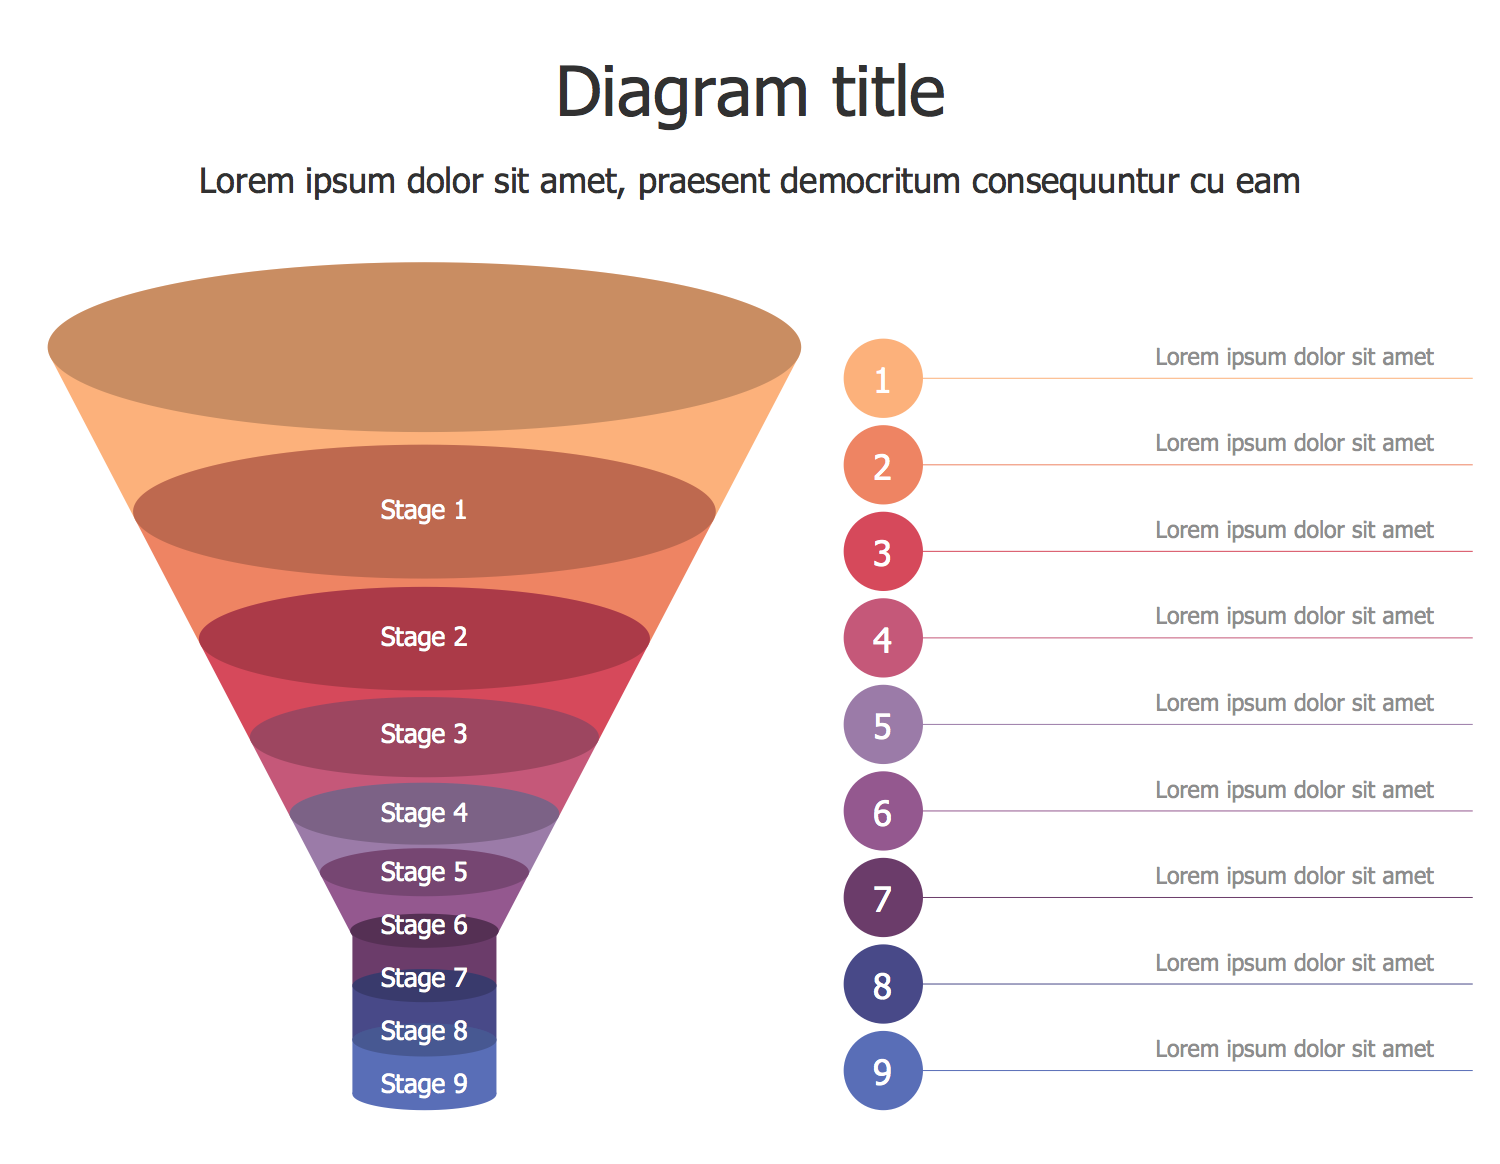
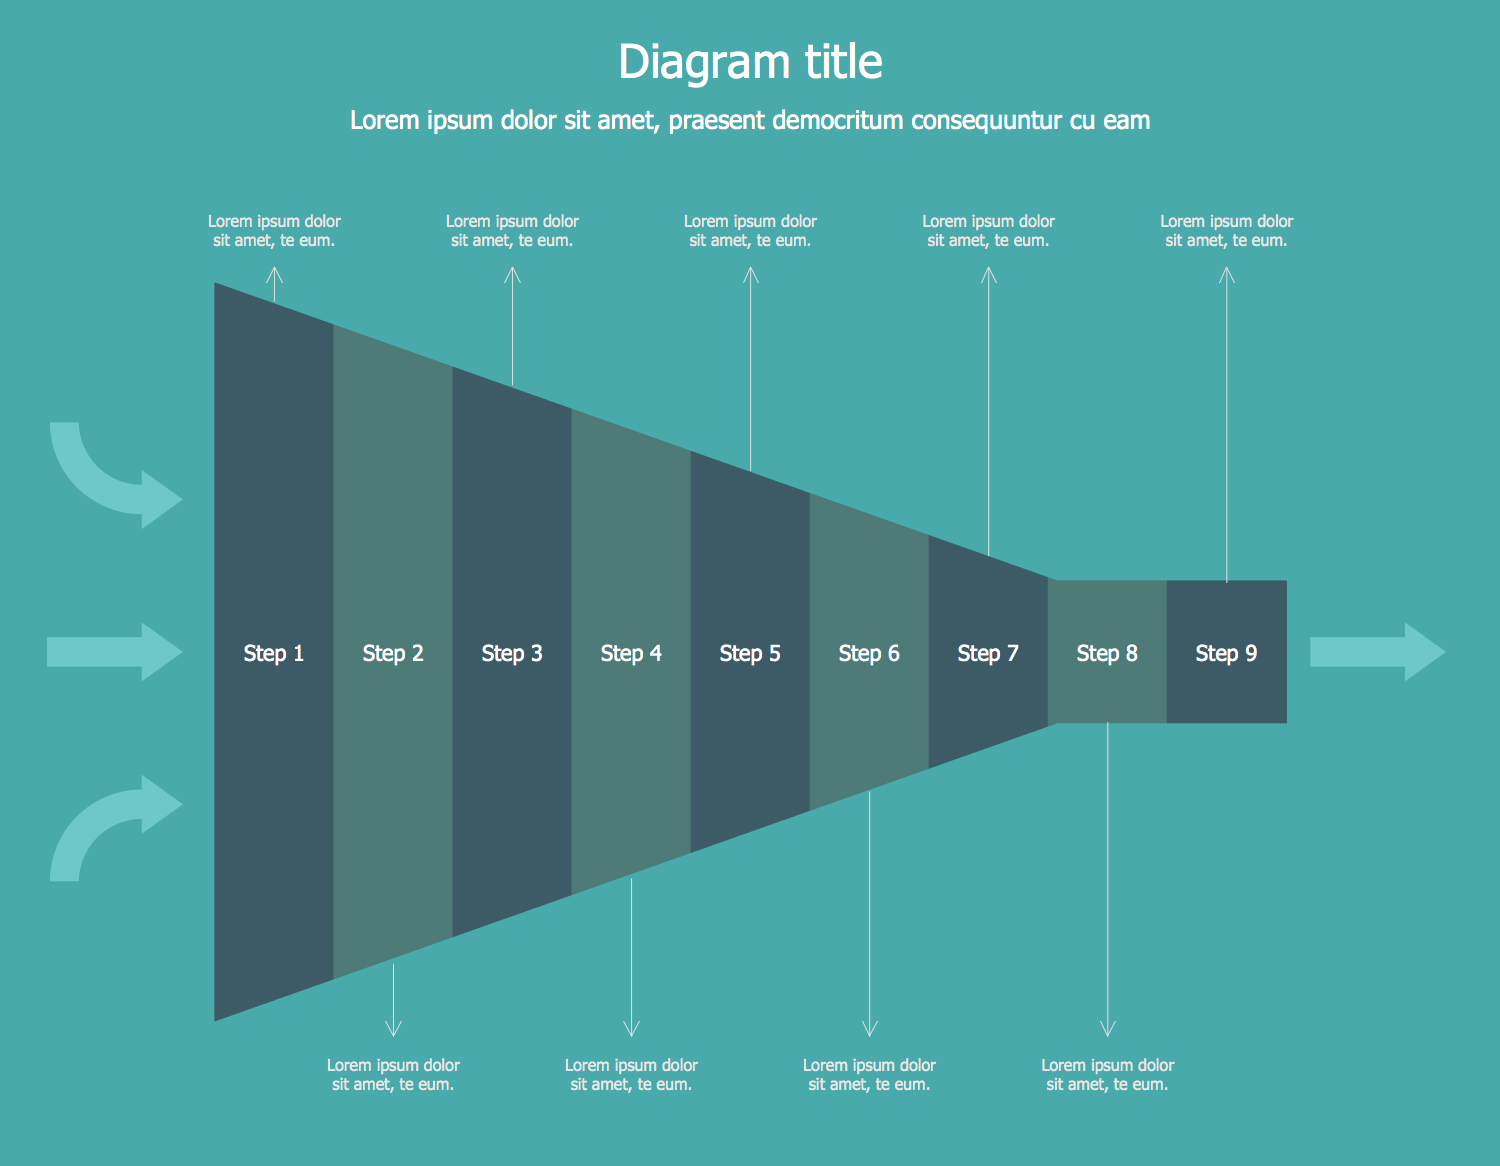
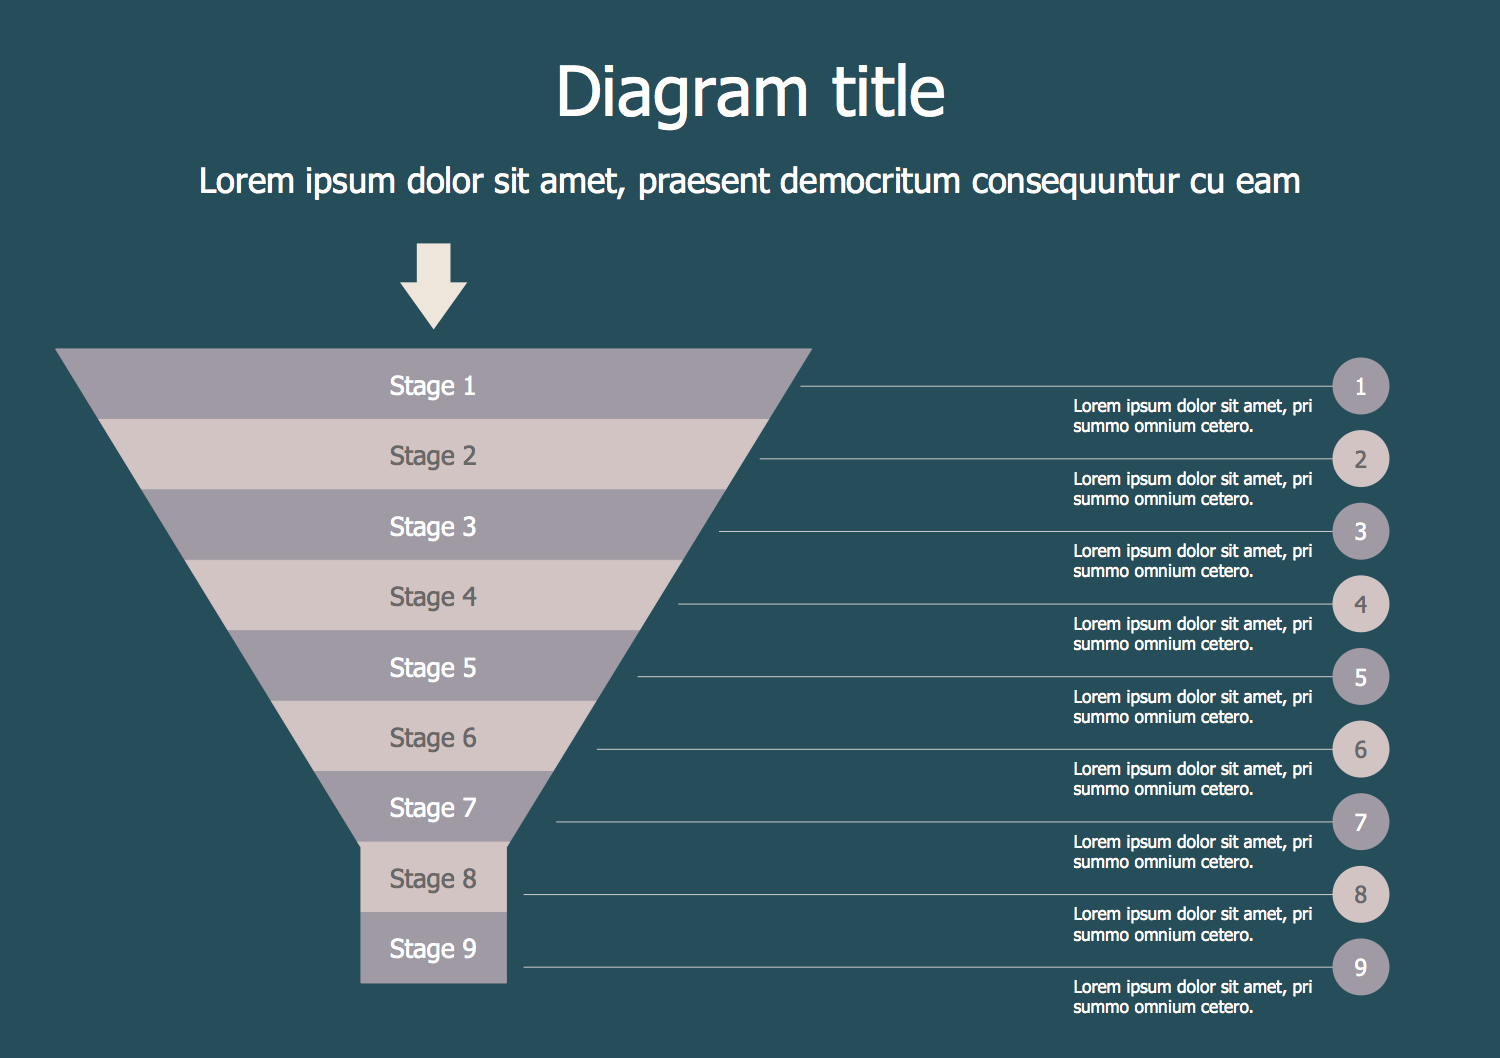
There are design options for funnel charts that include 2D and 3D charts in different orientations. Thus, it is possible to construct a vertical funnel scheme that tapers completely from top to bottom. In addition, with ConceptDraw DIAGRAM, you can create a horizontal funnel chart that also tapers from left to right or right to left.
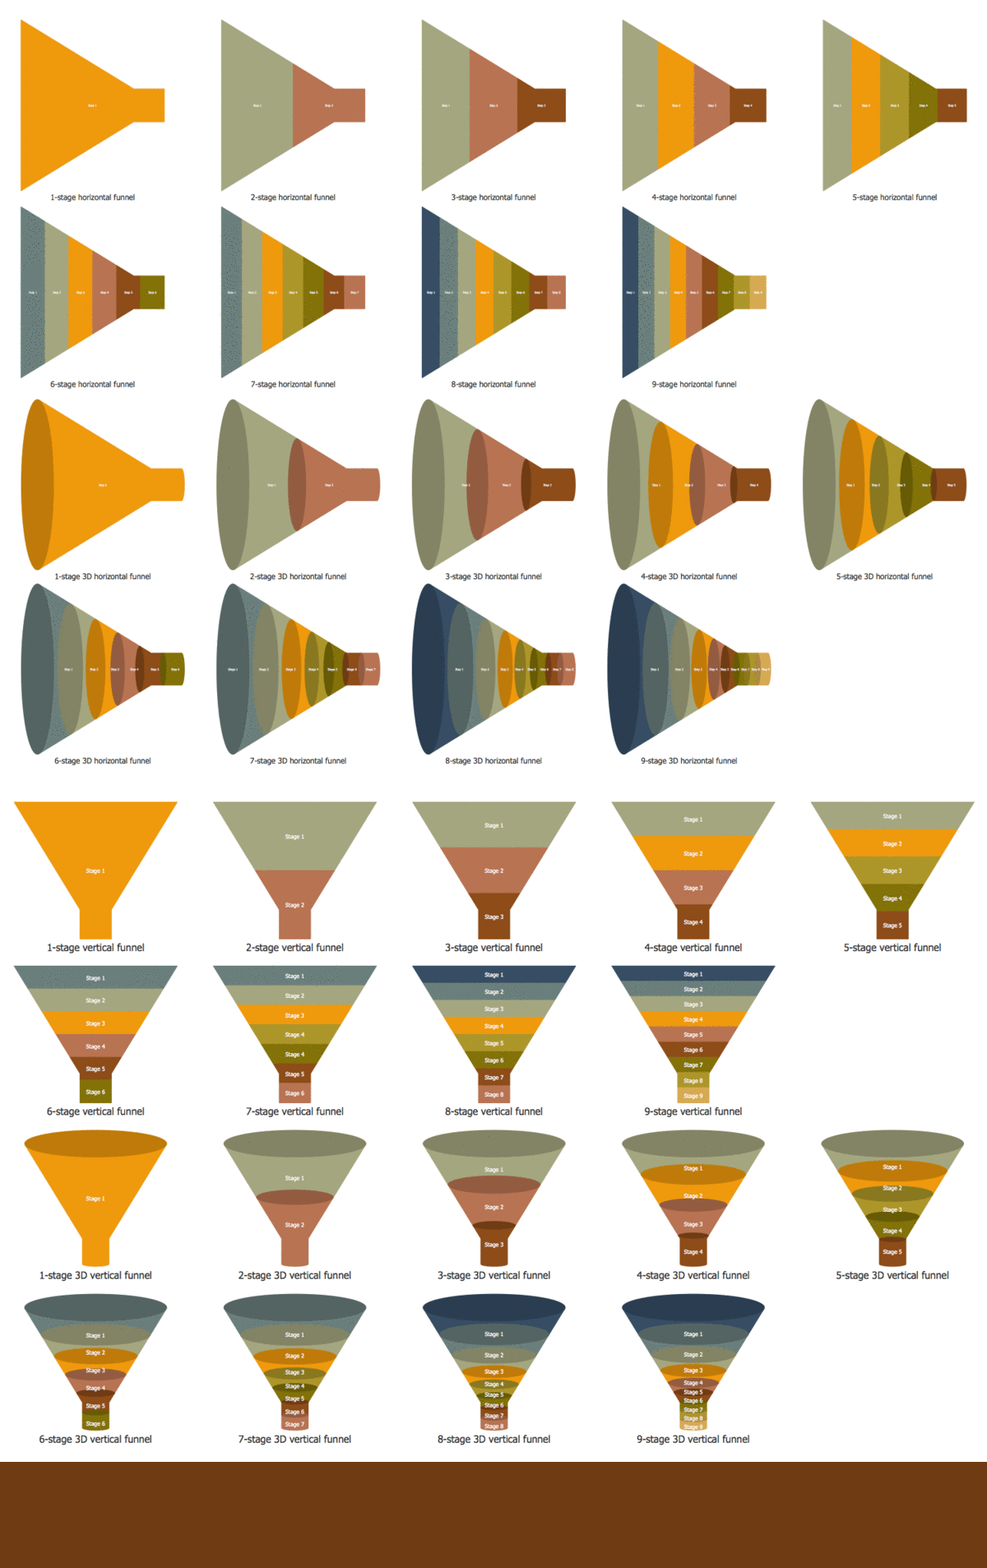
The Funnel Diagrams solution also allows you to draw funnel-style infographics that represent any step in the process at the desired reduction factor that will be used to visualize different funnel models. The latter can be models of a brand funnel, conversion funnel (customer conversion funnel or online conversion funnel), customer lifecycle funnel, launch funnel, lead generation funnel, etc.
The best way to draw charts for a brand's sales funnel is to clarify what brand awareness is. Thus, the term "brand awareness" refers to the degree to which customers can remember or recognize a particular brand. As a key factor in advertising management, consumer behavior, strategy development, and brand management, such awareness cannot mean that a consumer has to remember a particular brand name. At the same time, they may remember at least a few distinctive features that are enough to keep the consumer buying process going.
When talking about buying and selling processes, it makes sense to mention another term - "conversion funnel". It is a popular phrase used in e-commerce and is used to describe the consumer journey through a search engine (search funnel). Consumers can also find online advertisements crawling through an e-commerce website ending with the purchase of things. Potential customers can be so called "bottom funnel", "top funnel" or "middle funnel".
In this case, it would be useful to know the term "funnel analysis" as it includes the use of various events leading to a specific goal. They are mainly used to organize e-commerce platform sales or online purchase advertisements. In addition to the above, order fulfillment may relate to this topic. The reason is that it is a complete process from the point of sales inquiry to the moment the product is delivered to the customer.
The consumer's ability to recognize or recall a brand is known to play a key role in a purchasing decision. The reason is that a purchase is not possible if the consumer does not know the category of the product. Any consumer should also be aware of a brand belonging to a specific category.
Also, any ConceptDraw DIAGRAM user can create marketing funnel diagrams (such as DAGMAR marketing diagrams), as well as order fulfillment funnel, etc. Among the most popular are product funnel, recruitment funnel, purchase funnel (AIDA or customer/consumer). search funnel or sales funnel chart. Examples of the latter include e-commerce sales funnel, online sales funnel, and sales management funnel diagrams.
Being involved in the sales process engineering activity (also known as "sales pipeline engineering" or "sales funnel engineering"), you might also find the Funnel Diagrams solution a useful tool for managing and completing your tasks on time.
The Funnel Diagrams solution is what expands the ConceptDraw DIAGRAM diagramming and vector graphics software into a professional funnel chart drawing tool. It includes a library of vector stencils with pre-designed vertical and horizontal funnel shapes, callouts, arrows, and icons, so you can use it to create funnel diagrams and related infographics in a short period of time. In addition to the design elements mentioned, there are also funnel diagrams samples and templates to help you get started quickly with the images you need. It also provides tutorials and resources for learning best practices for funnel charting.
