Pyramid Diagram
Pyramid diagrams help you visualize information as a triangle divided into horizontal slices. Labelled slices represent a hierarchy. Pyramids are used in marketing presentations to show and analyze hierarchy levels. 3D triangular diagram of DIKW pyramid has 6 levels: measurement, facts, data, information, knowledge, wisdom. The data component include different scattered signs or symbols which are merely useless until these random objective facts are somehow processed. Data is a resource which has to be manipulated or rearranged to get useful. Information can be extracted from a pile of data, it also can be mined from different data storages.Examples of Flowcharts, Org Charts and More
ConceptDraw DIAGRAM covers a broad spectrum of business graphics categories and offers at ConceptDraw STORE enormous online collection of pictorial examples and samples for different thematics and application areas. It is a plentiful source of inspiration and wonderful examples of professionally designed diagrams, flowcharts, UML diagrams, organizational charts, databases, ERDs, network diagrams, business charts, different thematic charts, schematics, infographics and plans developed specially for knowledge workers, engineers, managers, businessmen, marketing specialists, analytics, scientists, students, professors, journalists and also for a large number of other people that every day use various diagrams and drawings in their work and life activity. Each of these examples is a real art, all they are well thought-out and designed without efforts with help of powerful tools of ConceptDraw DIAGRAM software. ConceptDraw examples display all variety of tasks, possibilities and results that ConceptDraw Product Line lets achieve fast and easy. ConceptDraw is one of the best Visio alternatives for Mac. It open all Visio formats like.vsdx,.vss,.vdx files and allows you to export files to Visio formats.
Diagram of a Pyramid
Pyramid diagram is a convenient way of representing data hierarchical structure and visualization relationships between hierarchy levels. You need create the diagram of a pyramid? ConceptDraw diagramming and vector drawing software supplied with Pyramid Diagrams Solution from the Marketing Area of ConceptDraw Solution Park is the best tool for drawing attractive and successful diagram of a pyramid.Pyramid Diagram
The DIKW Pyramid refers loosely to a class of models for representing purported structural and/or functional relationships between data, information, knowledge, and wisdom.
Basic Diagramming
This solution extends ConceptDraw DIAGRAM software with the specific tools you need to easily draw flowcharts, block diagrams, histograms, pie charts, divided bar diagrams, line graphs, circular arrows diagrams, Venn diagrams, bubble diagrams and concept maps
How to Create a Process Flowchart
Use ConceptDraw DIAGRAM diagramming and vector graphics software to visually model your own IT construction processes.Network Diagram Software. LAN Network Diagrams. Physical Office Network Diagrams
Physical LAN Diagrams illustrate the communication schemes of Local Area Networks, the physical network connection of computers and networks arrangement on the small areas - at homes, offices, and other buildings. ConceptDraw DIAGRAM is a perfect network diagramming software with samples and examples of WAN and LAN Diagrams, templates and collection of network components libraries. Computer Network Diagrams Solution for ConceptDraw DIAGRAM Mac and Windows is ideal for IT professionals, network engineers and network designers who need to visualize network architecture, to document LANs physical structure and arrangement, to draw Local Area Network (LAN) diagrams and schematics, WAN diagrams, physical office network diagrams and topologies, wiring drawings, etc. You can design all them easy using the predesigned vector objects of computers and computer network devices, hardware devices, peripheral devices, external digital devices, internet and logical symbols, and many other stencils from the Computer Network Diagrams libraries. ConceptDraw DIAGRAM offers a powerful and easy-to-use solution for those who looking for a Visio alternative for Mac. It is a world-class diagramming platform with dynamic presentation power.
Column Chart Software
ConceptDraw Column Chart software allows drawing column charts using predesigned objects or drawing tools. In ConceptDraw Column Chart software you can find a complete set of column chart tools and objects.Process Flow Chart Symbols
Process Flow Chart is a visual diagram which shows the processes and relationships between the major components in a system, and uses for this the special process flow chart symbols: special shapes to represent different types of actions and process steps, lines and arrows to represent relationships and sequence of steps. It often named process flow diagram, it use colored flowchart symbols. It is incredibly convenient to use the ConceptDraw DIAGRAM software extended with Flowcharts Solution from the "Diagrams" Area of ConceptDraw Solution Park for designing professional looking Process Flow Charts.
Directional Maps
Directional Maps solution extends ConceptDraw DIAGRAM software with templates, samples and libraries of vector stencils for drawing the directional, location, site, transit, road and route maps, plans and schemes.
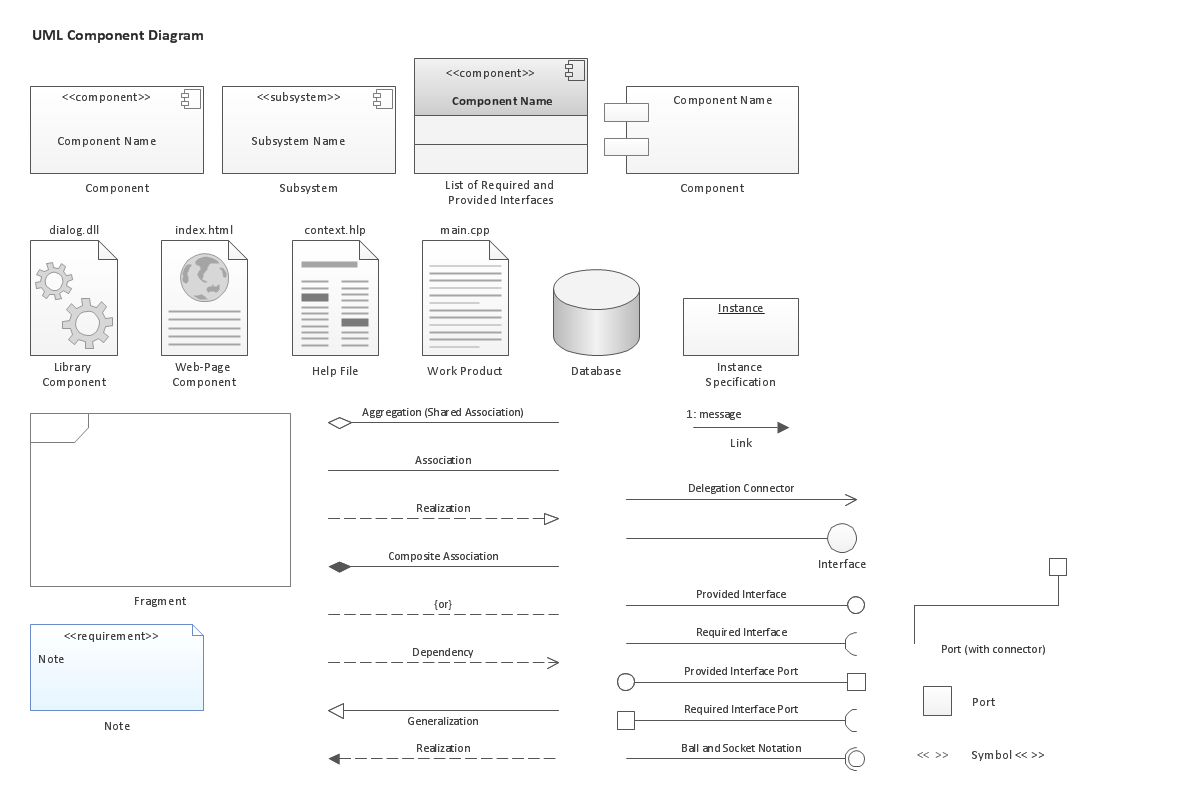
UML Component Diagram. Design Elements
UML Component Diagram illustrates show components are wired together to larger components and software systems that shows the structure of arbitrarily complex systems. Rapid UML Solution for ConceptDraw DIAGRAM contains 13 vector stencils libraries with 393 interactive shapes that you can use to design your UML diagrams. To design a Component Diagram use the UML Component Diagram library. UML Component Diagram library contains 36 shapes
HelpDesk
How to Draw a Pyramid Diagram
Pyramid diagram (triangle diagram) is used to represent data, which have hierarchy and basics. Due to the triangular form of the diagram, each pyramid section has a different width. The width of the segment shows the level of its hierarchy. Typically, the top of the pyramid is the data that are more important than the base data. A pyramid scheme can be used to show proportional and hierarchical relationships between some logically related items, such as departments within an organization, or successive elements of any process. This type of diagram is often used in marketing to display hierarchically related data, but it can be used in a variety of situations. ConceptDraw DIAGRAM allows you to make a pyramid diagram, quickly and easily using special libraries.How to Create a Pyramid Diagram
ConceptDraw Pyramid Diagram software allows drawing column charts using predesigned objects or drawing tools. In ConceptDraw Pyramid Diagram software you can find a complete set of column chart tools and objects.Maps and Directions
ConceptDraw DIAGRAM diagramming and vector drawing software extended with Directional Maps Solution from the Maps Area of ConceptDraw Solution Park is a powerful maps and directions design software. Let's review the tools of this solution.HelpDesk
How to Draw a Histogram
A histogram is a diagram used to visualize data through bars of variable heights. Making histogram can be helpful if you need to show data covering various periods (hours, days, weeks, etc). When the vertical column of the histogram refers to the frequency it shows how many times an event happens. It is a Frequency Histogram. A bar chart diagram is similar to a histogram, but in contrast to a bar chart, a histogram represents the number how many times there have been certain data values. You can use a histogram to depict continual data flow such as temperature, time, etc. You can effortlessly draw histograms using the Histograms solution for ConceptDraw DIAGRAM. Making a histogram can be very useful to represent various statistical data.- Directional Maps | 3D pictorial road map | Examples of Flowcharts ...
- 3D Network Diagram Software | Pyramid Diagram | Examples of ...
- Design elements - 3D directional maps | Process Flowchart ...
- 3D Network Diagrams. Computer and Network Examples | Network ...
- Design elements - 3D directional maps | Basic Flowchart Symbols ...
- Providing telecom services - Cross-functional flowchart | 3D Column ...
- 3D Network Diagram Software | Telecommunication Network ...
- Providing telecom services - Cross-functional flowchart | 3D Network ...
- Flow Chart On 3d
- 3d Flow Chart
- Network Topologies | Work Order Process Flowchart . Business ...
- Flow chart Example. Warehouse Flowchart | Design elements - 3D ...
- 3d Flowchart Software
- How To Make A 3d Flow Chart On Resoures
- Flow Chart Of 3d
- Chart Maker for Presentations | Examples of Flowcharts , Org Charts ...
- Block Diagrams | Active Directory Diagram | Examples of Flowcharts ...
- Examples of Flowcharts , Org Charts and More | Column Chart ...
- Examples of Flowcharts , Org Charts and More | Network Diagram ...
- Mobile Satellite Flowchart