"Causes in the diagram are often categorized, such as to the 6 M's ...
The 6 Ms (used in manufacturing industry)
- Machine (technology)
- Method (process)
- Material (Includes Raw Material, Consumables and Information.)
- Man Power (physical work)/ Mind Power (brain work): Kaizens, Suggestions
- Measurement (Inspection)
- Milieu/ Mother Nature (Environment)
The original 6Ms used by the Toyota Production System have been expanded by some to include the following and are referred to as the 8Ms. However, this is not globally recognized. It has been suggested to return to the roots of the tools and to keep the teaching simple while recognizing the original intent; most programs do not address the 8Ms.
- Management/ Money Power
- Maintenance" [Ishikawa diagram. Wikipedia]
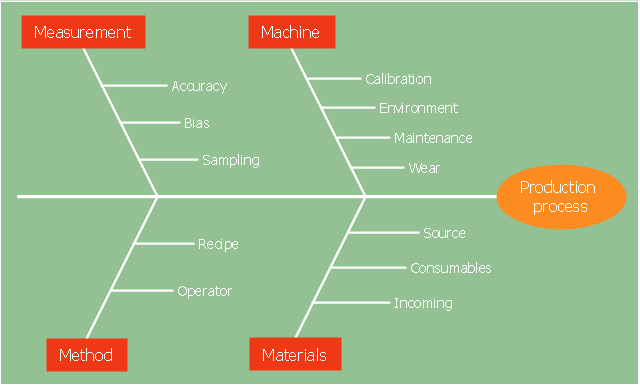
The 4Ms fishbone diagram (cause and effect diagram, Ishikawa diagram) example "Production process" was created using the ConceptDraw PRO diagramming and vector drawing software extended with the Fishbone Diagrams solution from the Management area of ConceptDraw Solution Park.
"Causes in the diagram are often categorized, such as to the 6 M's ...
The 6 Ms (used in manufacturing industry):
(1) Machine (technology);
(2) Method (process);
(3) Material (Includes Raw Material, Consumables and Information.);
(4) Man Power (physical work)/ Mind Power (brain work): Kaizens, Suggestions;
(5) Measurement (Inspection);
(6) Milieu/ Mother Nature (Environment).
The original 6Ms used by the Toyota Production System have been expanded by some to include the following and are referred to as the 8Ms. However, this is not globally recognized. It has been suggested to return to the roots of the tools and to keep the teaching simple while recognizing the original intent; most programs do not address the 8Ms.
(7) Management/ Money Power;
(8) Maintenance." [Ishikawa diagram. Wikipedia]
This 8Ms Ishikawa diagram (manufacturing cause and effect diagram) template is included in the Fishbone Diagram solution from the Management area of ConceptDraw Solution Park.
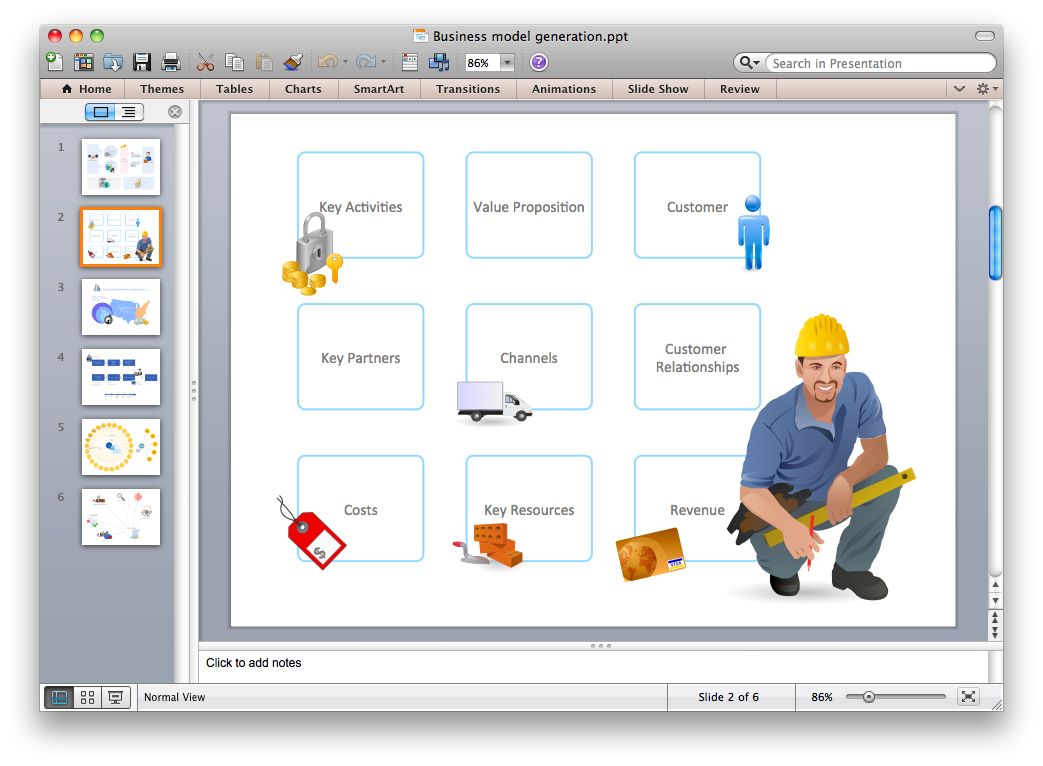
Export from ConceptDraw DIAGRAM Document to PPT or PPTX (MS PowerPoint®) File
ConceptDraw DIAGRAM has extensive export capabilities which allow you to export your drawing to
HelpDesk
Replace Your Current Diagramming Tool
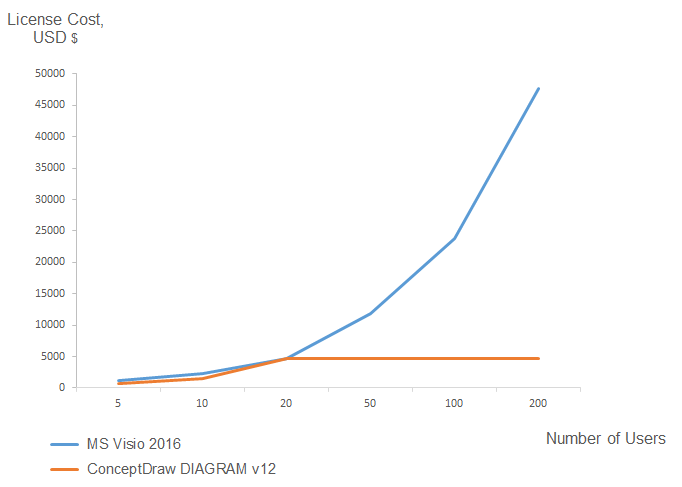
Migrate from Visio to ConceptDraw for the entire organization at super low price. By means of a ConceptDraw DIAGRAM Site License any employer in your company can get advantages of ConceptDraw DIAGRAM in just a $ 2995 per year. There is no need to count both licenses and users. Every co-worker in your organization will get permission to access at no extra charge. At half-price of Microsoft Visio®, you can supply your company with a ConceptDraw Site License. Reduced price and effortless administrating are just a couple of the causes to change Visio to ConceptDraw DIAGRAM. Here are just a few reasons.HelpDesk
How to Convert Visio Stencils for Use in ConceptDraw DIAGRAM
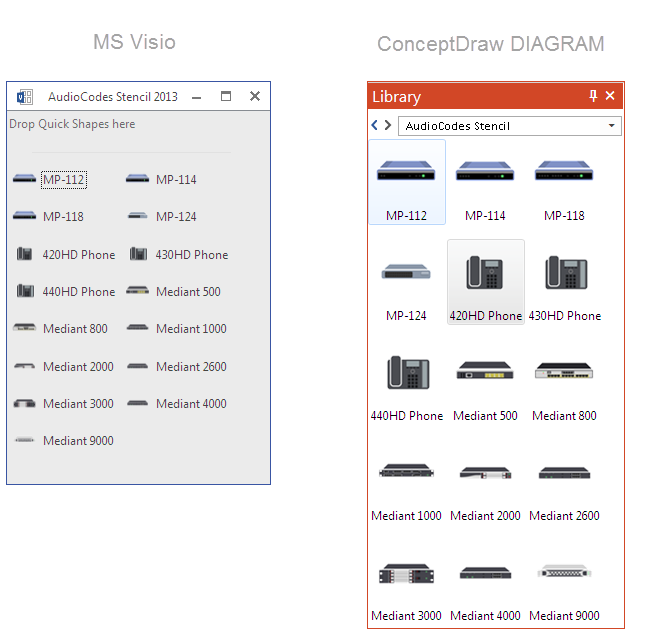
MS Visio provides users with a number of predefined stencils. Standard Visio stencils contain shapes that are basically used to create diagrams. The shapes can range from simple flow chart boxes or lines to more complicated shapes like servers, racks or anything else that needs to be represented in a graphical form. ConceptDraw DIAGRAM supports the possibility to open Visio stencils. With the introduction of Visio 2013, Microsoft has changed the native file format used in earlier versions of Microsoft Visio. Thus, when you are looking for a professional tool to open and save in the newer Visio 2013 file format on Mac, ConceptDraw DIAGRAM is the solution for you. ConceptDraw DIAGRAM file import and export work round-trip with the new Visio VSDX file format and at the same time supports the improved import of VDX file format. To use Visio stencils created with MS Visio 2010 in your diagrams, created with ConceptDraw DIAGRAM, follow the steps described in the following article.HelpDesk
How to Import MS Project File to a Mind Map Using the Project Exchange Solution
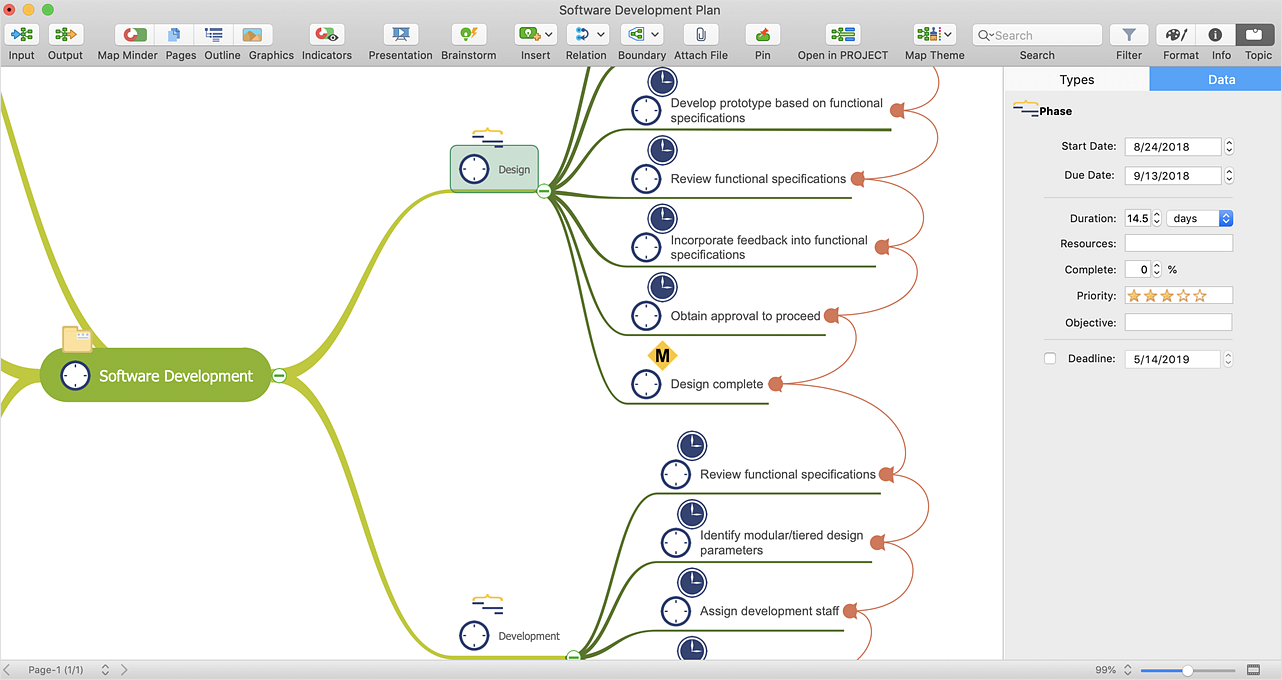
ConceptDraw MINDMAP can export a mind map to MS Project; it can also import a project file from MS Project, making a working visual map of a planned project. ConceptDraw MINDMAP supports inputting external data into a map with one click. Input capabilities are critical because it makes your data visual. When your data is visual, you can manage and communicate it using newly generated documents and/or presentations. Data you can input into your map can come from just about anywhere. Data can come from Microsoft Word, Excel, Outlook, Project, the web, a mind map, and other electronic sources. You can input data as a task list, resource list, Gantt chart, brainstorm or search results.HelpDesk
How to Upgrade ConceptDraw OFFICE -3
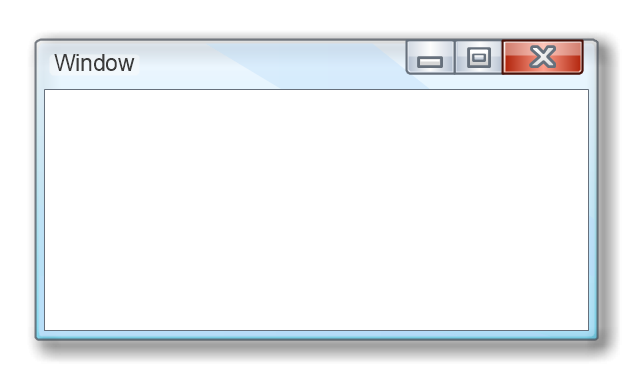
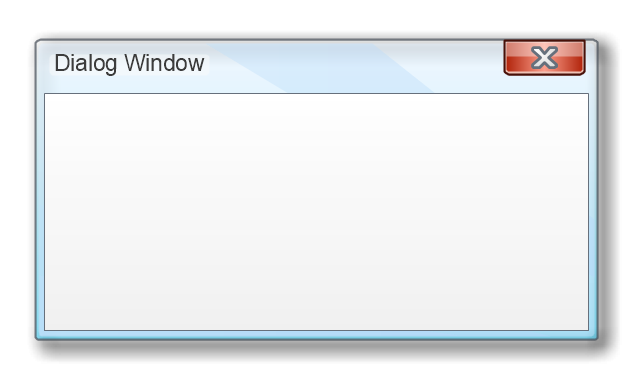
Since CS Odessa Introduced ConceptDraw Office v3 – A Powerful Collection of ConceptDraw Productivity and Project Applications for Mac and PCC, any customer who has previously purchased ConceptDraw Office vv.1,2 products is eligible for upgrade pricing. Owners of previous versions can upgrade their applications to the latest release.The vector stencils library "MS Windows Vista user interface" contains 76 MS Windows Vista design elements.
Use it for designing Microsoft ribbon graphic user interface (GUI) of software for computers with MS Windows Vista OS in the ConceptDraw PRO diagramming and vector drawing software extended with the Graphic User Interface solution from the Software Development area of ConceptDraw Solution Park.
Use it for designing Microsoft ribbon graphic user interface (GUI) of software for computers with MS Windows Vista OS in the ConceptDraw PRO diagramming and vector drawing software extended with the Graphic User Interface solution from the Software Development area of ConceptDraw Solution Park.
Network Diagram Software. LAN Network Diagrams. Physical Office Network Diagrams
Physical LAN Diagrams illustrate the communication schemes of Local Area Networks, the physical network connection of computers and networks arrangement on the small areas - at homes, offices, and other buildings. ConceptDraw DIAGRAM is a perfect network diagramming software with samples and examples of WAN and LAN Diagrams, templates and collection of network components libraries. Computer Network Diagrams Solution for ConceptDraw DIAGRAM Mac and Windows is ideal for IT professionals, network engineers and network designers who need to visualize network architecture, to document LANs physical structure and arrangement, to draw Local Area Network (LAN) diagrams and schematics, WAN diagrams, physical office network diagrams and topologies, wiring drawings, etc. You can design all them easy using the predesigned vector objects of computers and computer network devices, hardware devices, peripheral devices, external digital devices, internet and logical symbols, and many other stencils from the Computer Network Diagrams libraries. ConceptDraw DIAGRAM offers a powerful and easy-to-use solution for those who looking for a Visio alternative for Mac. It is a world-class diagramming platform with dynamic presentation power.
Line Chart Template for Word
This sample was created in ConceptDraw DIAGRAM diagramming and vector drawing software using the Line Graphs Solution from Graphs and Charts area of ConceptDraw Solution Park. This sample shows the Line Chart of annual percentage change. The Line Chart allows you to clearly see the changes of data over the time.Total Quality Management Value
The Total quality management (TQM) is an enterprise-wide method of continuous quality improvement of all organizational processes, including the enhancement of ability to deliver high-quality products and services to the customers. The TQM includes eight main elements, which have great value: customer-focused, process-centered, total employee involvement, integrated system, continual improvement, strategic and systematic approach, fact-based decision making, communications. ConceptDraw DIAGRAM diagramming and vector drawing software offers the Total Quality Management Diagram solution with effective drawing tools, predesigned vector elements, samples and templates that help easy design the Total Quality Management diagrams, TQM flowcharts and Mind Maps widely used in quality management projects to visualize the business processes and industrial processes for your organization, to demonstrate the quality control step-by-step in a visual manner, to compare visually the ideal and real stages of processes.
 Fishbone Diagram
Fishbone Diagrams solution extends ConceptDraw DIAGRAM software with templates, samples and library of vector stencils for drawing the Ishikawa diagrams for cause and effect analysis.
HelpDesk
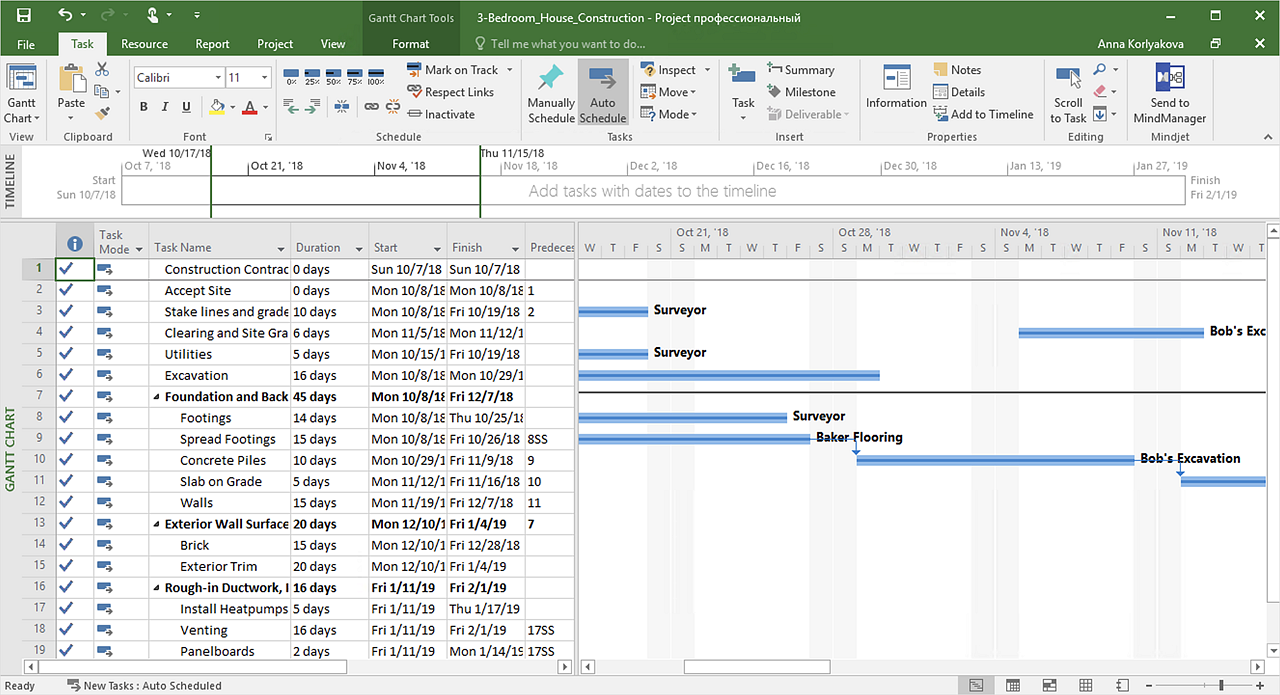
How to Exchange Files with MS Project Users
Ability to exchange project data across different project applications gives users an excellent alternative on the way they manage projects, and assists in the interoperability of project information between team members who have Macintosh and PC computers.- Total Quality Management Value | Fishbone Diagram | 4ms Of ...
- 4 Ms fishbone diagram - Production process | Manufacturing 8 Ms ...
- What Is The 4ms Of Total Quality Management
- Process Flowchart | 4 Ms fishbone diagram - Production process ...
- 4 Ms fishbone diagram - Production process
- Manufacturing 8 Ms fishbone diagram - Template | 4 Ms fishbone ...
- Process Flowchart | Total Quality Management Value | 4 Ms ...
- Manufacturing 8 Ms fishbone diagram - Template | Fishbone ...
- 4 Ms fishbone diagram - Production process | Fishbone Diagram ...
- Manufacturing 8 Ms fishbone diagram - Template
- Data Flow Diagram Model | Peru wheat area and production | 4 Ms ...
- Manufacturing 8 Ms fishbone diagram - Template | 4 Ms Of Prodiction
- Example Of 4ms
- Manufacturing 8 Ms fishbone diagram - Template | 4ms Metod ...
- 5 Positive Effect Of Applying 4ms Of Production
- Data Flow Diagram Model | Process Flowchart | How Do Fishbone ...
- Ishikawa Diagram Process
- 4 Ms Of Production Management
- Process Flowchart | Data Flow Diagram Model | Total Quality ...
