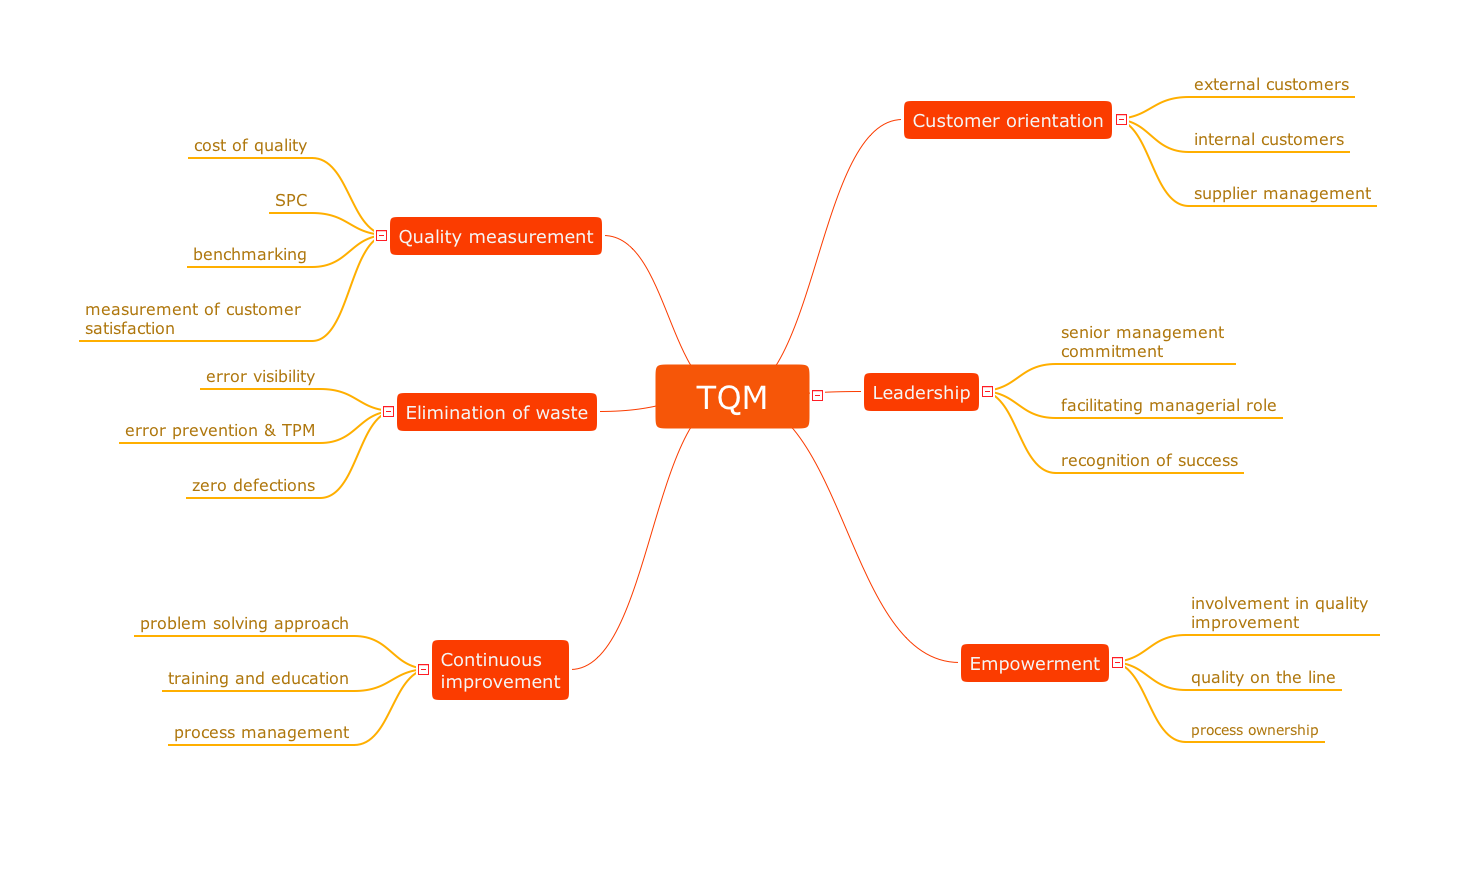
Total Quality Management Value

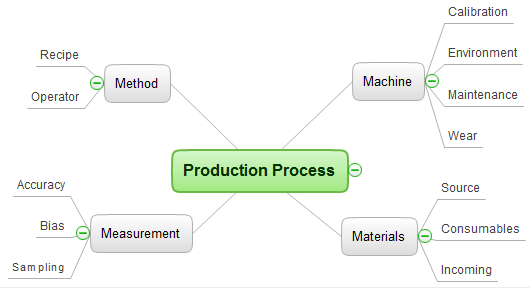
Cause and Effect Analysis - Fishbone Diagrams for Problem Solving

 Office Layout Plans
Office layouts and office plans are a special category of building plans and are often an obligatory requirement for precise and correct construction, design and exploitation office premises and business buildings. Designers and architects strive to make office plans and office floor plans simple and accurate, but at the same time unique, elegant, creative, and even extraordinary to easily increase the effectiveness of the work while attracting a large number of clients.
"Causes in the diagram are often categorized, such as to the 6 M's ...
The 6 Ms (used in manufacturing industry):
(1) Machine (technology);
(2) Method (process);
(3) Material (Includes Raw Material, Consumables and Information.);
(4) Man Power (physical work)/ Mind Power (brain work): Kaizens, Suggestions;
(5) Measurement (Inspection);
(6) Milieu/ Mother Nature (Environment).
The original 6Ms used by the Toyota Production System have been expanded by some to include the following and are referred to as the 8Ms. However, this is not globally recognized. It has been suggested to return to the roots of the tools and to keep the teaching simple while recognizing the original intent; most programs do not address the 8Ms.
(7) Management/ Money Power;
(8) Maintenance." [Ishikawa diagram. Wikipedia]
This 8Ms Ishikawa diagram (manufacturing cause and effect diagram) template is included in the Fishbone Diagram solution from the Management area of ConceptDraw Solution Park.
8Ms Ishikawa diagram

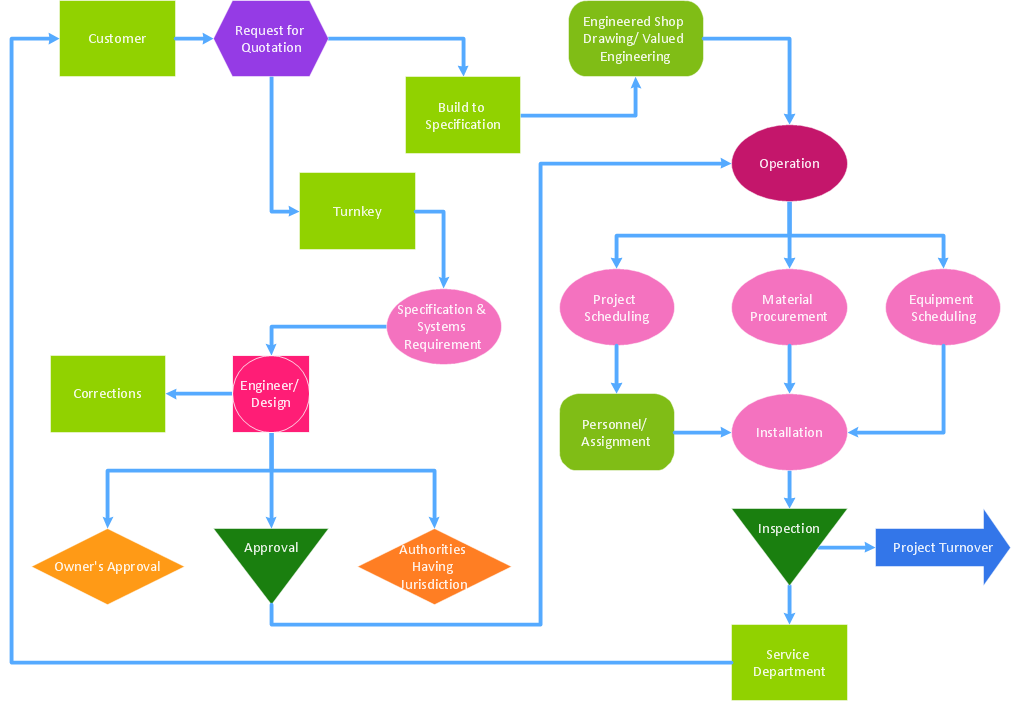
Total Quality Management with ConceptDraw

What is Value Stream Mapping?

A Study of the Business Value of Total Quality Management
Identifying Quality Management System

The Fifty Two Elements of TQM
Great value in depicting and describing a problem in detail
Create TQM Flowcharts for Mac
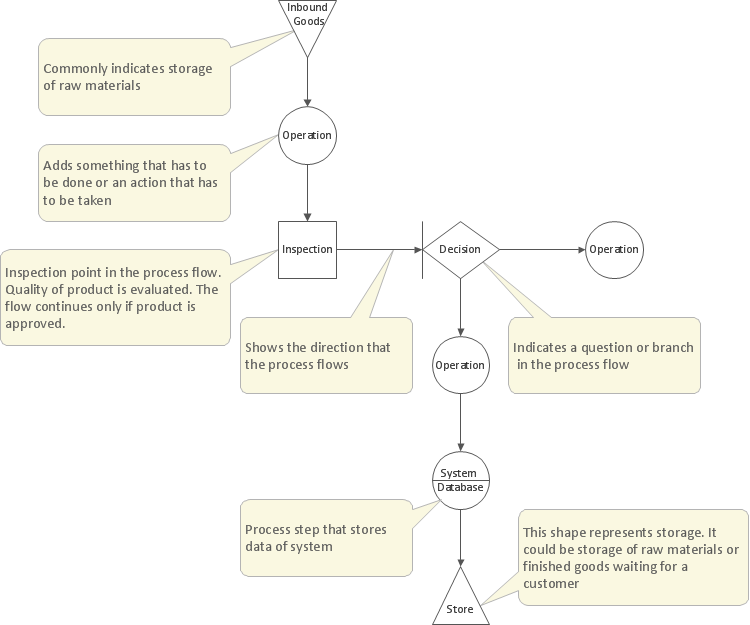
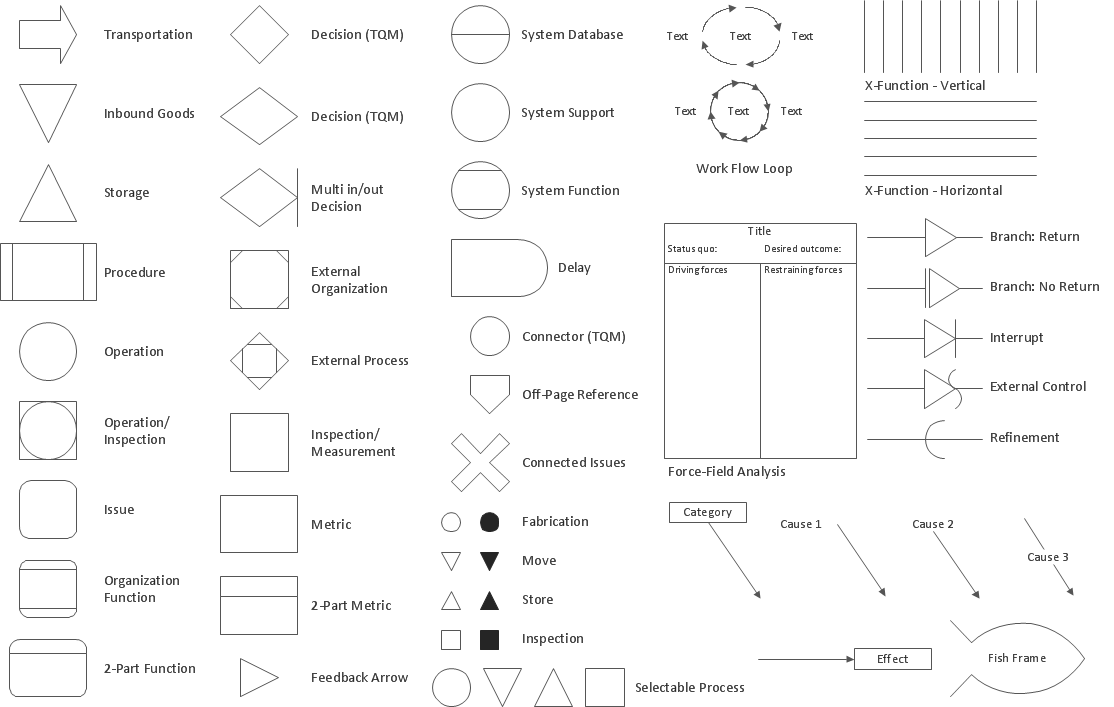
TQM Software — Build Professional TQM Diagrams

SWOT Analysis Tool for Small Business

Group Collaboration Software

What is a Quality Management

- Total Quality Management Value | 4m 1e In Tqm
- Total Quality Management Value | What Is 4m 1e In Quality
- 4m Analysis Example
- Ishikawa Diagram Original 4m
- Total Quality Management Value | Fishbone Diagram 4m 1e
- Total Quality Management Value | Office Layout Plans | 4m Principle
- Management 4m Example
- Total Quality Management Value | 4m 1e
- 4m Quality Method
- The 4m Productivity Fishbone Diagram
- 4m Fishbone
- Fishbone Diagram On 4m Condition
- Total Quality Management Value | 4m And 1 E
- Draw Fishbone Diagram on MAC Software | 4m Spine Diagram
- Total Quality Management Value
- 4m Analysis Format
- Total Quality Management Value | 4m And 1e
- 4m Analysis
- 4m Diagram
- Total Quality Management Value | 4m 1 E