"Causes in the diagram are often categorized, such as to the 6 M's ...
The 6 Ms (used in manufacturing industry):
(1) Machine (technology);
(2) Method (process);
(3) Material (Includes Raw Material, Consumables and Information.);
(4) Man Power (physical work)/ Mind Power (brain work): Kaizens, Suggestions;
(5) Measurement (Inspection);
(6) Milieu/ Mother Nature (Environment).
The original 6Ms used by the Toyota Production System have been expanded by some to include the following and are referred to as the 8Ms. However, this is not globally recognized. It has been suggested to return to the roots of the tools and to keep the teaching simple while recognizing the original intent; most programs do not address the 8Ms.
(7) Management/ Money Power;
(8) Maintenance." [Ishikawa diagram. Wikipedia]
This 8Ms Ishikawa diagram (manufacturing cause and effect diagram) template is included in the Fishbone Diagram solution from the Management area of ConceptDraw Solution Park.
8Ms Ishikawa diagram

HelpDesk
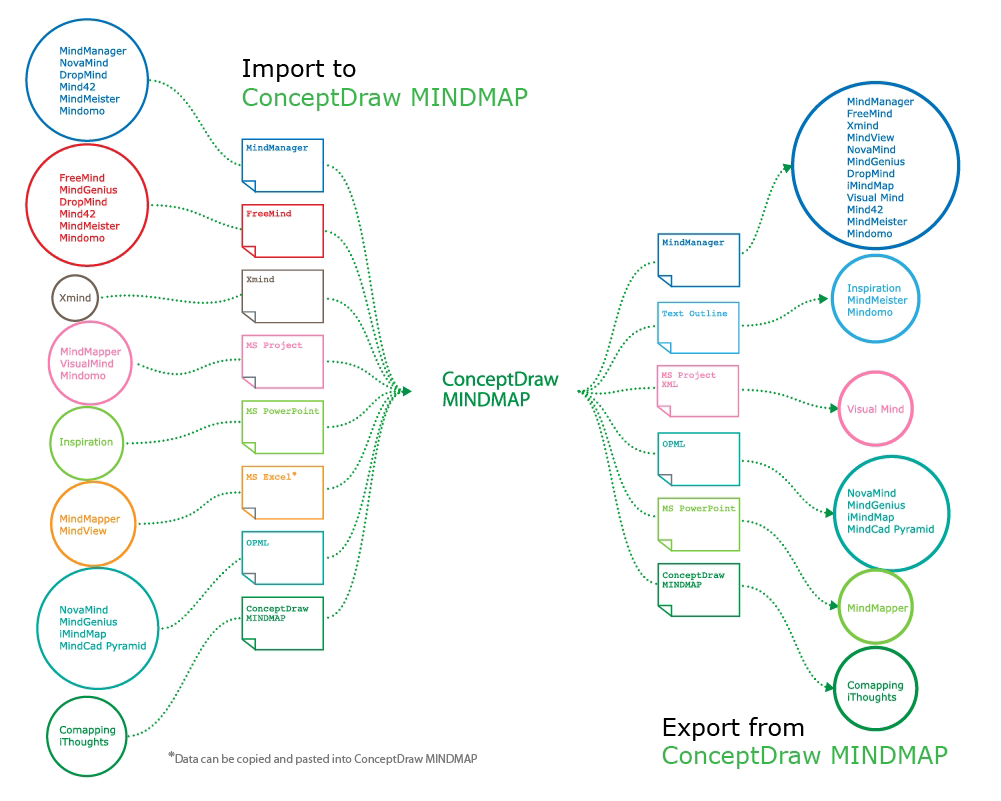
How to Exchange Files with MS Project Users

PROBLEM ANALYSIS. Root Cause Analysis Tree Diagram


ConceptDraw DIAGRAM Compatibility with MS Visio

7 Management & Planning Tools

 Seven Management and Planning Tools
Seven Management and Planning Tools solution extends ConceptDraw DIAGRAM and ConceptDraw MINDMAP with features, templates, samples and libraries of vector stencils for drawing management mind maps and diagrams.
How to Exchange ConceptDraw MINDMAP Files with Mindjet MindManager
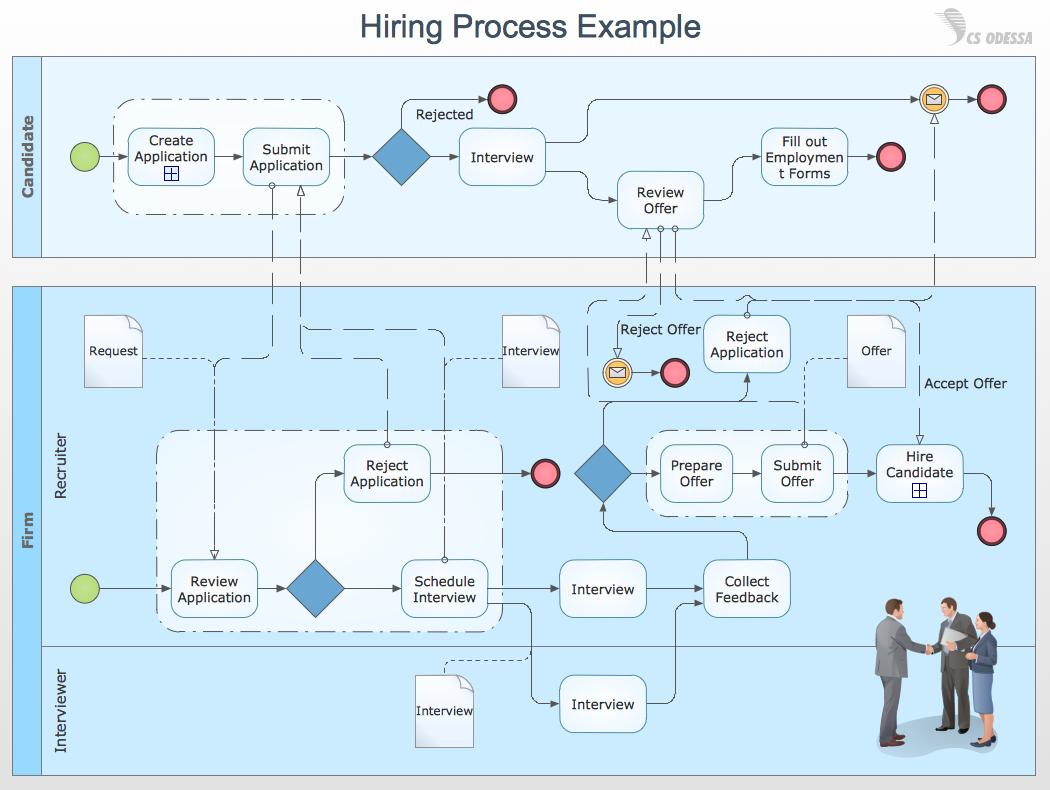
Cross-Functional Process Map Template

How to Draw Business Process Diagrams with RapidDraw Interface

How To Plan and Implement Projects Faster

Business Process Modeling with ConceptDraw
Powerful Drawing Feature for Creating Professional Diagrams

 Management
This solution extends ConceptDraw DIAGRAM and ConceptDraw MINDMAP with Management Diagrams and Mind Maps (decision making, scheduling, thinking ideas, problem solving, business planning, company organizing, SWOT analysis, preparing and holding meetings
- Conceptdraw.com: Mind Map Software, Drawing Tools | Project ...
- Manufacturing 8 Ms fishbone diagram - Template | Management ...
- Manufacturing 8 Ms fishbone diagram - Template | How Do ...
- The Sales Process | 7 Management & Planning Tools ...
- 7 Management & Planning Tools | Corrective Action Planning | The ...
- Manufacturing 8 Ms fishbone diagram - Template | List 8ms In ...
- 7 Management & Planning Tools | Process Flowchart | Business ...
- Manufacturing 8 Ms fishbone diagram - Template | Fishbone ...
- Manufacturing 8 Ms fishbone diagram - Template | Total Quality ...
- 7 Tools For Quality Example
- Manufacturing 8 Ms fishbone diagram - Template | Draw Fishbone ...
- Total Quality Management Value | Manufacturing 8 Ms fishbone ...
- Manufacturing 8 Ms fishbone diagram - Template | Office Layout ...
- Manufacturing 8 Ms fishbone diagram - Template | 8m Method ...
- 7 New Management Tools Examples
- 8 Ms Of Production Management
- Service 8 Ps fishbone diagram - Template | Fishbone Diagrams ...
- ConceptDraw PRO Compatibility with MS Visio
- McKinsey 7S framework | 7 Management & Planning Tools | Bubble ...
- 4 Ms fishbone diagram - Production process | Total Quality ...