"Causes in the diagram are often categorized, such as to the 6 M's ...
The 6 Ms (used in manufacturing industry):
(1) Machine (technology);
(2) Method (process);
(3) Material (Includes Raw Material, Consumables and Information.);
(4) Man Power (physical work)/ Mind Power (brain work): Kaizens, Suggestions;
(5) Measurement (Inspection);
(6) Milieu/ Mother Nature (Environment).
The original 6Ms used by the Toyota Production System have been expanded by some to include the following and are referred to as the 8Ms. However, this is not globally recognized. It has been suggested to return to the roots of the tools and to keep the teaching simple while recognizing the original intent; most programs do not address the 8Ms.
(7) Management/ Money Power;
(8) Maintenance." [Ishikawa diagram. Wikipedia]
This 8Ms Ishikawa diagram (manufacturing cause and effect diagram) template is included in the Fishbone Diagram solution from the Management area of ConceptDraw Solution Park.
HelpDesk
How to Purchase ConceptDraw Products for Academic/Nonprofit Institutions
CS Odessa offers special academic and non-profit pricing.HelpDesk
How to Add a Concept Map to a PowerPoint Presentation Using ConceptDraw PRO
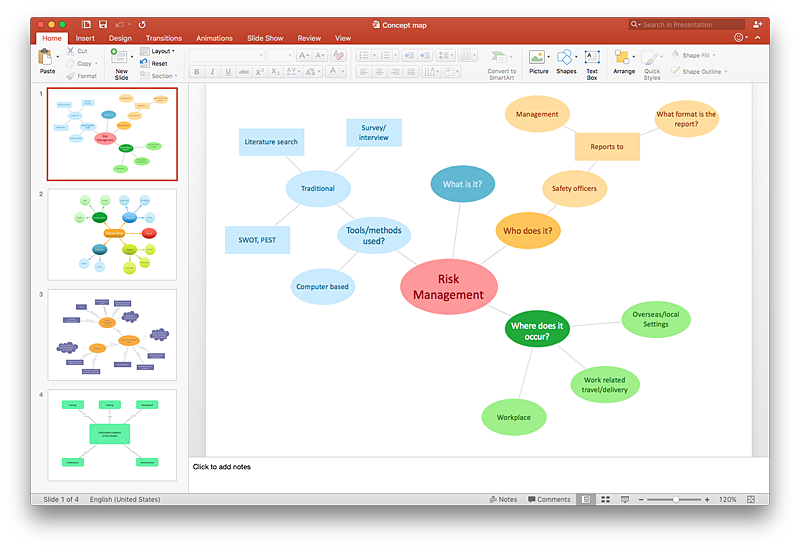
Concept maps visually present the relationships among a set of a logically connected items. ConceptDraw PRO allows you to draw concept maps using the Concept Map solution. The PowerPoint presentation of key concept points can be very informative and helpful.HelpDesk
How to Create a Concept Map in ConceptDraw PRO
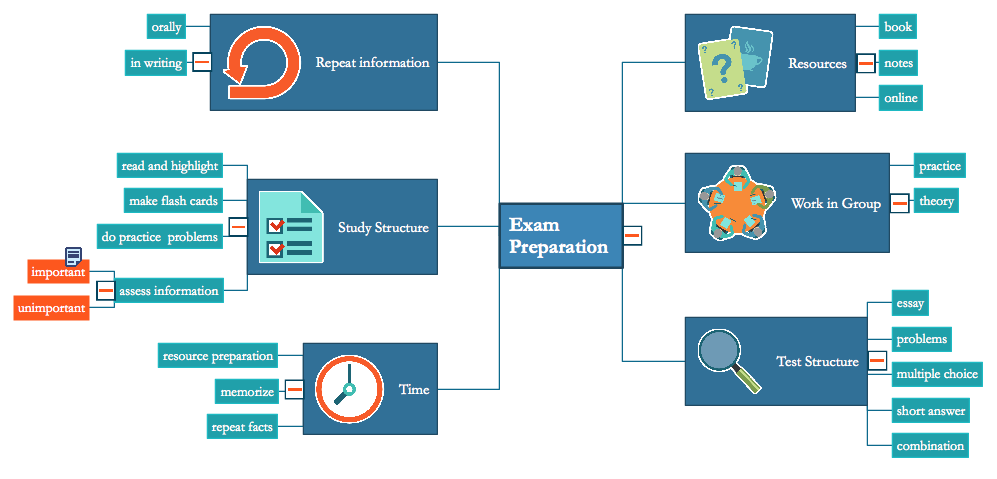
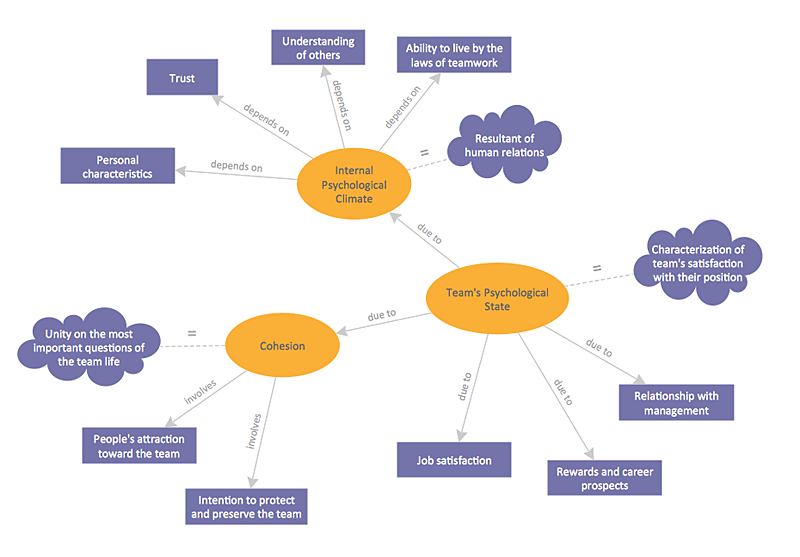
Graphical technique of knowledge representation in a form of structured networks of concepts (ideas) is called concept mapping. Concept network consists of shapes that represent concepts and connectors representing relationships between concepts. The difference between mind maps and concept maps is that a mind map has only one object depicting a main idea , while a concept map may have several. Concept mapping is used to structure ideas, to communicate complex system of knowledge, to help learning process, etc. ConceptDraw PRO allows you to draw concept maps using the Concept Map solution.
 Education
This solution extends ConceptDraw PRO and ConceptDraw MINDMAP with specific content that helps illustrate educational documents, presentations, and websites quickly and easily with astronomy, chemistry, math and physics vector pictures and clip art.
HelpDesk
How to Draw a Divided Bar Chart in ConceptDraw PRO
A divided bar graph is a rectangle divided into smaller rectangles along its length in proportion to the data. Segments in a divided bar represent a set of quantities according to the different proportion of the total amount. A divided bar diagram is created using rectangular bars to depict proportionally the size of each category. The bars in a divided bar graph can be vertical or horizontal. The size of the each rectangle displays the part that each category represents. The value of the exact size of the whole must be known, because the each section of the bar displays a piece of that value. A divided bar diagram is rather similar to a sector diagram in that the bar shows the entire data amount and the bar is divided into several parts to represent the proportional size of each category. ConceptDraw PRO in conjunction with Divided Bar Diagrams solution provides tools to create stylish divided bar charts for your presentations.HelpDesk
How to Make a Basketball Court Diagram
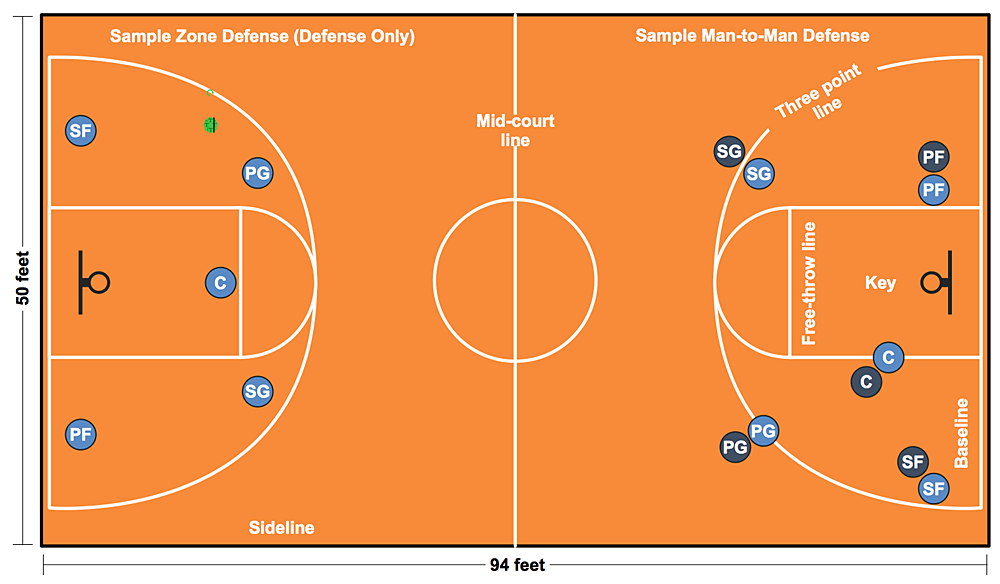
Basketball Court diagrams is often used as a teaching and learning tool for coaches, players and parents to describe the basketball moves and shooting drills. The ability to create Basketball diagrams with ConceptDraw PRO is contained in the Basketball solution. It provides a set of special tools for creating different Basketball diagrams. Basketball court diagram is used to describe basketball moves and shooting drills during the discussion of the match, as well as to develop a winning defense and attack strategy as a clear visual plans for future games.
 Chess
Chess
Chess solution extends ConceptDraw PRO v11 application with samples, special templates and libraries of 2D and 3D elements of chessboards and chess pieces to help display any events on the chessboard, to illustrate the winning positions and chess combinations, to analyze the famous games played by prominent chess masters, to simulate gambits, to teach the audience to play chess and to demonstrate visually the chess rules, to show the variations of moves and ways of setting the checkmate to opponent in a fewest number of steps. Special template ConceptDraw PRO allows to play chess on a local network.
 Seven Basic Tools of Quality
Manage quality control in the workplace, using fishbone diagrams, flowcharts, Pareto charts and histograms, provided by the Seven Basic Tools of Quality solution.
 Concept Maps
The technique of concept mapping was developed as a constructive way of representing knowledge in science and increasing the meaningfulness of learning. Now, the creation of a concept map is extremely helpful when used in education as learning and teaching techniques that assist memorization. Concept maps are also used for idea generation in brainstorming sessions, and for detailing the structure of complex ideas.
 eLearning for Skype
This solution extends ConceptDraw MINDMAP software with the ability to prepare and run remote learning sessions by using Skype
 Venn Diagrams
Venn Diagrams are actively used to illustrate simple set relationships in set theory and probability theory, logic and statistics, mathematics and computer science, linguistics, sociology, and marketing. Venn Diagrams are also often used to visually summarize the status and future viability of a project.
- Manufacturing 8 Ms fishbone diagram - Template | 8ms Of Teaching
- Manufacturing 8 Ms fishbone diagram - Template | 8ms Men Machine
- Manufacturing 8 Ms fishbone diagram - Template | Management ...
- Manufacturing 8 Ms fishbone diagram - Template | Fishbone ...
- 4 Ms fishbone diagram - Production process | Manufacturing 8 Ms ...
- 8ms Of Operations Management
- Manufacturing 8 Ms fishbone diagram - Template
- Manufacturing 8 Ms fishbone diagram - Template | How Do ...
- Manufacturing 8 Ms fishbone diagram - Template | Flow Chart for ...
- Manufacturing 8 Ms fishbone diagram - Template | Fishbone ...
- Manufacturing 8 Ms fishbone diagram - Template | When To Use a ...
- Manufacturing 8 Ms fishbone diagram - Template | 8m Method ...
- Manufacturing 8 Ms fishbone diagram - Template | Manufacturing 8 ...
- Manufacturing 8 Ms fishbone diagram - Template | 4 Ms fishbone ...
- 4 Ms fishbone diagram - Production process | Manufacturing 8 Ms ...
- Manufacturing 8 Ms fishbone diagram - Template | What Are The 8ms
- 4 Ms fishbone diagram - Production process | Manufacturing 8 Ms ...
- Manufacturing 8 Ms fishbone diagram - Template | Total Quality ...
- Manufacturing 8 Ms fishbone diagram - Template | Value-Stream ...
- Manufacturing 8 Ms fishbone diagram - Template | Office Layout ...


