Program Evaluation and Review Technique (PERT) with ConceptDraw DIAGRAM
Program Evaluation and Review Technique (abbr. PERT) is a method developed by Ministry of Defense of the USA in 1958 for the project of creation the missile system Polaris. PERT diagram is one of the tools for project management that lets greatly simplify the planning and scheduling of large and complex projects. PERT diagram provides evaluation of project run-time and labor forces, it helps to analyze the time necessary for execution each of project tasks and the whole project, and to calculate the project critical path. PERT chart depicts the set of tasks connected each other in order of their execution and is constructed according to one of definite rules - AOA (activity on arrow) or AON (activity on node). It doesn't give you ready concrete decisions, but helps to find them. Design easy the PERT diagrams in ConceptDraw DIAGRAM software enhanced with Seven Management and Planning Tools solution from Management area of ConceptDraw Solution Park. You have a possibility to build the PERT chart of any type, but AON variant is easier for building and perception.CORRECTIVE ACTIONS PLANNING. PERT Chart
The PERT Chart is constructed as part of the process in creating a schedule of corrective actions. The PERT Chart shows the logical connections and consequence of tasks to be performed. It displays the time period for problem solving and the implementation of all activities through the critical path. ConceptDraw Office suite is a software for corrective actions planning.
How To Create a Flow Chart in ConceptDraw
ConceptDraw DIAGRAM is a flowchart creating software. This software includes over 20 vector stencils in libraries. These objects allow you to create well-designed flowcharts. Put an initial object from library to a page and use RapidDraw technology clicking on direction arrows to add new objects to the flowchart. This way you can make flowchart quickly.How To Show Project Progress Peport on Web
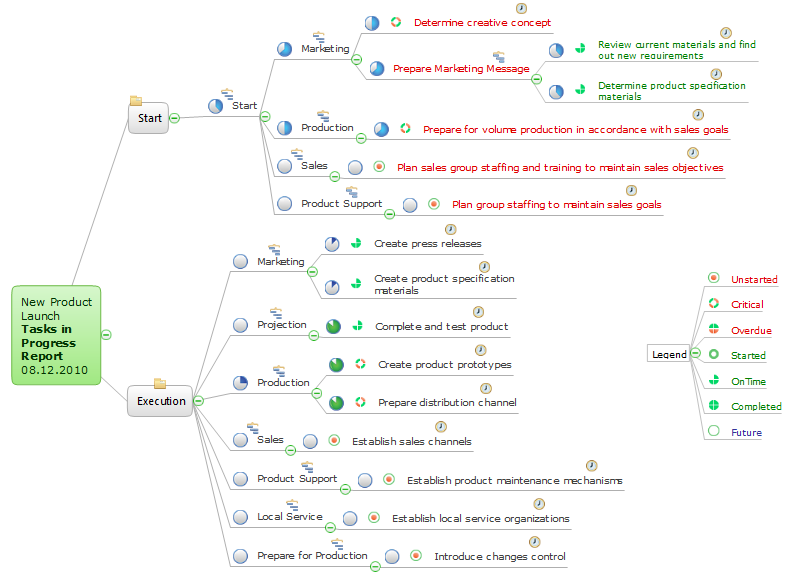
Project progress on web: delivering project status to remote teams and stakeholders via Skype.
Evernote + MindMapping
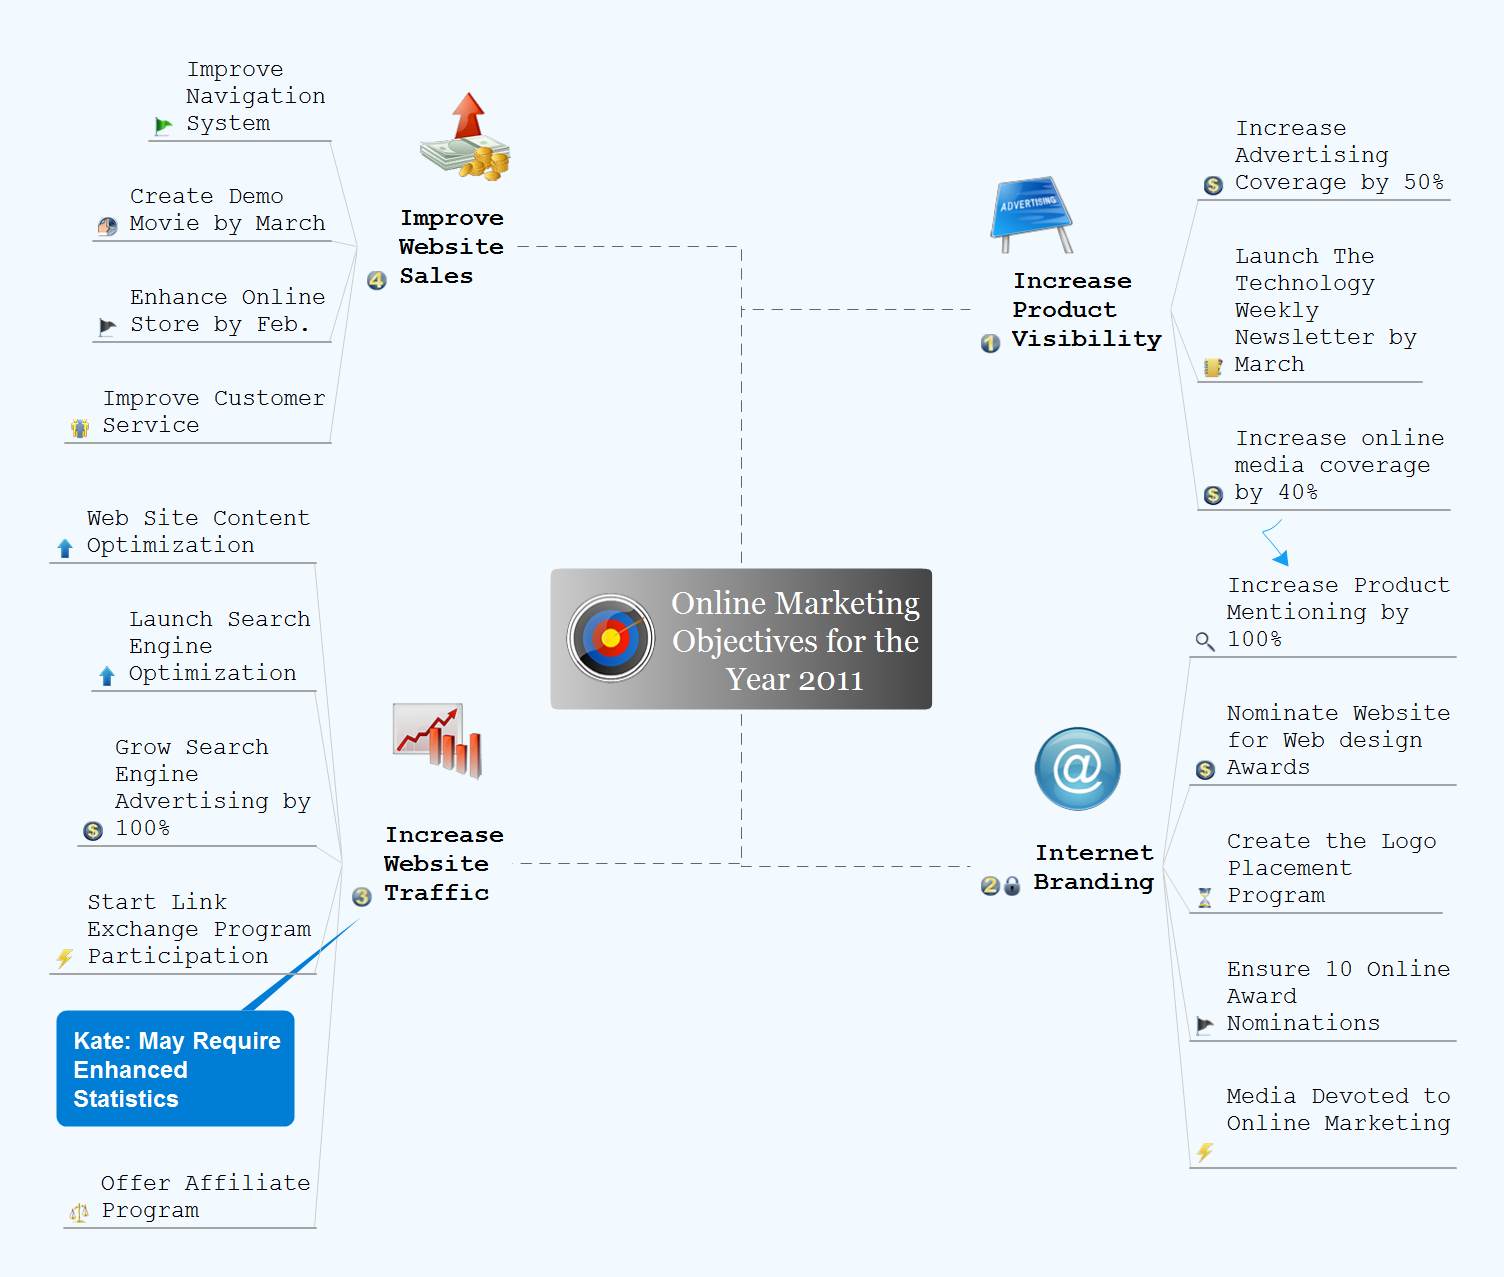
ConceptDraw MINDMAP and Evernote has a multitude of options for users — you can save any part of a mind map: including topics, branches, and entire maps to your Evernote.PERT Chart
The program (or project) evaluation and review technique, commonly abbreviated PERT, is a statistical tool, used in project management, which was designed to analyze and represent the tasks involved in completing a given project. ConceptDraw DIAGRAM diagramming and vector drawing software extended with Seven Management and Planning Tools Solution from the Management Area offers the extensive drawing tools for effective drawing the PERT Chart of any complexity.Network Analysis Activity on Node
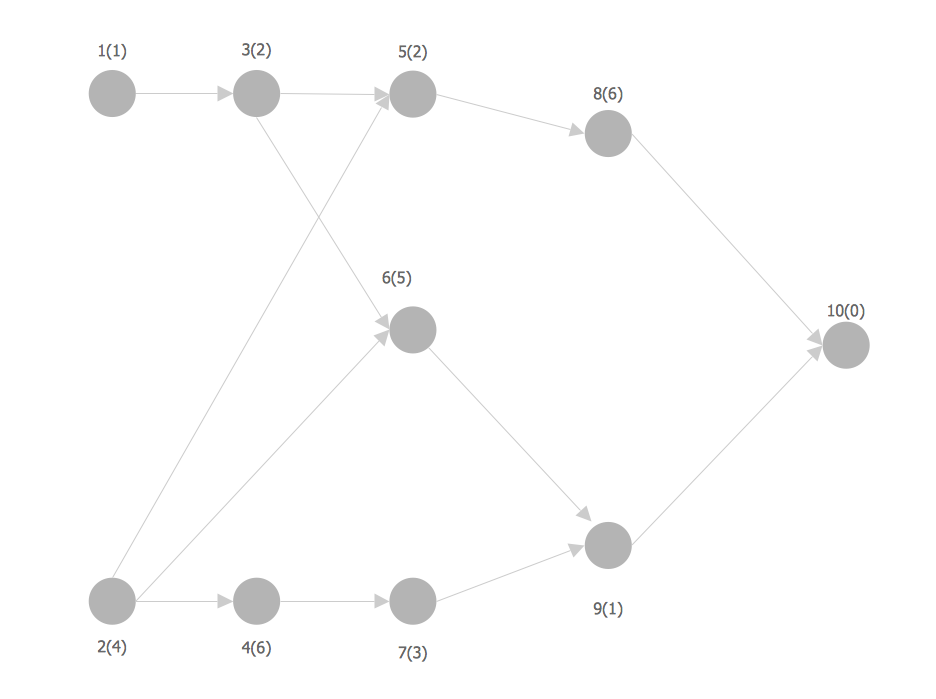
This sample shows the activity on node (AON) network. The social network analysis (SNA) is the analysis of the social networks, it analyzes the social relationships in terms of network theory that uses nodes and ties. The nodes represent the activities and are displayed as circles labeled with the activity number and completion time in brackets. The nodes are sequentially connected, the ties are represented as lines.The PERT chart shows the logical connections and consequence of a set of tasks. PERT charts the time period for problem solving and the implementation plan for all activities along the critical path. The PERT chart is also known as a precedence diagram or project network diagram.
"The Program (or Project) Evaluation and Review Technique, commonly abbreviated PERT, is a statistical tool, used in project management, that is designed to analyze and represent the tasks involved in completing a given project. ...
PERT is a method to analyze the involved tasks in completing a given project, especially the time needed to complete each task, and to identify the minimum time needed to complete the total project.
PERT was developed primarily to simplify the planning and scheduling of large and complex projects. ...
A network diagram can be created by hand or by using diagram software. There are two types of network diagrams, activity on arrow (AOA) and activity on node (AON). Activity on node diagrams are generally easier to create and interpret." [Program Evaluation and Review Technique. Wikipedia]
The PERT chart is one of the Seven Management and Planning Tools (7 MP tools, Seven New Quality Tools).
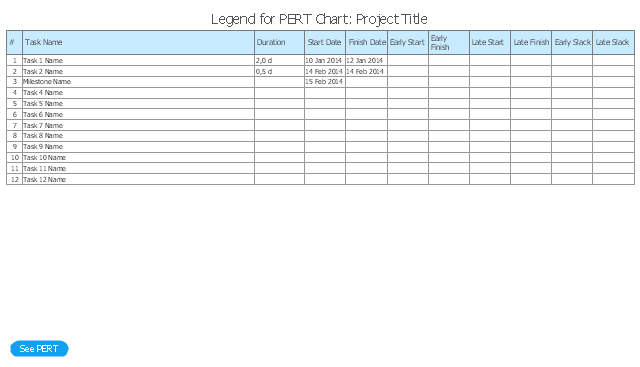
The PERT chart template for the ConceptDraw PRO diagramming and vector drawing software is included in the solution "Seven Management and Planning Tools" from the Management area of ConceptDraw Solution Park.
Quality Management Teams
ConceptDraw MINDMAP with Quality mindmaps solution as a demonstration of the creative approach to quality management in daily work of quality management team.3 Circle Venn Diagram. Venn Diagram Example
This template shows the Venn Diagram. It was created in ConceptDraw DIAGRAM diagramming and vector drawing software using the ready-to-use objects from the Venn Diagrams Solution from the "Diagrams" area of ConceptDraw Solution Park. Venn Diagrams visualize all possible logical intersections between several sets and are widely used in mathematics, logic, statistics, marketing, sociology, etc.Mind Maps at work for Quality Managers
ConceptDraw MINDMAP preserves total quality management and helps bring out the best in your products and services.Program for Making Presentations
ConceptDraw MINDMAP the will guide you in creating and demonstrating powerful mind map presentations.Gantt Chart Software
ConceptDraw PROJECT is a powerful Gantt Chart Software. The Gantt Charts are useful for displaying a large amount of detailed information, project tasks and timelines in a visually pleasing, easy-to-understand format. ConceptDraw PROJECT provides wide capabilities of importing and exporting in various formats: Microsoft Project, ConceptDraw MINDMAP , Mindjet MindManager, PDF file.PERT Chart Software
PERT Chart Software - Activity Network and Project Evaluation and Review Technique, or PERT, charts are a way of documenting and analyzing the tasks in a project. ConceptDraw DIAGRAM is a powerful diagramming and vector drawing software for designing professional looking PERT Charts quick and easy.Plan Presentation
The presentation is a key component of the company's organizational process. It lets to display in a visual form the most important information according to your project and represent it on different conferences, meetings, etc. At this the design style of presentation has an important value, moreover it can vary for different audiences. You can even make the presentation and then simply change its style according to audience and goals you want achieve. This lets to make your presentation the most effective on different stages of a project management process. It is effective to use different diagrams, Mind Maps, Gantt Charts, timelines, reports, calendars, dashboards when making a presentation, they give additional visuality and clearness. The ConceptDraw Office is a powerful business productivity software suite, which includes the comprehensive toolset for designing the best materials for your presentation and helps to make it in one click. Collect easy the information and make quickly the plan presentation using the ConceptDraw Office applications.Building Drawing Software for Design School Layout
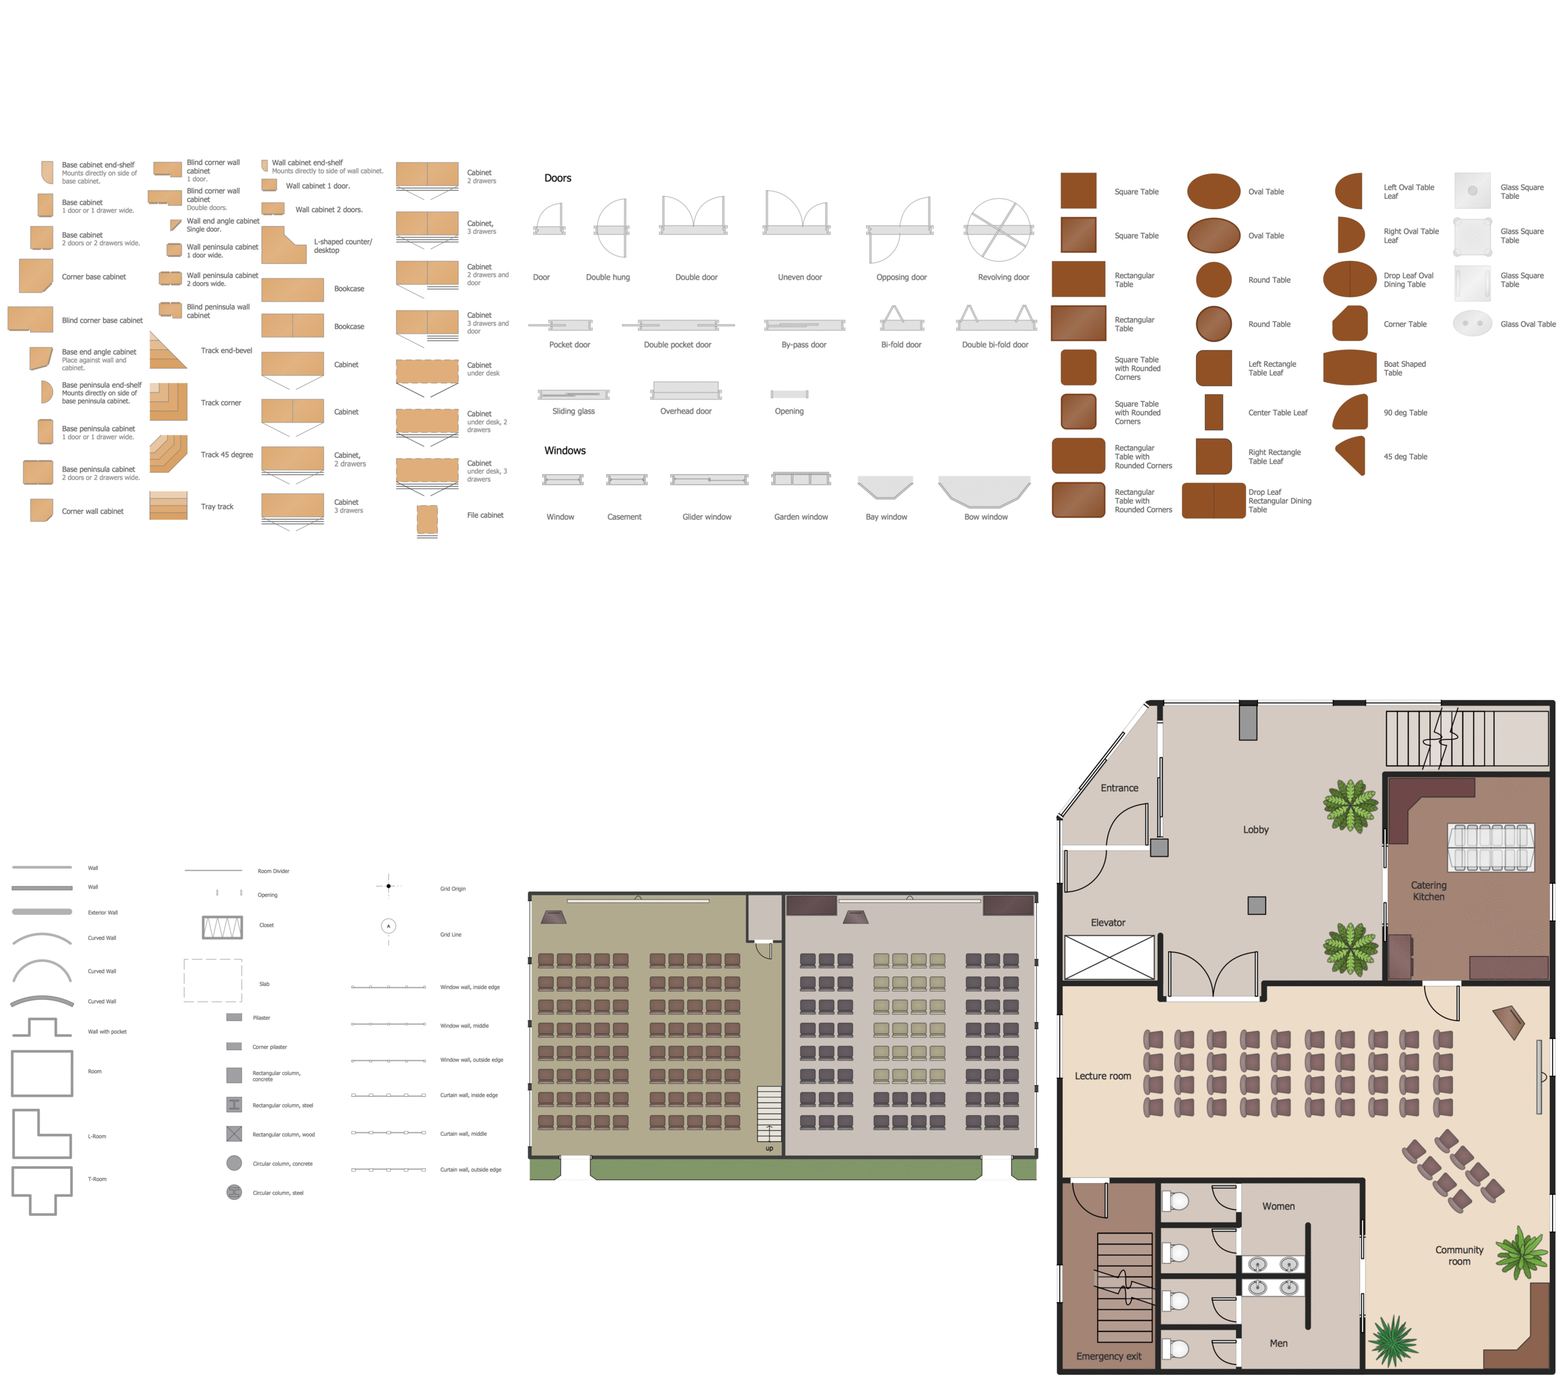
Classroom is the place where the pupils spend most of time, so it must to attract, arouse the interest, to be comfortable that the pupils wanted to go here and to stay longer. The psychologists say that the look of a class greatly affects the children. The first important characteristic is a color, the correct choice of color palette for the training premise helps adjust pupils and students on the right mood, promotes a thinking, activity, creativity and concentration. The most favorable colors are yellow, peach, beige, they attract attention and stimulate mental activity. As for the desks and other furniture, they should to be safe, quality, and to be arranged taking in account the room's size, lighting and age of pupils. For the primary classes are perfectly suited various illustrations on the walls. Use ConceptDraw DIAGRAM building drawing software tools and vector design elements from School and Training Plans solution for development School layouts and floor plans, furniture and equipment plans for School or Training offices, Design plans for classrooms, auditoriums and cabinets.
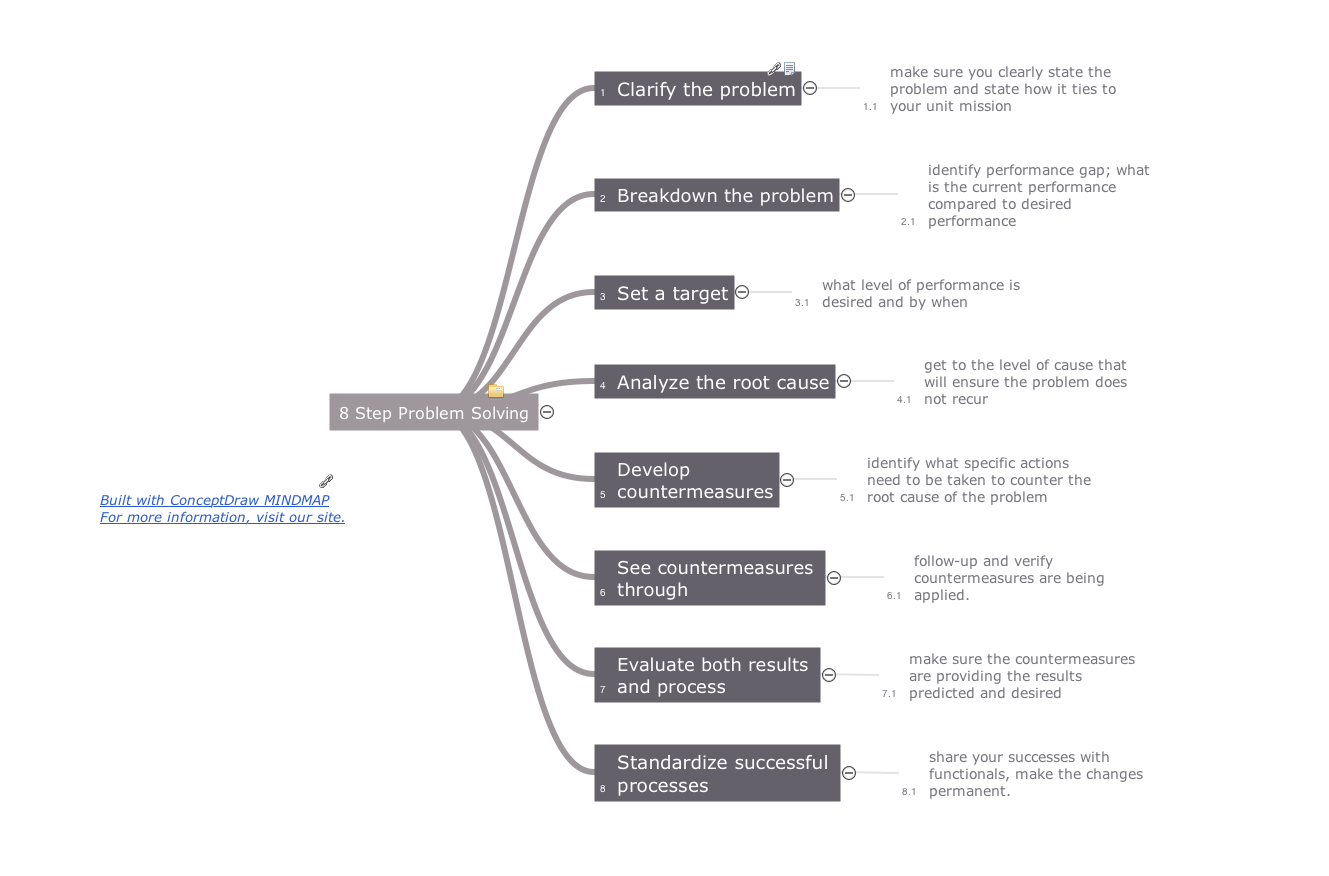
Root Cause Analysis
The Seven Management and Planning Tools is a tool for Root Cause Analysis Tree Diagram drawing. This diagram is for Root Cause Analysis. Analyze the root causes for factors that influenced the problem. This diagram is constructed separately for each highly prioritized factor. The goal of this is to find the root causes for the factor and list possible corrective action.
Optimize a Workflow
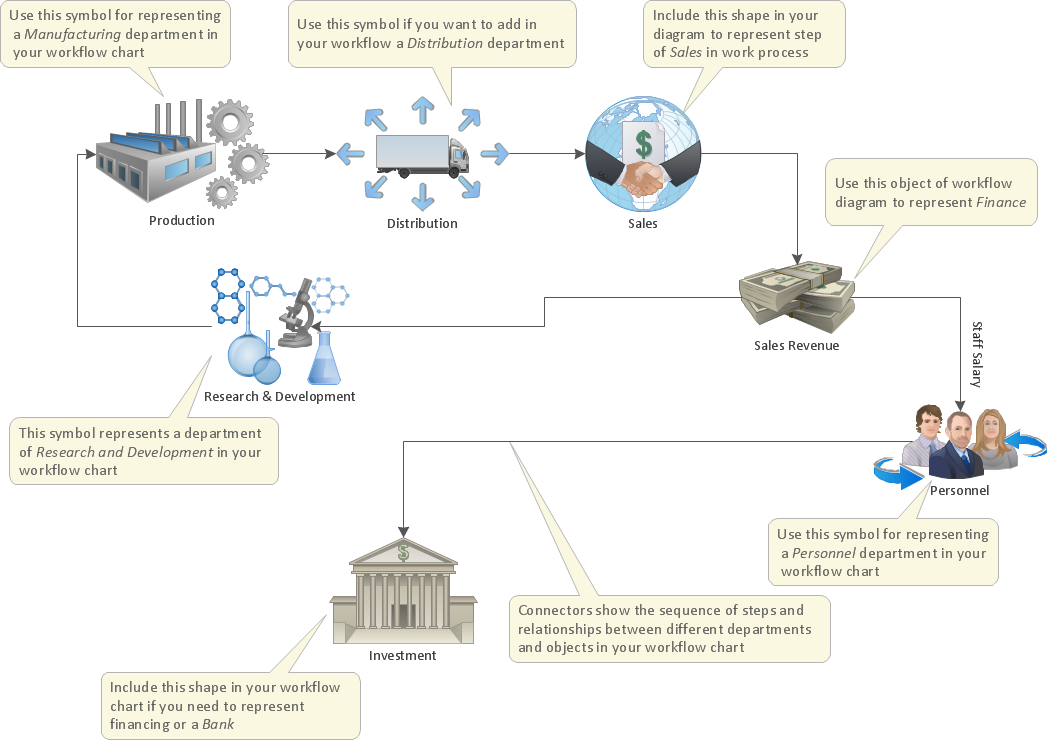
The first step to optimize a workflow is to get its visual depiction. Then you can analyse and optimize the workflow making changes to your workflow diagram. We recommend to use ConceptDraw DIAGRAM software extended with the Workflow Diagram solution to visualize and optimize your workflow. It allows you produce easy-to-change scalable vector graphic workflow and then present it to your team or partners.Tools and Software to Improve Your Workflow
The first step to improve your workflow is to draw it down. When the workflow is visualised you are able to analyse it, to find excess or missing steps or relations. Changing the workflow on paper you can pass as many iterations as needed to get the optimal process, and then start implementing changes to the real process. The best software helps you with workflow is ConceptDraw DIAGRAM software extended with the Workflow Diagram solution. It contains all tools, features, samples and templates you may need during drawing workflow, analysis, and then presenting and implementing your results.Activity Network (PERT) Chart
Activity Network and Project Evaluation and Review Technique, or PERT, charts are a way of documenting and analyzing the tasks in a project. This diagram is constructed as part of the process in creating a schedule of corrective actions. The Activity Network Chart (PERT) shows the logical connections and consequence of tasks to be performed. It displays the time period for problem solving and the implementation of all activities through the critical path.- Program Evaluation and Review Technique (PERT) with ...
- PERT Chart Software | Program Evaluation and Review Technique ...
- Evernote + MindMapping | Program Evaluation and Review ...
- Activity on Node Network Diagramming Tool | Program Evaluation ...
- PERT chart - Template | What Is Project Evaluation And Review ...
- Timeline Diagrams | Program Evaluation and Review Technique ...
- Process Flowchart | Program Evaluation and Review Technique ...
- Data Flow Diagram Symbols. DFD Library | Program Evaluation and ...
- Computer Networking Tools List | Program Evaluation and Review ...
- Project Timeline | Process Flow Chart | Program Evaluation and ...
- Networks And Graphs Program Evaluation And Review Technique
- Critical Path Method in ConceptDraw PROJECT | Program ...
- Landscape Architecture with ConceptDraw DIAGRAM | Program ...
- Gane Sarson Diagram | Data Flow Diagram | Program Evaluation ...
- PERT chart - Template
- How to Discover Critical Path on a Gantt Chart | PERT Chart ...
- Basic Flowchart Symbols and Meaning | Program Evaluation and ...
- Process Flowchart | Types of Flowcharts | Program Evaluation and ...
- Database Design | Program Evaluation and Review Technique ...
- How To Create a PERT Chart | Pert Chart For Restaurant Order


