- Electric and Telecom Plans Free
- Fire and Emergency Plans Free
- Floor Plans Free
- Plant Layout Plans Free
- School and Training Plans Free
- Seating Plans Free
- Security and Access Plans Free
- Site Plans Free
- Sport Field Plans Free
- Business Process Diagrams Free
- Business Process Mapping Free
- Classic Business Process Modeling Free
- Cross-Functional Flowcharts Free
- Event-driven Process Chain Diagrams Free
- IDEF Business Process Diagrams Free
- Logistics Flow Charts Free
- Workflow Diagrams Free
- ConceptDraw Dashboard for Facebook Free
- Mind Map Exchange Free
- MindTweet Free
- Note Exchange Free
- Project Exchange Free
- Social Media Response Free
- Active Directory Diagrams Free
- AWS Architecture Diagrams Free
- Azure Architecture Free
- Cisco Network Diagrams Free
- Cisco Networking Free
- Cloud Computing Diagrams Free
- Computer Network Diagrams Free
- Google Cloud Platform Free
- Interactive Voice Response Diagrams Free
- Network Layout Floor Plans Free
- Network Security Diagrams Free
- Rack Diagrams Free
- Telecommunication Network Diagrams Free
- Vehicular Networking Free
- Wireless Networks Free
- Comparison Dashboard Free
- Composition Dashboard Free
- Correlation Dashboard Free
- Frequency Distribution Dashboard Free
- Meter Dashboard Free
- Spatial Dashboard Free
- Status Dashboard Free
- Time Series Dashboard Free
- Basic Circle-Spoke Diagrams Free
- Basic Circular Arrows Diagrams Free
- Basic Venn Diagrams Free
- Block Diagrams Free
- Concept Maps Free
- Family Tree Free
- Flowcharts Free
- Basic Area Charts Free
- Basic Bar Graphs Free
- Basic Divided Bar Diagrams Free
- Basic Histograms Free
- Basic Line Graphs Free
- Basic Picture Graphs Free
- Basic Pie Charts Free
- Basic Scatter Diagrams Free
- Aerospace and Transport Free
- Artwork Free
- Audio, Video, Media Free
- Business and Finance Free
- Computers and Communications Free
- Holiday Free
- Manufacturing and Maintenance Free
- Nature Free
- People Free
- Presentation Clipart Free
- Safety and Security Free
- Analog Electronics Free
- Audio and Video Connectors Free
- Basic Circuit Diagrams Free
- Chemical and Process Engineering Free
- Digital Electronics Free
- Electrical Engineering Free
- Electron Tube Circuits Free
- Electronic Block Diagrams Free
- Fault Tree Analysis Diagrams Free
- GHS Hazard Pictograms Free
- Home Automation and Wiring Free
- Mechanical Engineering Free
- One-line Diagrams Free
- Power Сircuits Free
- Specification and Description Language (SDL) Free
- Telecom and AV Circuits Free
- Transport Hazard Pictograms Free
- Data-driven Infographics Free
- Pictorial Infographics Free
- Spatial Infographics Free
- Typography Infographics Free
- Calendars Free
- Decision Making Free
- Enterprise Architecture Diagrams Free
- Fishbone Diagrams Free
- Organizational Charts Free
- Plan-Do-Check-Act (PDCA) Free
- Seven Management and Planning Tools Free
- SWOT and TOWS Matrix Diagrams Free
- Timeline Diagrams Free
- Australia Map Free
- Continent Maps Free
- Directional Maps Free
- Germany Map Free
- Metro Map Free
- UK Map Free
- USA Maps Free
- Customer Journey Mapping Free
- Marketing Diagrams Free
- Matrices Free
- Pyramid Diagrams Free
- Sales Dashboard Free
- Sales Flowcharts Free
- Target and Circular Diagrams Free
- Cash Flow Reports Free
- Current Activities Reports Free
- Custom Excel Report Free
- Knowledge Reports Free
- MINDMAP Reports Free
- Overview Reports Free
- PM Agile Free
- PM Dashboards Free
- PM Docs Free
- PM Easy Free
- PM Meetings Free
- PM Planning Free
- PM Presentations Free
- PM Response Free
- Resource Usage Reports Free
- Visual Reports Free
- House of Quality Free
- Quality Mind Map Free
- Total Quality Management TQM Diagrams Free
- Value Stream Mapping Free
- Astronomy Free
- Biology Free
- Chemistry Free
- Language Learning Free
- Mathematics Free
- Physics Free
- Piano Sheet Music Free
- Android User Interface Free
- Class Hierarchy Tree Free
- Data Flow Diagrams (DFD) Free
- DOM Tree Free
- Entity-Relationship Diagram (ERD) Free
- EXPRESS-G data Modeling Diagram Free
- IDEF0 Diagrams Free
- iPhone User Interface Free
- Jackson Structured Programming (JSP) Diagrams Free
- macOS User Interface Free
- Object-Role Modeling (ORM) Diagrams Free
- Rapid UML Free
- SYSML Free
- Website Wireframe Free
- Windows 10 User Interface Free
Seven Management and Planning Tools
The Seven Management and Planning Tools have their roots in the so-called “Operations Research work”. The seven tools are Tree, Affinity, Interrelationship, Matrix and Activity Network diagrams as well as the Prioritization Matrix and the Process Decision Program Chart.
Tree Diagram is usually used for breaking down different categories into more details, mapping such levels of tasks in order to accomplish a task.
Affinity diagrams are known to be a “brainstorming tool” that helps to organize large amounts of some badly organized or disorganized data into groups that can be based on natural relationships. It can be used when there are too many confronting facts in apparent chaos or when the issues are too complex to grasp.
All the interrelated cause-and-effect linkage, as well as other factors which also can be involved in a complex problem, are presented in the Interrelationship Diagram, describing the desired outcomes. The process of creating an interrelationship diagram may help a group to analyze the natural links between different aspects of some complex situation.
Matrix Diagram can be also known as a “quality table”. This tool is known to show the relationship between two or more than two sets of elements, providing relationship information.
Activity Network Diagram can be used for planning some appropriate schedule for some tasks and their subtasks. When subtasks must occur in parallel, this is when this diagram can be used. Using this particular tool helps to sequentially organize, manage the previously defined complex set of activities.
Prioritization Matrix can be used for prioritizing items as well as describing them in terms of weighted criteria. It uses a combination of both matrix and tree diagramming techniques for doing a so-called “pair-wise” evaluation of items.
Process Decision Program Chart is used for extending the tree diagram to be able to identify countermeasures and risks for the bottom level tasks.
The Seven Management and Planning Tools solution can be used as an extension to the ConceptDraw DIAGRAM software enabling to create Affinity Diagrams, Relations Diagrams, Prioritization Matrices, Root Cause Analysis Tree Diagrams, Involvement Matrices, PERT Charts and Risk Diagrams.
The Seven Management and Planning Tools solution can be used by many business specialists, including managers and project coordinators.
-
Install this solution Free -
What I need to get started -
Solution Requirements - This solution requires the following products to be installed:
ConceptDraw DIAGRAM v18 ConceptDraw MINDMAP v16 - This solution requires the following products to be installed:
-
Compatibility - Sonoma (14), Sonoma (15)
MS Windows 10, 11 - Sonoma (14), Sonoma (15)
-
Support for this Solution -
Helpdesk
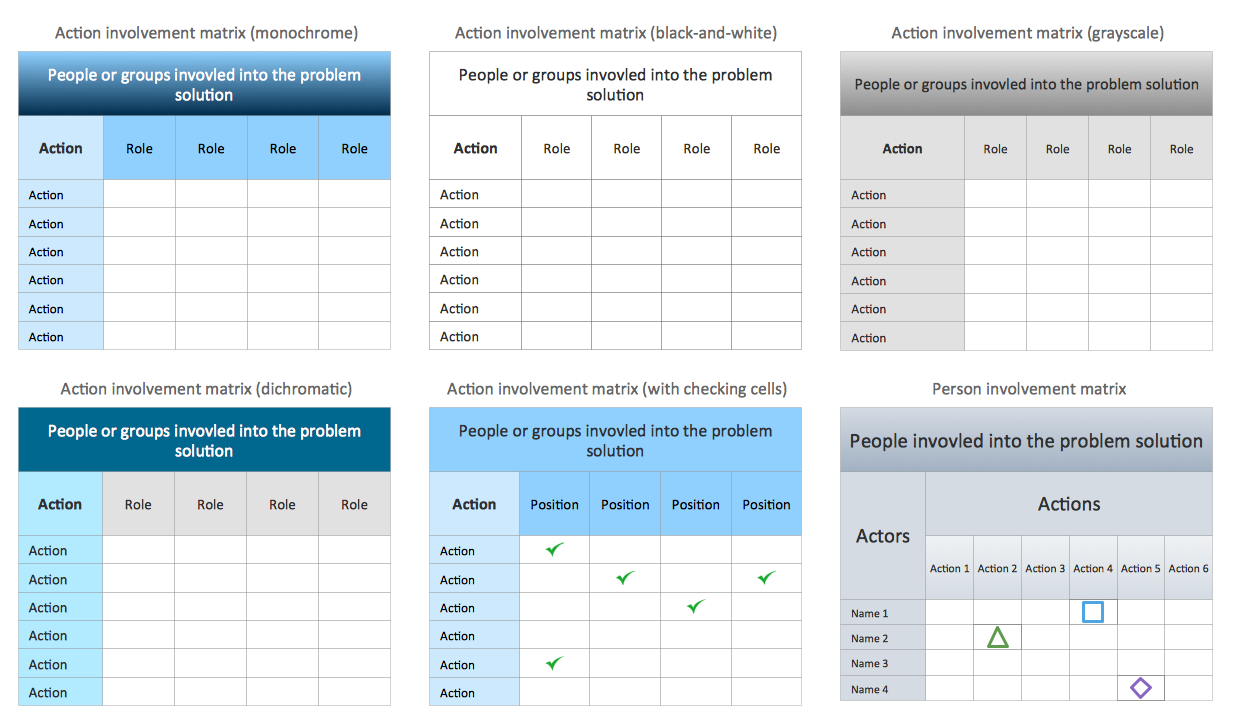
Design Elements — Involvement Matrix
One stencils library, 20 vector shapes.
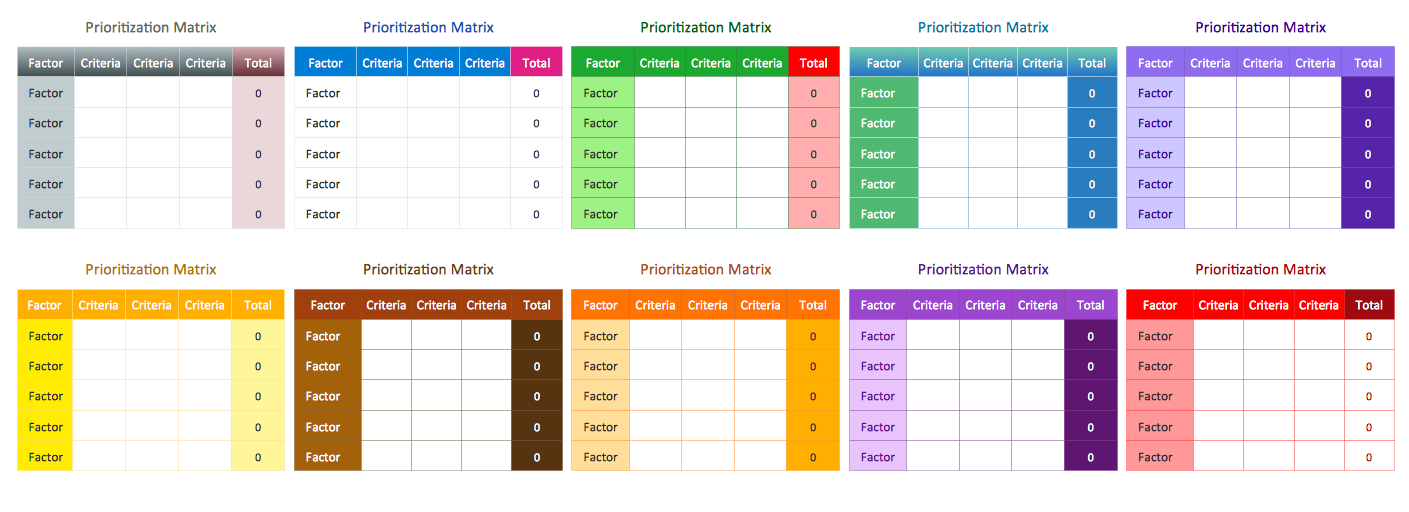
Design Elements — Prioritization Matrix
One stencils library, 10 vector shapes.
Examples
There are a few samples that you see on this page which were created in the ConceptDraw DIAGRAM application by using the Seven Management and Planning Tools solution. Some of the solution's capabilities as well as the professional results which you can achieve are all demonstrated here on this page.
All source documents are vector graphic documents which are always available for modifying, reviewing and/or converting to many different formats, such as MS PowerPoint, PDF file, MS Visio, and many other graphic ones from the ConceptDraw Solution Park or ConceptDraw STORE. The Seven Management and Planning Tools solution is available to all ConceptDraw DIAGRAM users to get installed and used while working in the ConceptDraw DIAGRAM charting and drawing software.
Example1: Affinity Diagram — Implementing Continuous Process Improvement
This diagram was created in ConceptDraw DIAGRAM using the Affinity Diagrams Objects Library from the Seven Management and Planning Tools Solution. An experienced user spent 15 minutes creating this sample.
This sample presents the Affinity Diagram that offers a brief overview of some potential sales problems. It is an overview of issues in implementing continuous process improvement that leads to the company's success, its effectiveness and efficiency increasing. The seven tools included to the Seven Management and Planning Tools solution are closely related and assist the user in problem-solving and analysis. A continuous improvement process (CIP) implies the set of efforts to improve processes, products, or services. These efforts can be gradual or have a character of a sudden jump. Typically the continuous improvement is considered as a not only gradual but never-ending change. The continual improvement relates to all business processes within a company, the business strategy and business results, relationships with employees, customers, and suppliers. All issues are visually divided into five groups: lack of TQM knowledge, lack of planning, organizational issues, breaking through old way “Dinosaur” thinking, and old management culture.

Example 2: Relations Diagram — Health Care
This diagram was created in ConceptDraw DIAGRAM using the Relations Diagrams Objects Library from the Seven Management and Planning Tools Solution. An experienced user spent 10 minutes creating this sample.
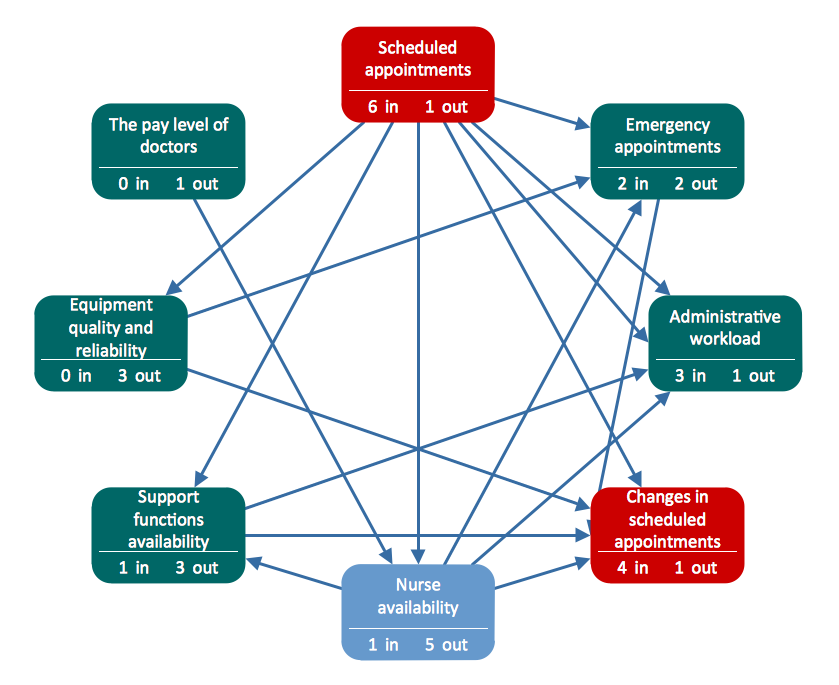
This sample visualizes a Relations Diagram, which depicts the factors associated with reduced productivity among doctors in the hospital and the causal relationships between them. There are many key factors influencing the productivity, the most significant are presented here, among them the doctors' payment level, scheduled appointments, emergency appointments, administrative workload, equipment quality and reliability, support functions availability, nurse availability, and changes in scheduled appointments. This diagram visually presents the full depth of the problem and shows an example of how the outlined problems relate to each other in the field of medicine and health care. The reduced productivity among doctors in the hospital is identified with relationship analysis. The Relations diagram allows determining what factors are causes and what are effects. Identification of key factors and the use of KPIs assist in monitoring changes and efficiency of the applied corrective actions used to solve specific problems.

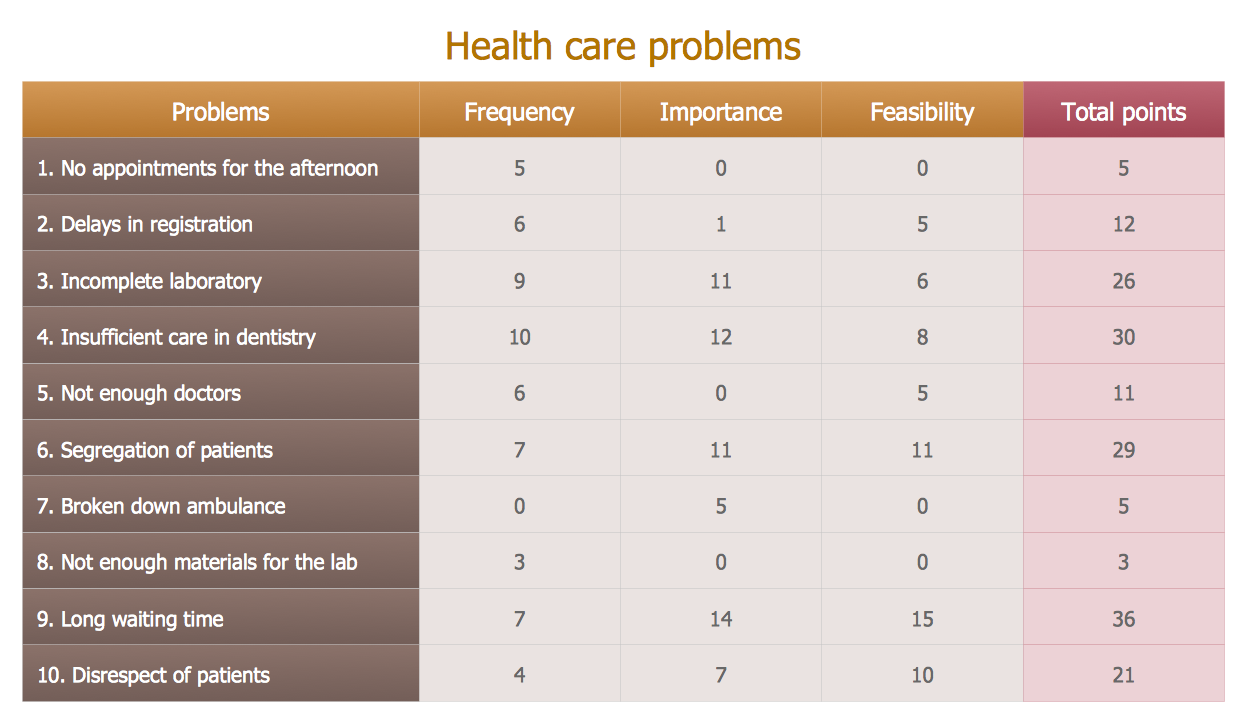
Example 3: Prioritization Matrix — Health Care Problems
This diagram was created in ConceptDraw DIAGRAM using the Prioritization Matrix Objects Library from the Seven Management and Planning Tools Solution. An experienced user spent 10 minutes creating this sample.
This diagram is dedicated to health care problems. It is a sector, the workers of which do a lot for people, but like any other it has some problems. No matter which field you consider, the detailed description and listing all problems at once can help observe them all, catch ones the most important, gradually eliminate them and find solution. Once you’ve identified the problems, it is recommended to order them with respect to importance, frequency, and feasibility, as well as to count the totals. You can observe the list of ten key health care problems in a diagram. This Prioritization Matrix allows you to turn the theory into quantitative data, therefore qualitative metrics are presented for the following problems: no appointments at the afternoon, delays in registration, incomplete laboratory, insufficient dental care, lack of doctors, segregation of patients, broken ambulance, shortage of materials for the laboratory, long waiting times, disrespect for patients.
Example 4: Root Cause Analysis Tree Diagram — Personal Problem Solution
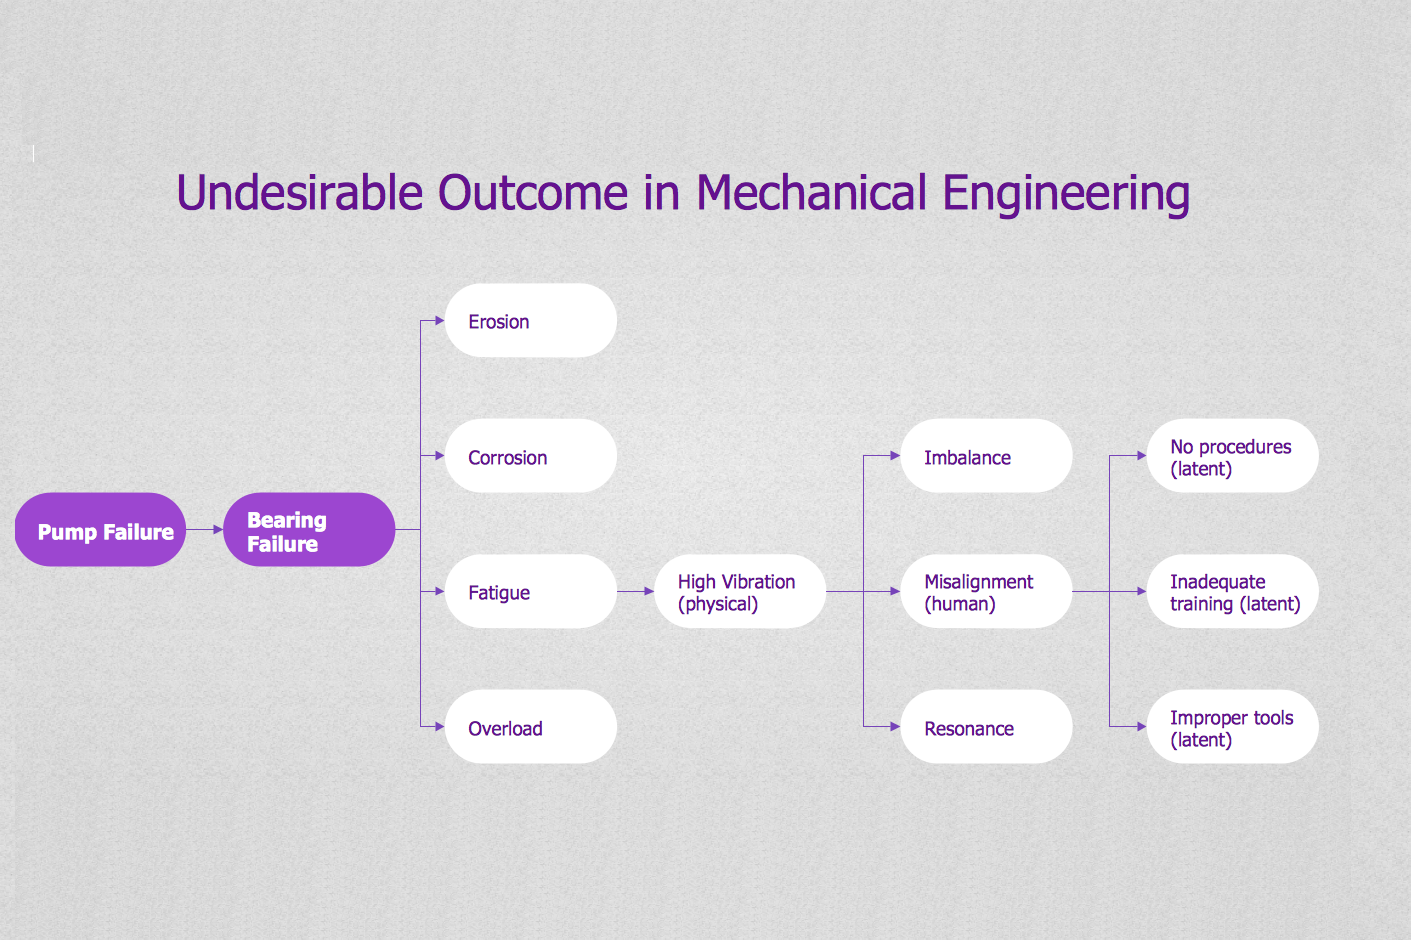
This diagram was created in ConceptDraw DIAGRAM using the Root Cause Analysis Tree Diagram Library from the Seven Management and Planning Tools Solution. An experienced user spent 10 minutes creating this sample.
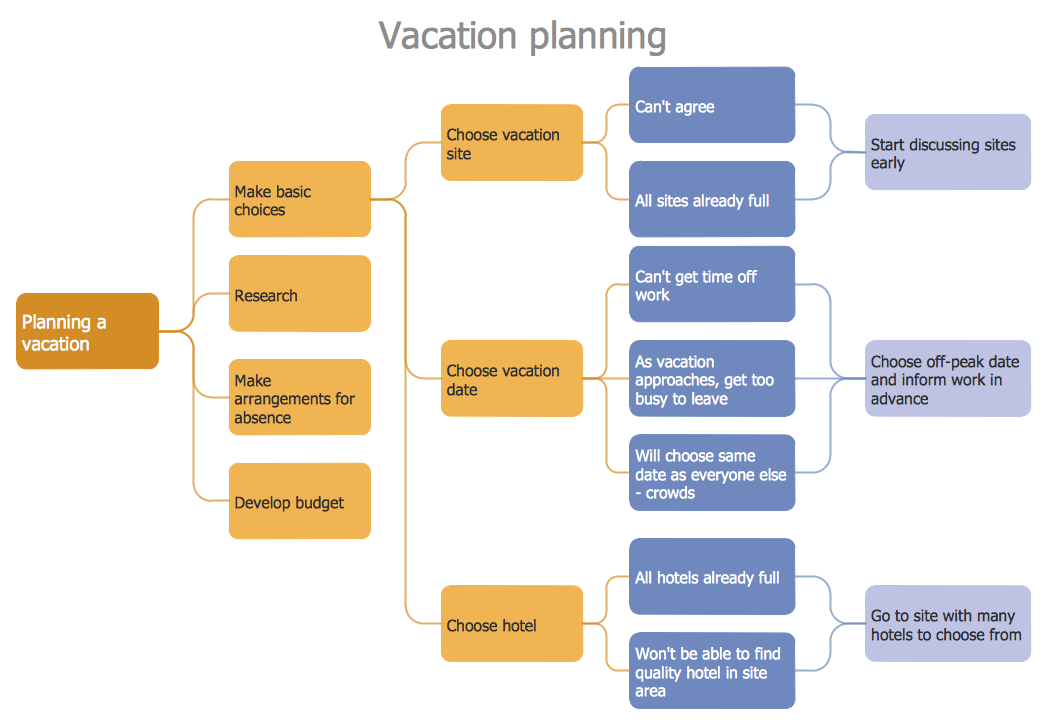
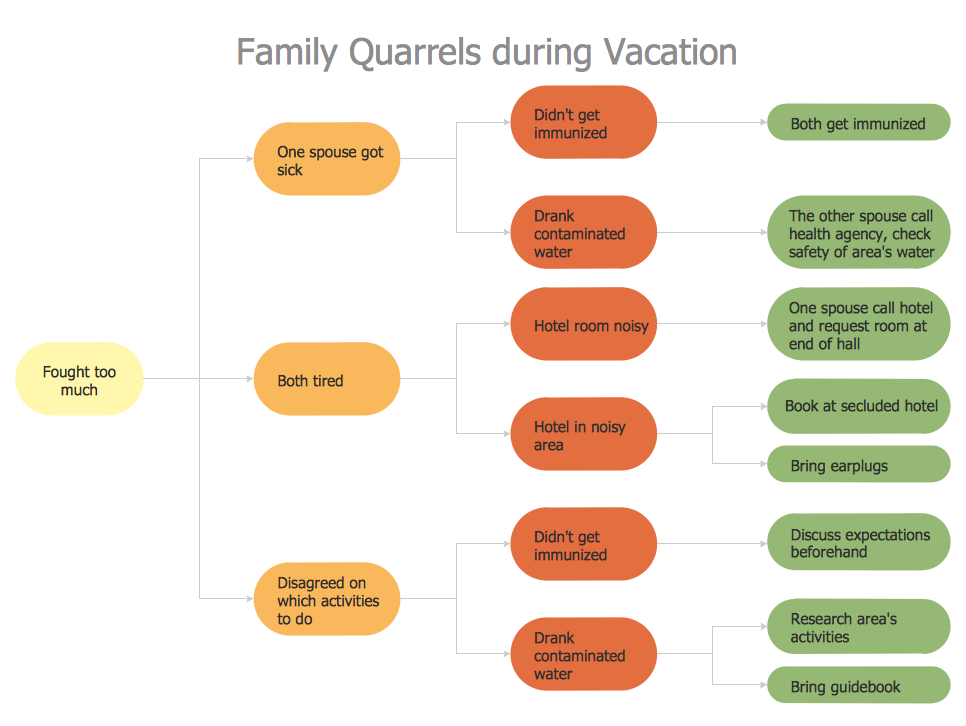
This sample demonstrates a Root Cause Analysis Tree Diagram made for the solution of a personal problem that may occur during vacations. Family quarrel as a possible problem was considered. Among the main reasons for this are the following: one of the spouses got sick, both were tired, or they did not agree on what to do. The root causes for each one are also listed, they can be external or caused by the hotel. Thus, the noise in the hotel can cause insomnia and tiring as a result, the absence of immunizing or contaminated water can cause serious health problems and spoil the rest. With a root cause being identified, you can try to detect any possible cause and solution that will address this problem. Problems and solutions are displayed side by side to help with analysis, making correct conclusions, finding a solution, and preventing the situation’s repeat.
Example 5: Involvement Matrix — Sales
This diagram was created in ConceptDraw DIAGRAM using the Involvement Matrix Objects Library from the Seven Management and Planning Tools Solution. An experienced user spent 20 minutes creating this sample.
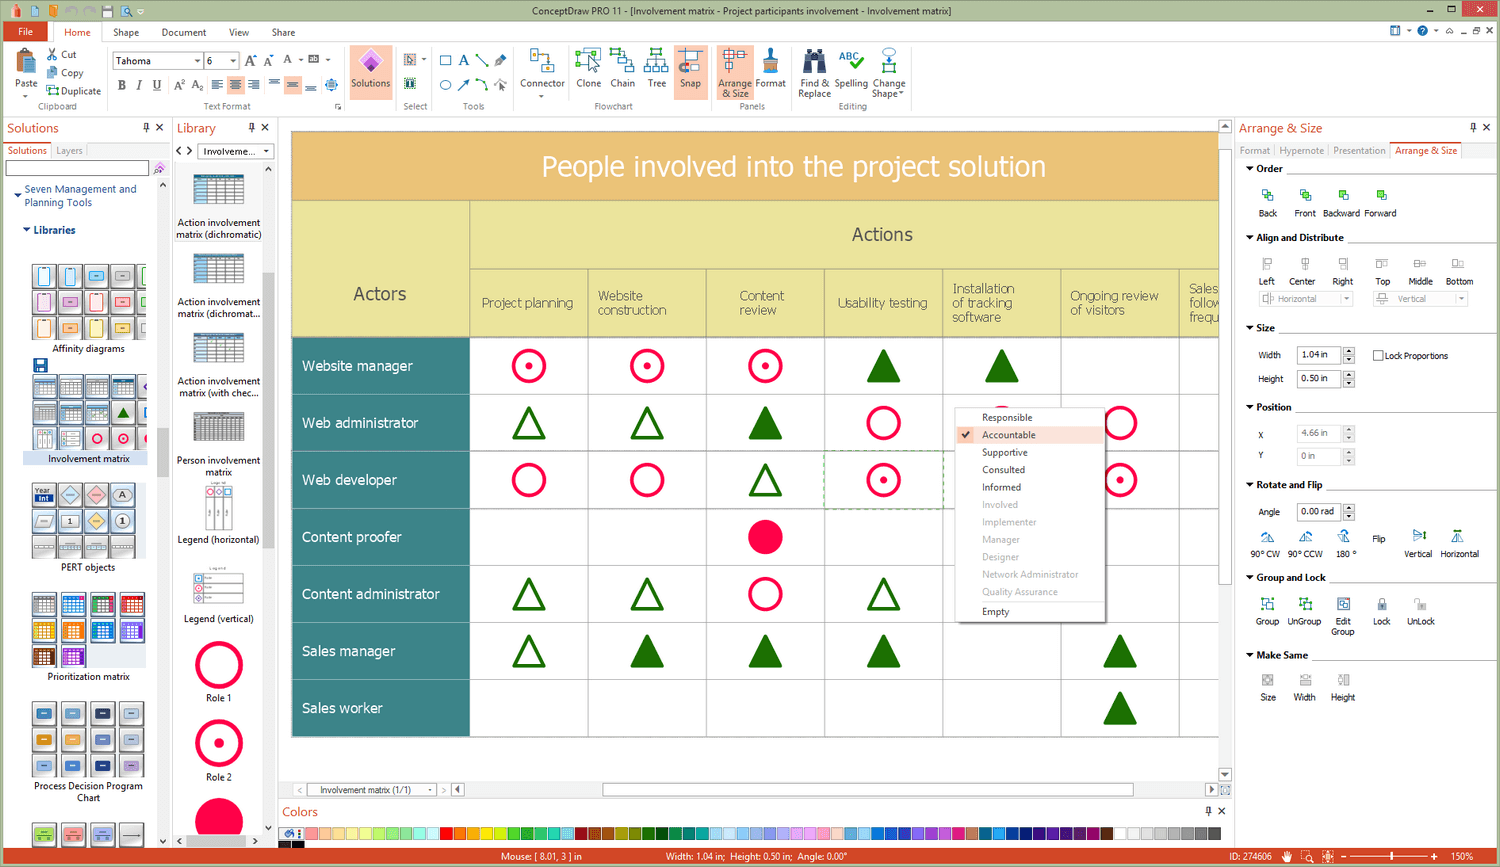
Now, when you have a full list of solution processes, you need to assign resources so actions are carried out correctly and efficiently. The Involvement Matrix allows you to turn a potentially complicated process into an easily digestible chart. It is effective when discussing a problem and finding a solution, allows detecting which stage of problem-solving is currently realized. The offered matrix is dedicated to sales and presents information according to people and depts involved into the sale problem solution. The Involvement Matrix allows depicting all parties involved in a process, define their level of involvement, and the nature of their participation, identify roles in a group of people or team, depict the distribution of responsibilities, realize the highly prioritized corrective actions previously defining participants involved in them. It also helps to detect at what stage the problem is now, and what actions and efforts are being made to solve it.

Example 6: PERT Chart — Sales
This diagram was created in ConceptDraw DIAGRAM using the PERT Objects Library from the Seven Management and Planning Tools Solution. An experienced user spent 15 minutes creating this sample.
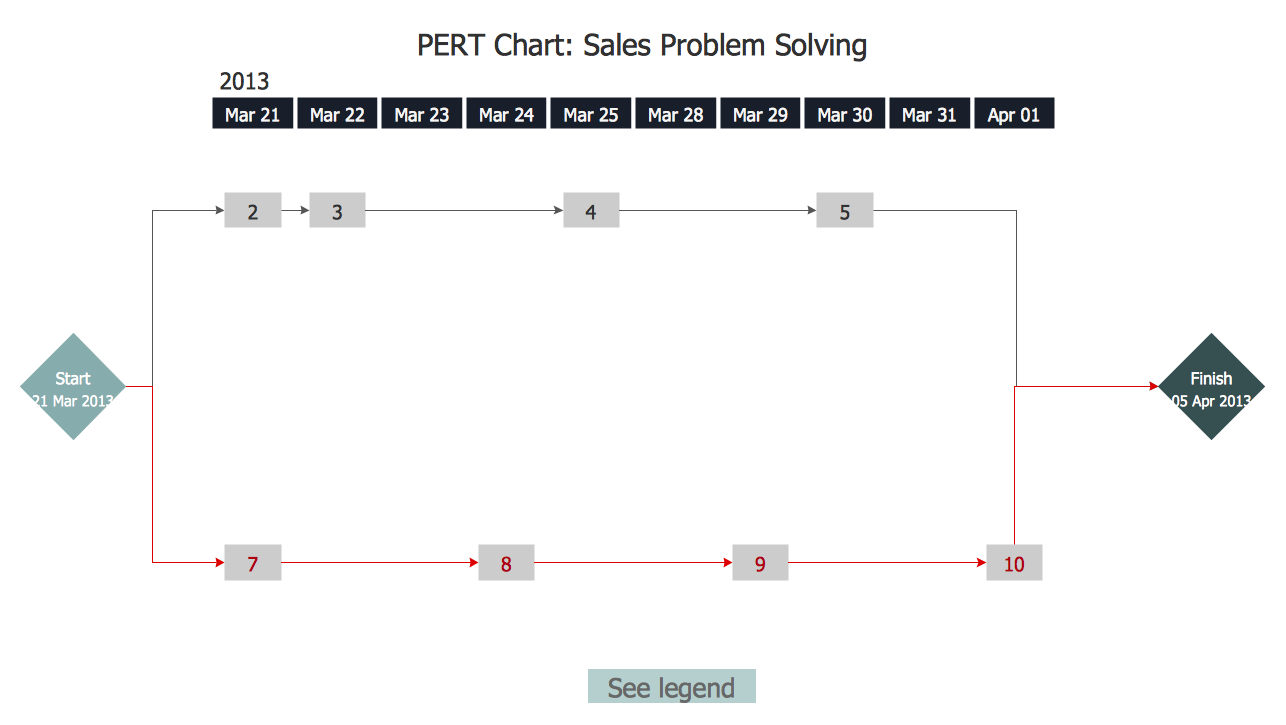
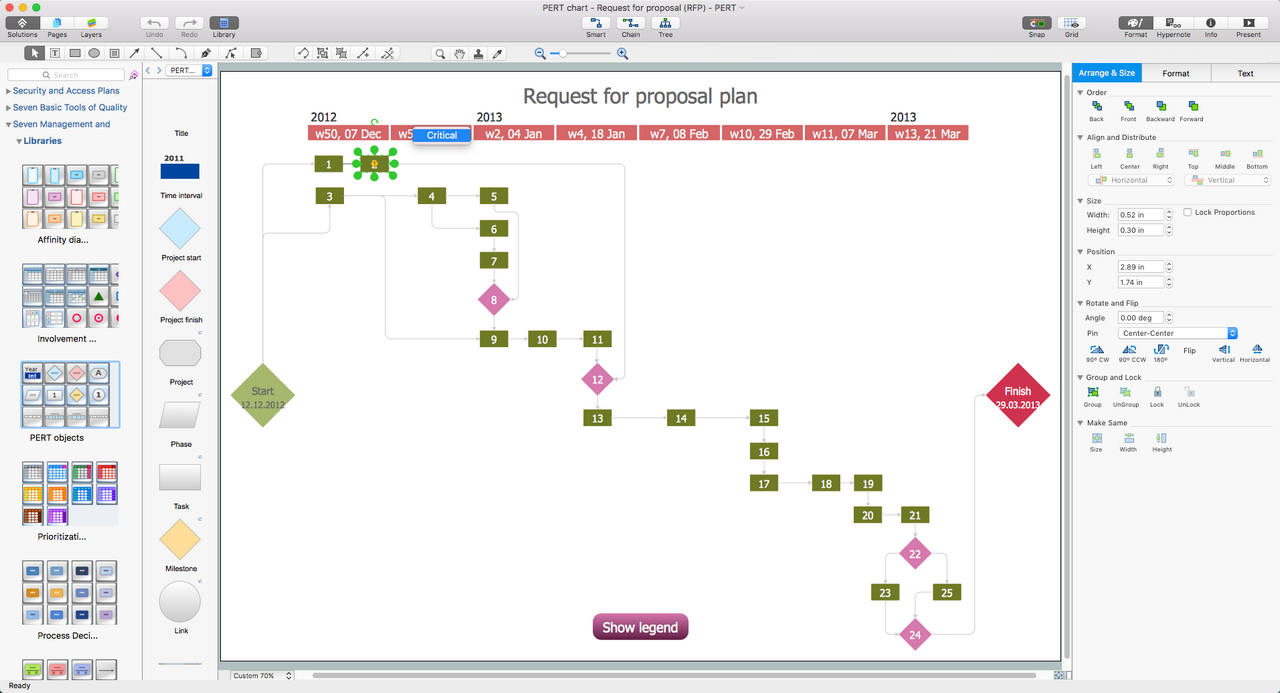
This sample diagram shows a project management plan in a PERT (Program Evaluation and Review Technique) chart view. It gives you a timeline of the entire process and is designed to solve sales problems. The two-week period in which the project needs to be started and completed is depicted. The critical path is highlighted in red, so anyone can catch it from a glance. PERT chart is a useful project management tool allowing scheduling, organizing, and coordinating tasks within a project. It is a visual way to analyze the project objectives, determine the time required to complete each of them and the entire project. It allows organizing the complex projects, depicting dependencies between the steps, helps to find the critical path — the longest path to project’s completion, and speed up completion by identifying the overlapping tasks. The legend can be shown or hidden as you like.
Example 7: Risk Diagram — Health Care
This diagram was created in ConceptDraw DIAGRAM using the PDPC Objects Library from the Seven Management and Planning Tools Solution. An experienced user spent 20 minutes creating this sample.
This sample is dedicated to the health care and Chronic illness management program (CIMP). It demonstrates the overall Risk Diagram created using all the information gathered from previous diagrams and tools. Together, these solutions will help you identify and solve any problems that may arise in your business! The risks are probable events in the result of which the negative events and adverse consequences may occur. Striving to avoid unfavorable results and minimize potential losses the risk management and Risk Diagrams are widely used by the companies. ConceptDraw users have the ability to effectively manage their business, easily identify possible risks, analyze each action separately in the tree of all actions, develop preventive actions and corrective actions that must be performed in response to every potential obstacle or circumstance that may be a risk. The creation of professional-looking Risk diagrams is easy with Seven Management and Planning Tools solution, which also supports their construction from Mind Maps.

Example 8: Affinity Diagram
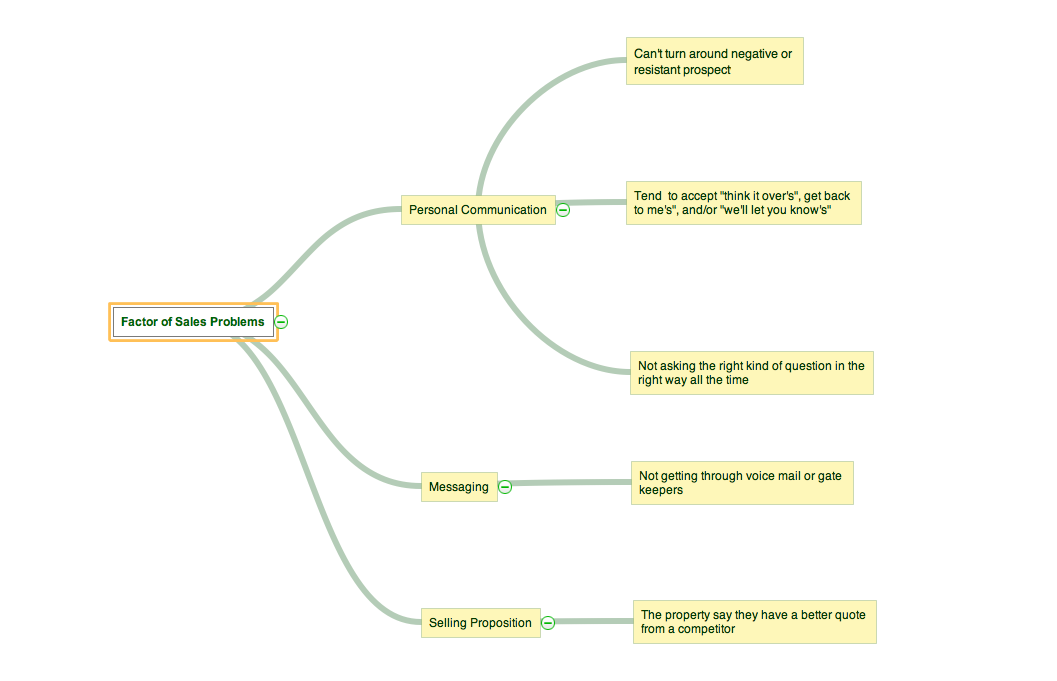
This Mind Map sample is dedicated to the research of factors of the sales problems. This diagram perfectly structures the factors influencing the sales problems, divides them into groups, and shows in a visual and clear structure. Only factors are presented on this map, without an illustration of cause-effect relationships between them. The strict structure makes this diagram an ideal basis for further marking the relationships and making analysis of the cause-effect relationships based on these already prepared data. You can see three main groups: personal communication, messaging and setting preposition. Even large and complex factors can be easily structured in this way. Besides, the ConceptDraw MINDMAP's Brainstorming mode can effectively help you in generating the list of the factors affecting the problem, collecting them and structuring in map. ConceptDraw MINDMAP allows exporting this map to ConceptDraw DIAGRAM and generating Affinity Diagram from it literally in one motion.
Example 9: Relations Diagram
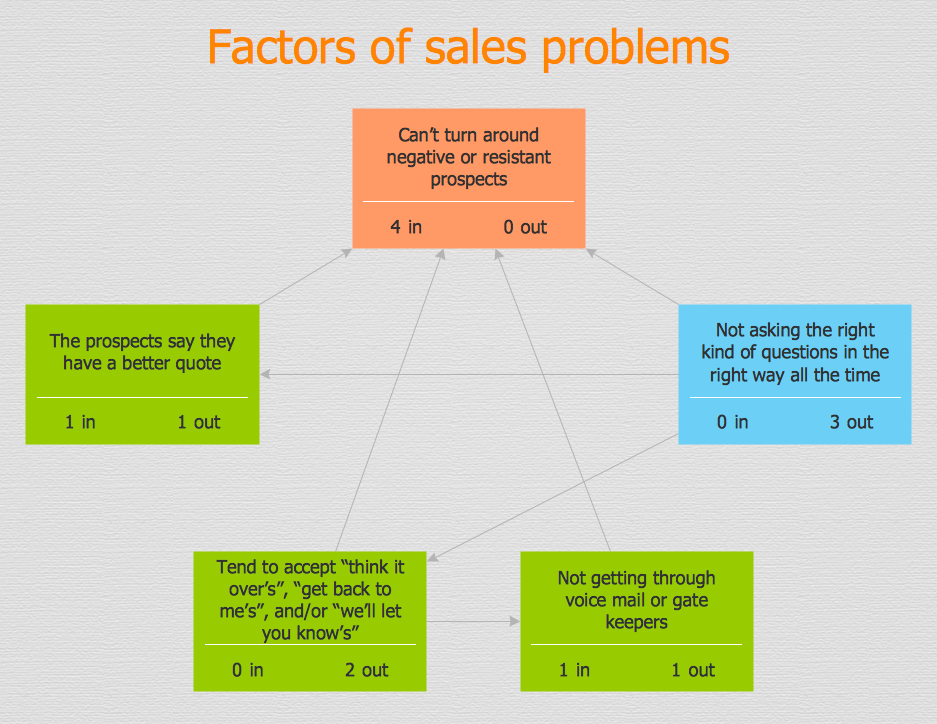
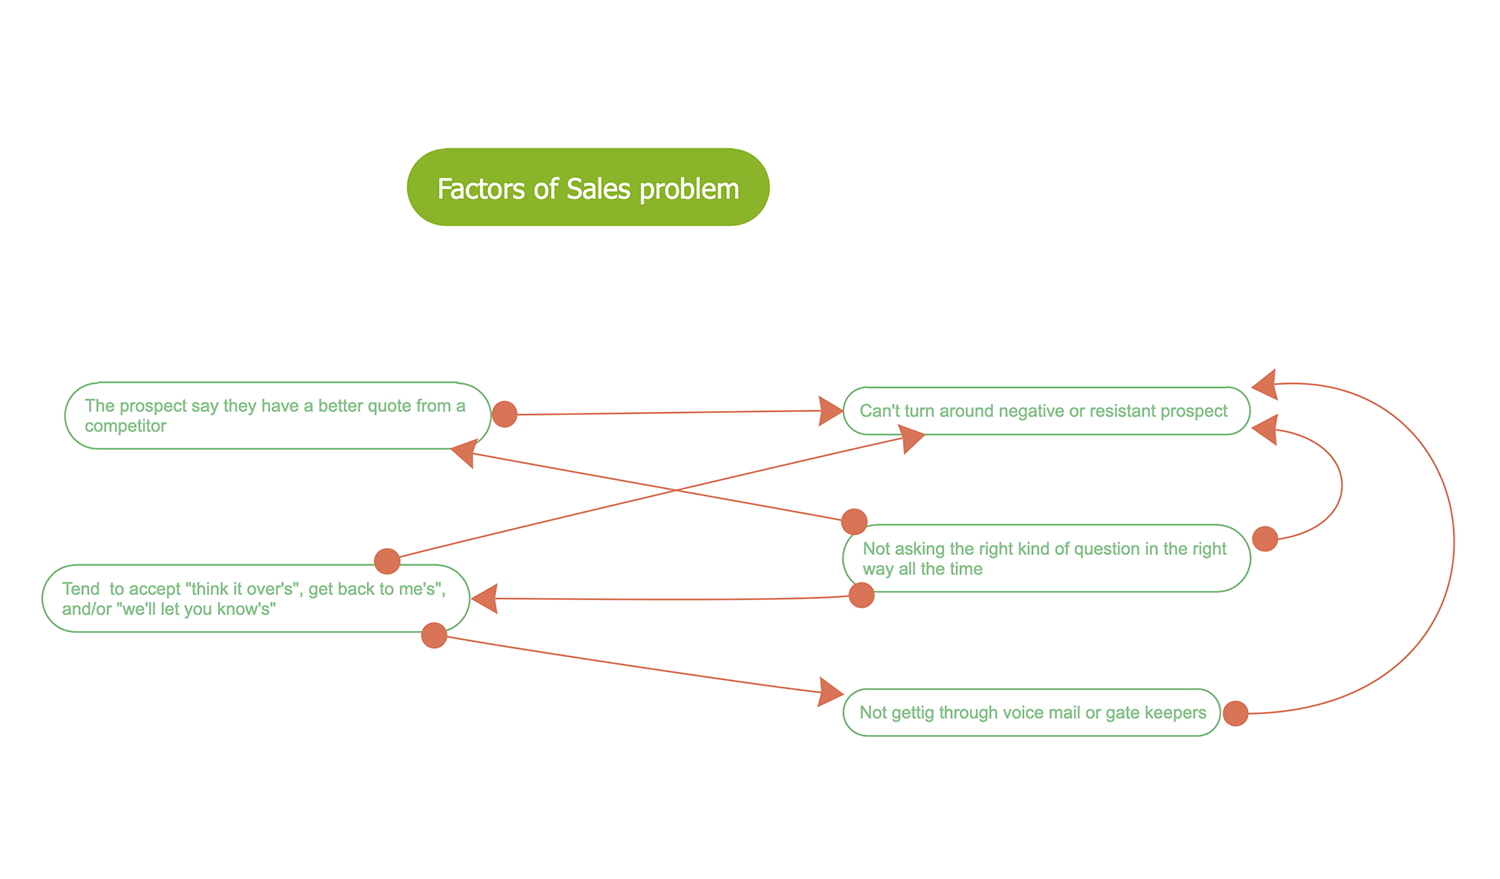
This Mind Map sample represents the factors of the sales problems and relationships between them in the form of Relations Diagram that is a perfect tool used to find a solution to any problem having complex causal relationships. The factors are depicted in the rounded boxes, the relationships are represented as arrows connecting the corresponding boxes. One of two connected boxes represents a 'cause' and another one is an 'effect', so each arrow extends from the element that influences to that one that is influenced. The multiple relationships are represented in the diagram. In this case, the same box can be connected with one or more boxes. All these problem's factors were previously outlined in the application's Brainstorming mode and then step-by-step related to each other. Being designed in ConceptDraw MINDMAP software, this Mind Map can be easily exported to the Relations Diagram and automatically opened in ConceptDraw DIAGRAM software for further using.
Example 10: Risk Diagram (Process Decision Program Chart)
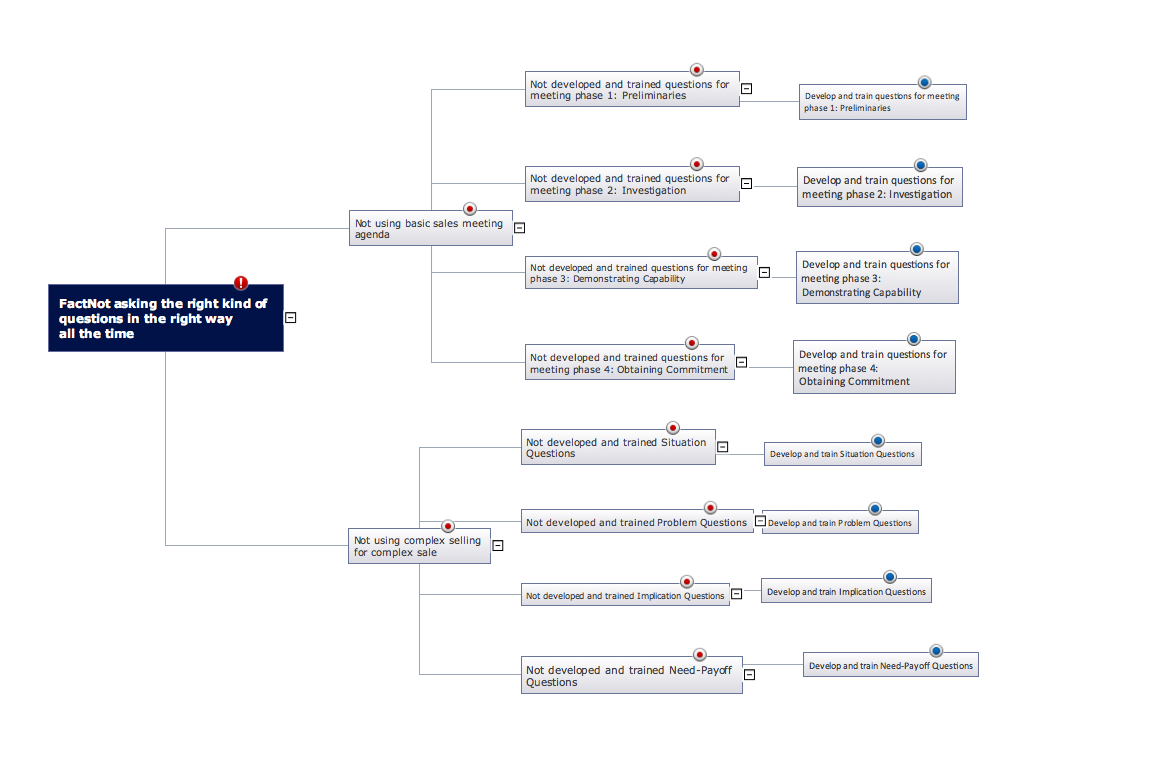
This Mind Map sample represents the Risk Diagram or Process Decision Program Chart describing how to solve sales problems. The use of effective and comfortable problem-solving ways is important in any field. The risk analysis and construction of the Risk Diagram is one of the most popular tools supposing not only the known problems solution, but also helping in identification and managing potential problems that could negatively influence the further business development. The risk analysis identifies the risks and lets one develop the corresponding corrective actions. Each action, each potential obstacle or circumstance that may pose a risk is analyzed separately and the corresponding effective preventive action is developed for each one. ConceptDraw MINDMAP helps you to be successful in your business. This is an ideal software offering a comprehensive approach to risk analysis, decision making and problem solving, which is suitable for tasks of any nature and projects of any scale.
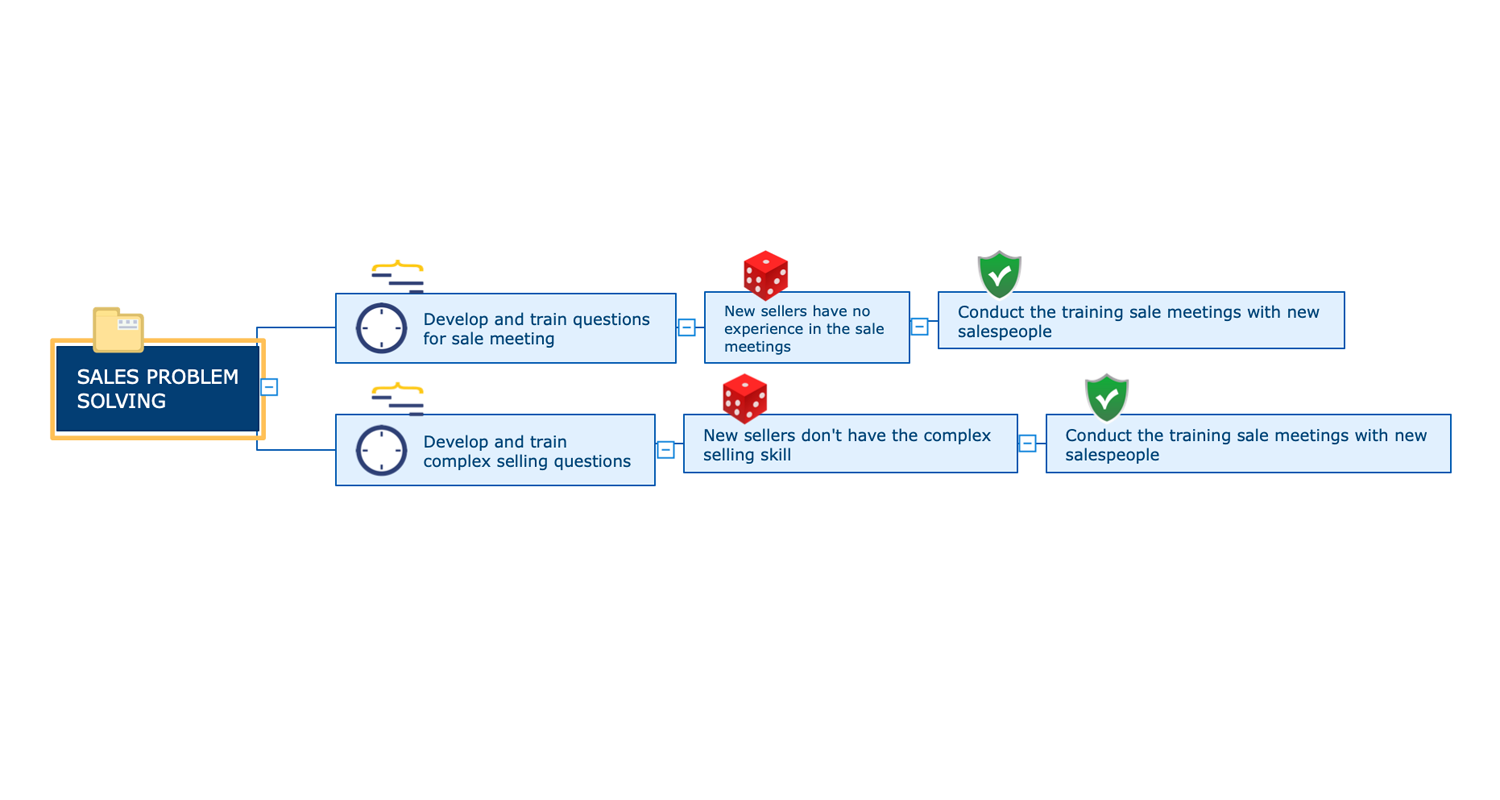
Example 11: Root Cause Analysis Tree Diagram
This Mind Map sample shows the Tree Diagram made during the implementation of the Root Cause Analysis. It is a well-known structured step-by-step method allowing any stakeholders to understand the real causes of a specific problem, as well as to identify the ways of responding them, helping the achievement of the complete resolution. The presentation of the Root Cause Analysis results in a form of Tree Diagram ensures their visualization, clarity, better understanding, and easier finding the list of possible effective corrective actions. So, the Root Cause Analysis Tree Diagram is convenient to be used for the formulation of these actions. The ConceptDraw MINDMAP is an advantageous software for problem analysis, identification of the root causes, and simultaneous displaying their structure together with the recommended corrective actions. At the same time, you have a choice of representation the broad categories or breaking them on the smaller ones required to accomplish a goal, solution or task in the best way.
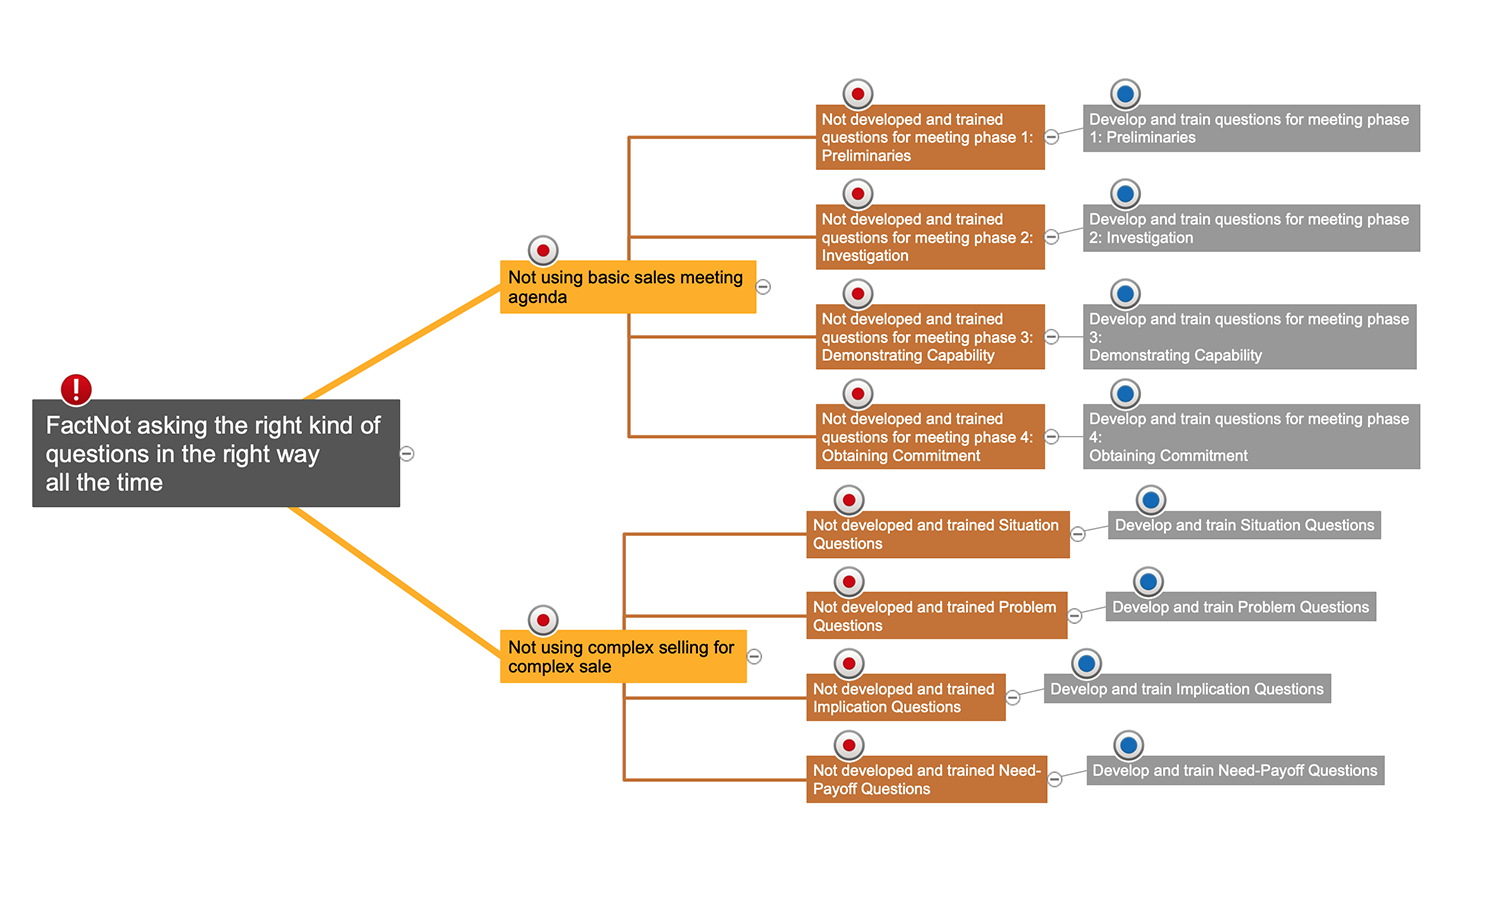
More Examples and Templates
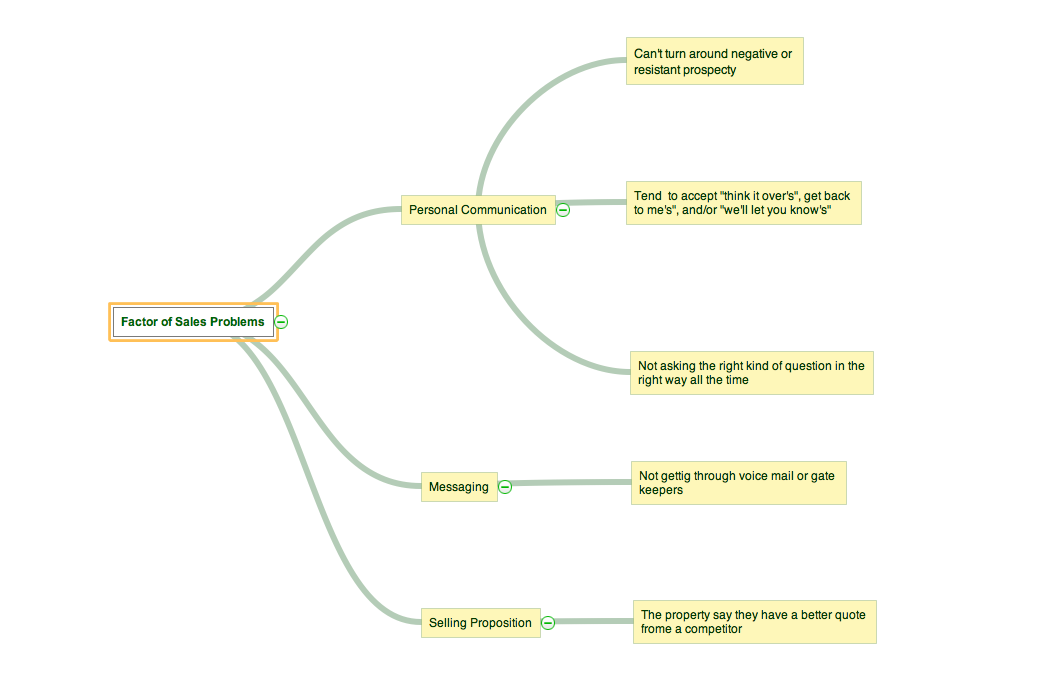
Affinity Diagram
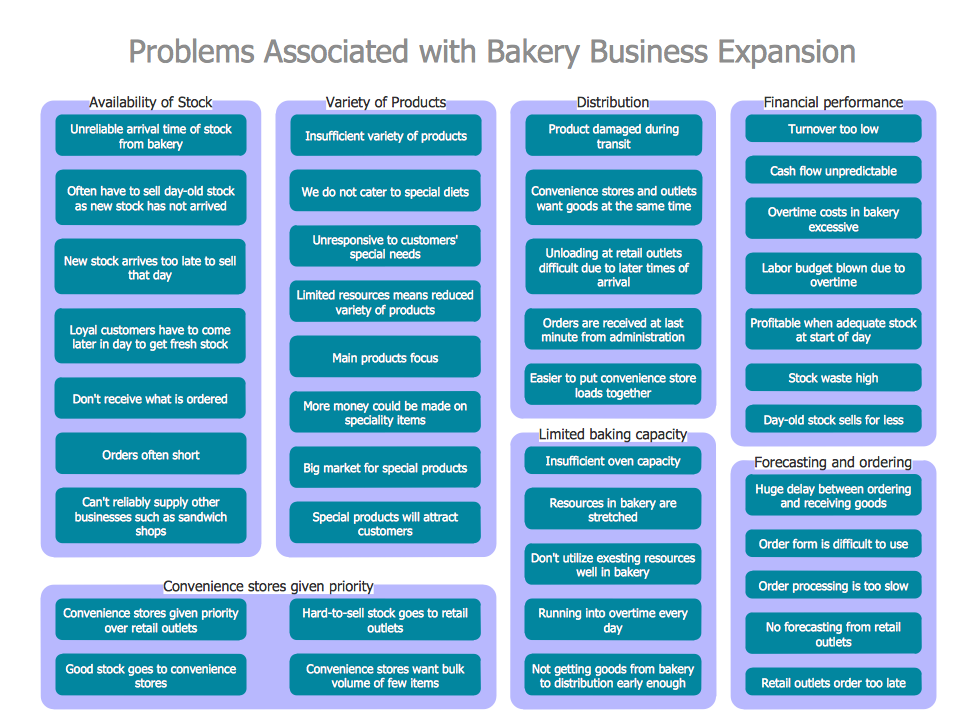
Affinity Diagram — Business Expansion
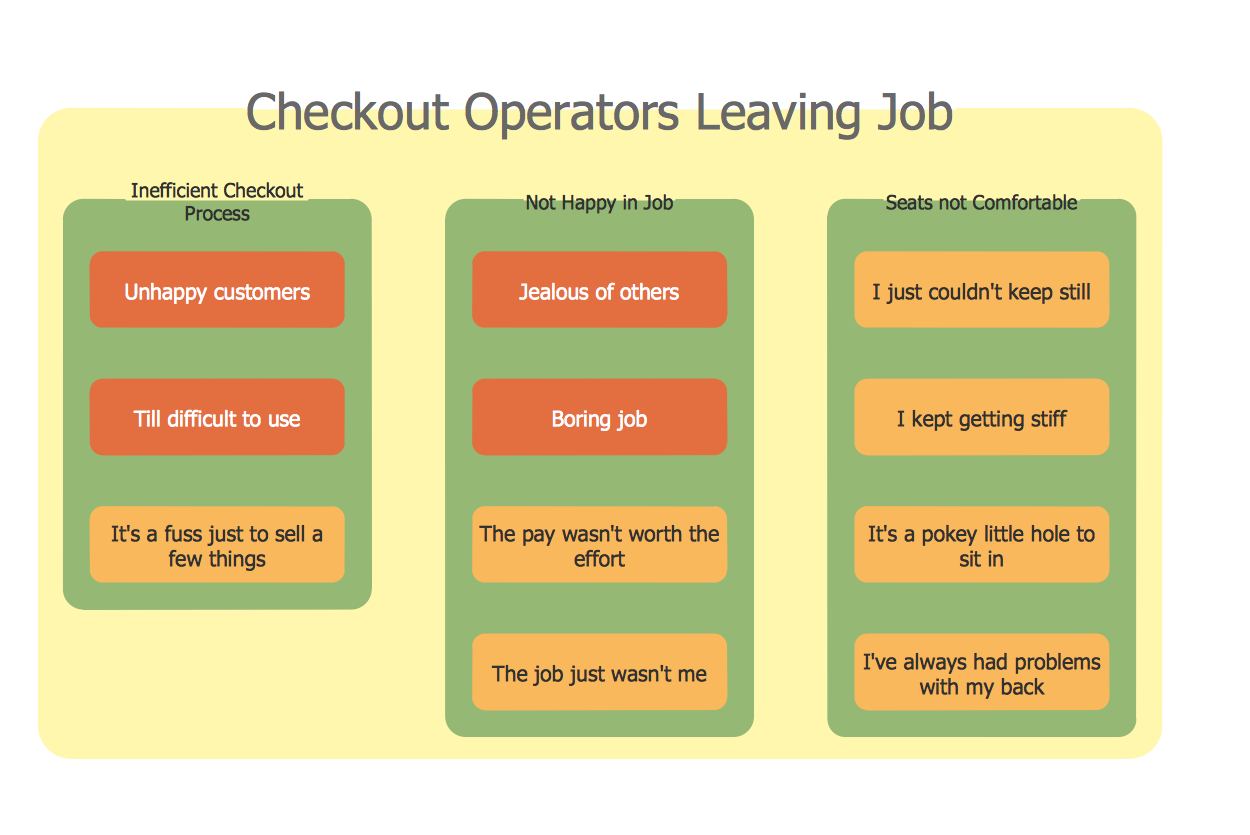
Affinity Diagram — Personal Activity
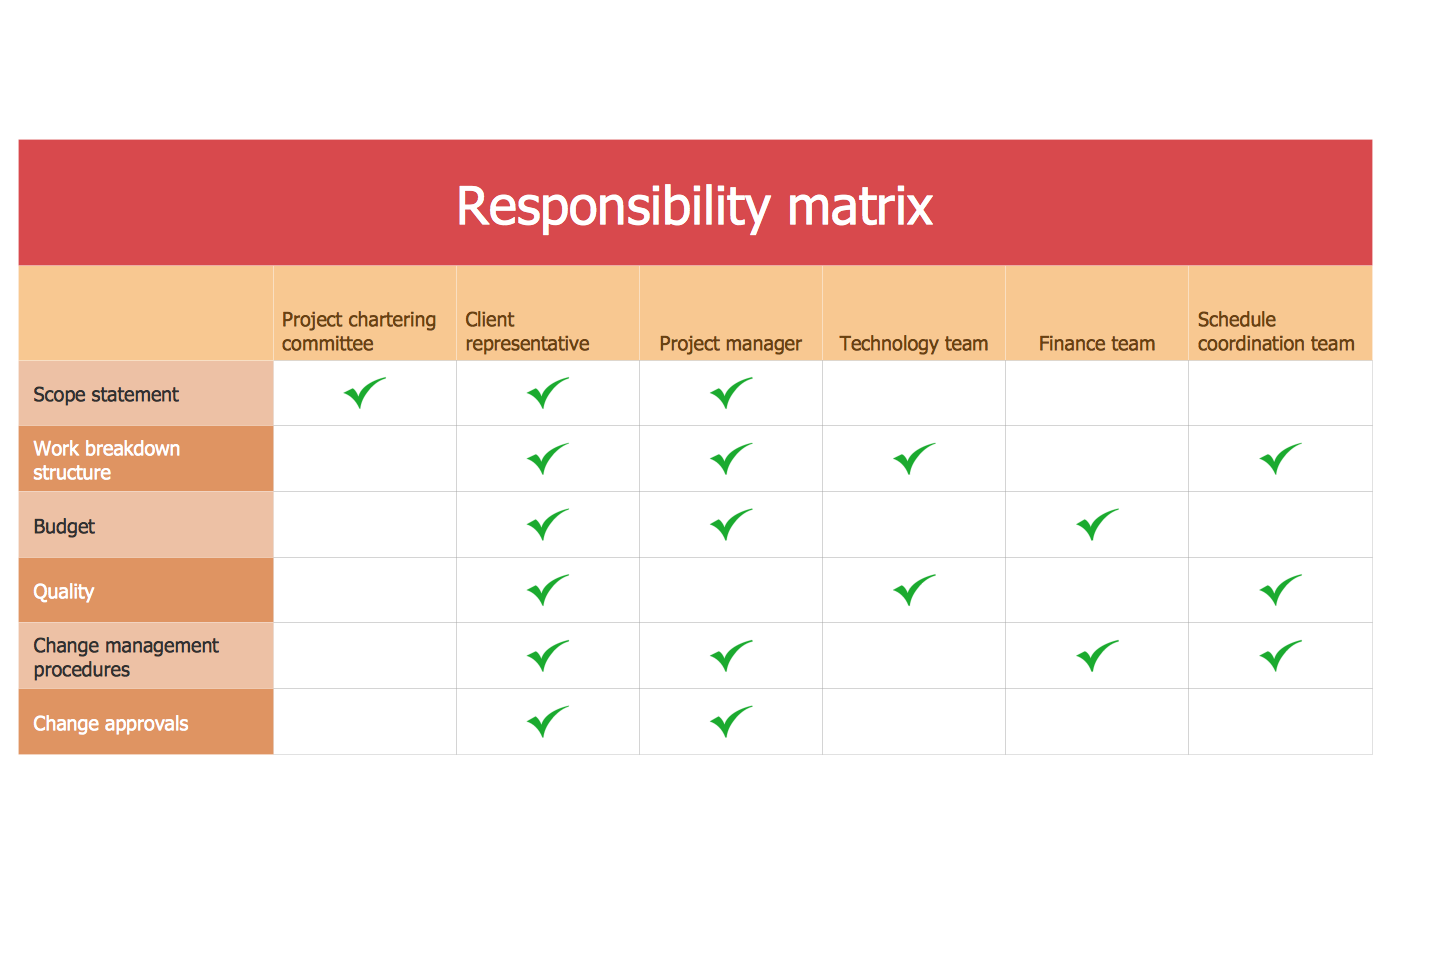
Involvement Matrix — Distribution of Responsibilities
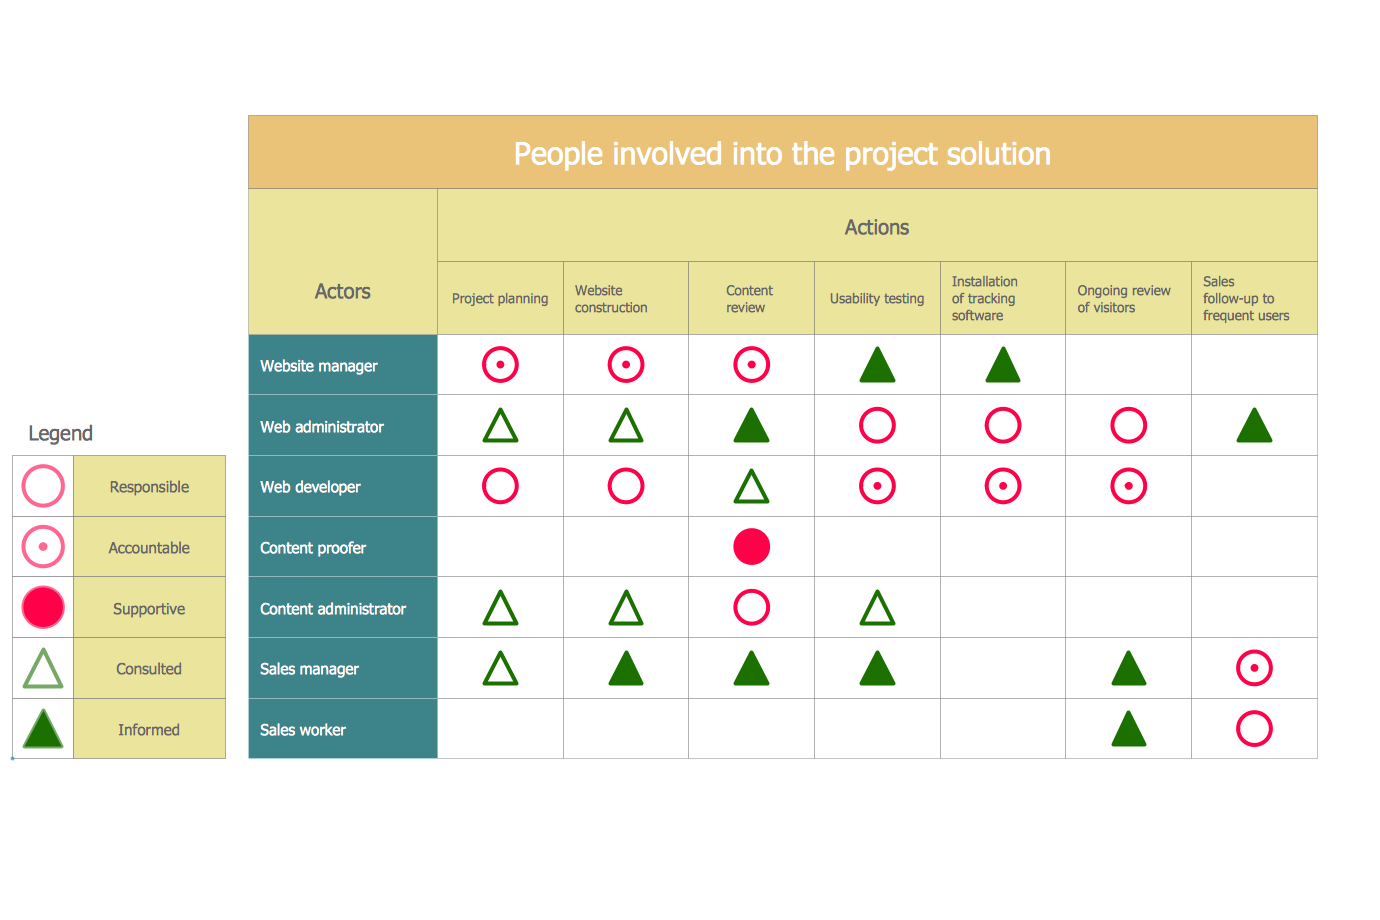
Involvement Matrix — Project Participants Involvement
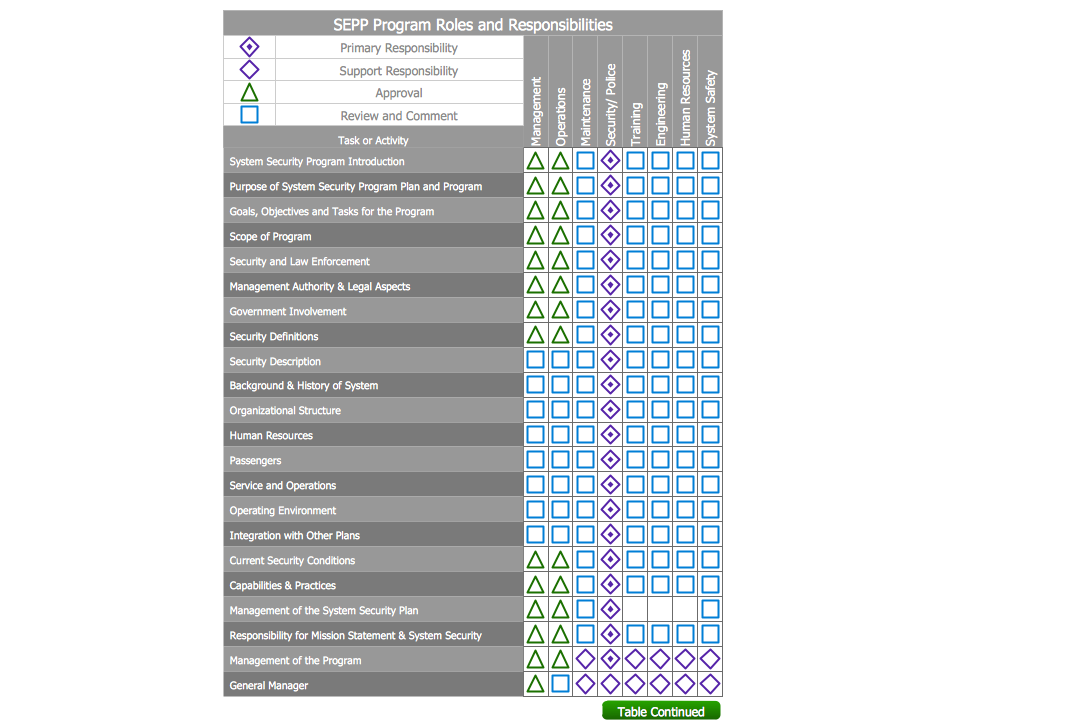
Involvement Matrix — SEPP Program Roles and Responsibilities
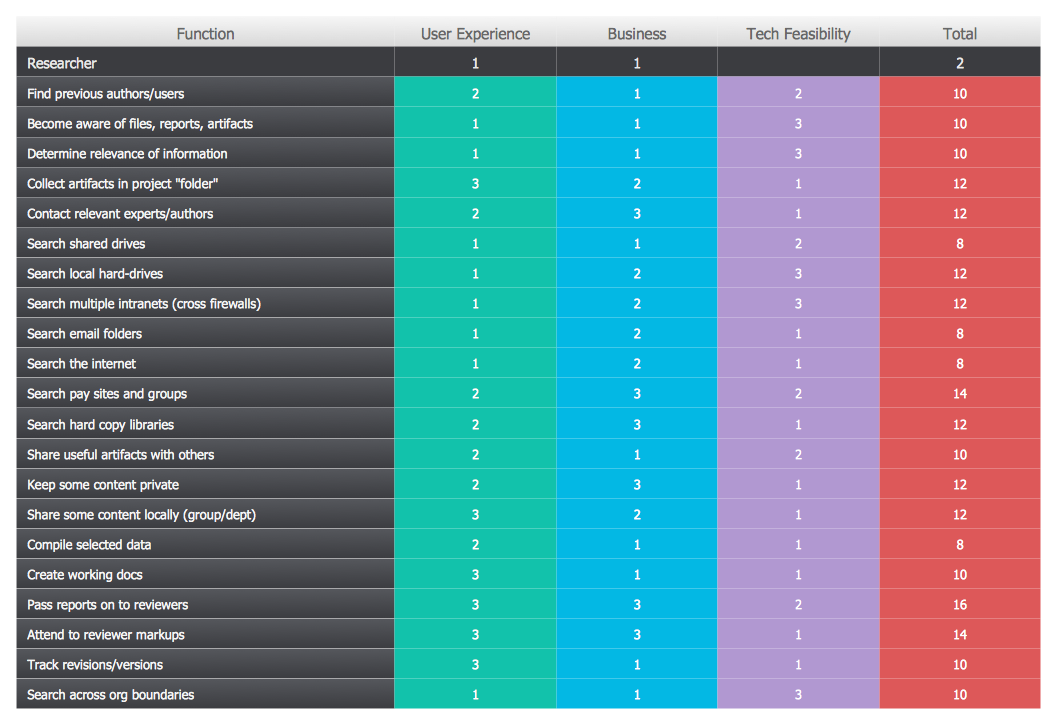
Opportunity Prioritization Matrix
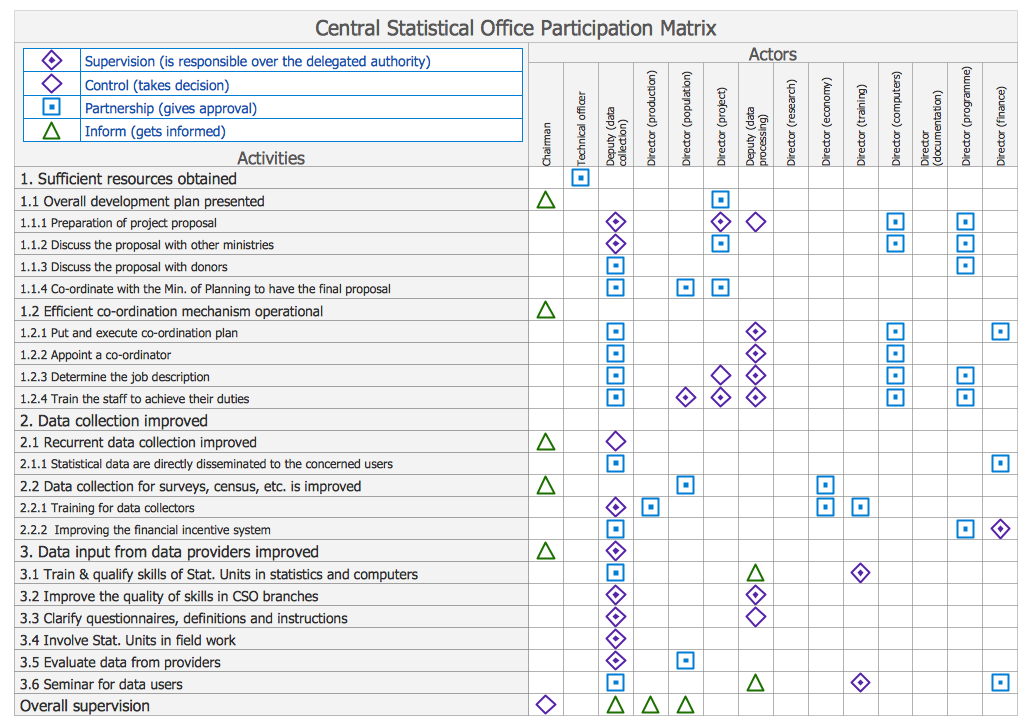
Participation Matrix — Central Statistical Office
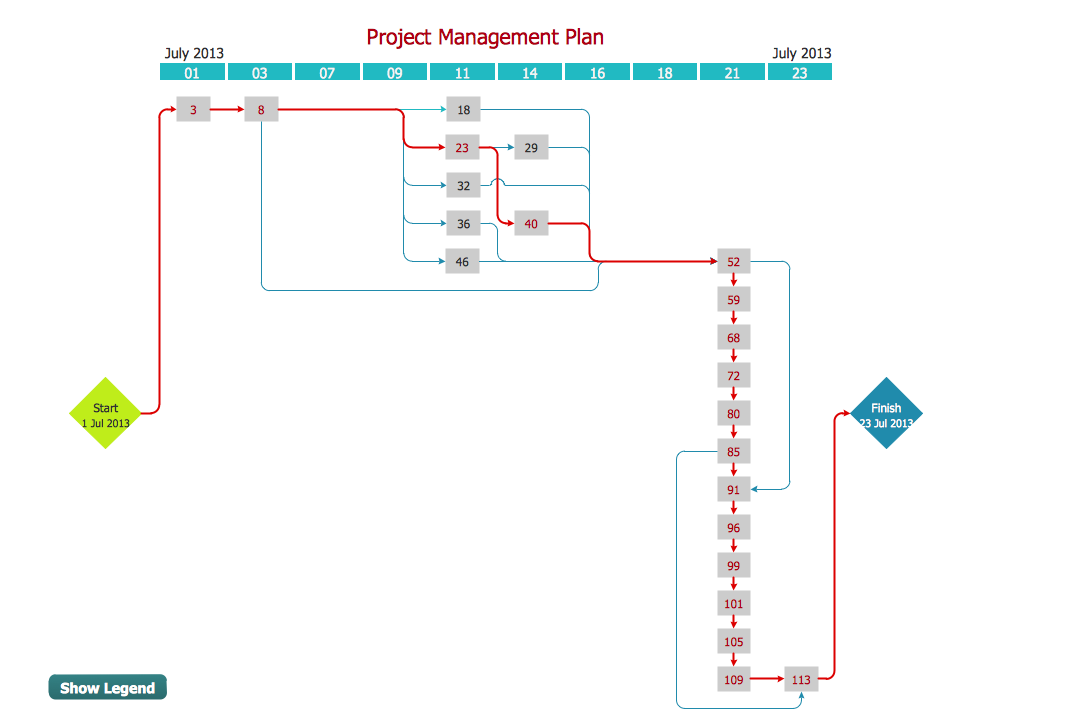
PERT Chart — Project Management
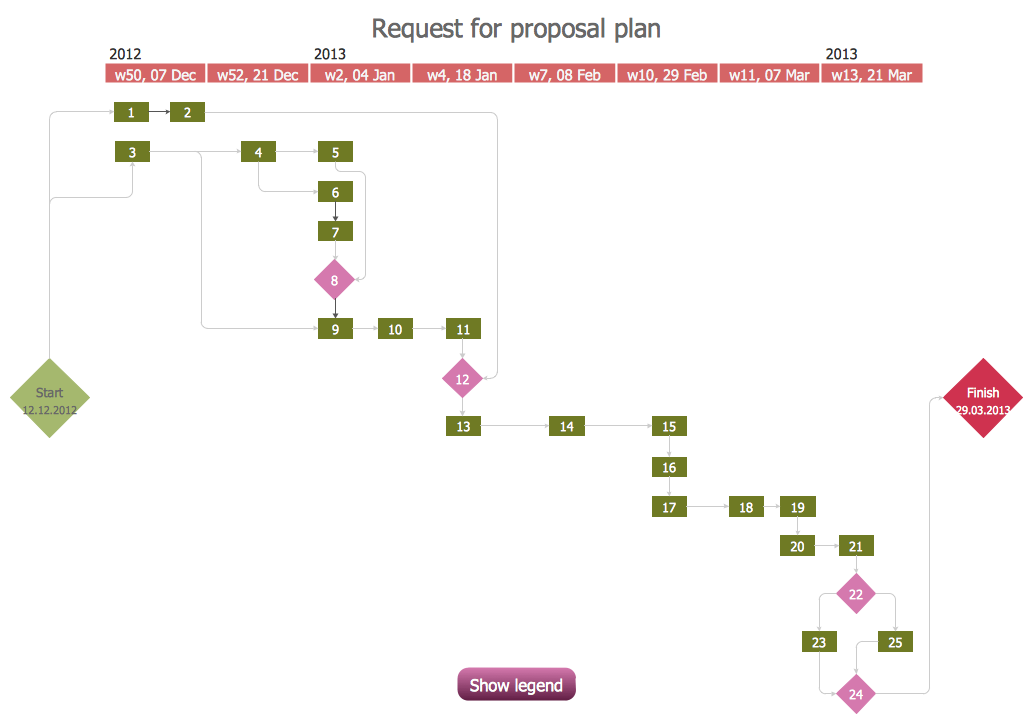
PERT Chart — Request for Proposal

Prioritization Matrix
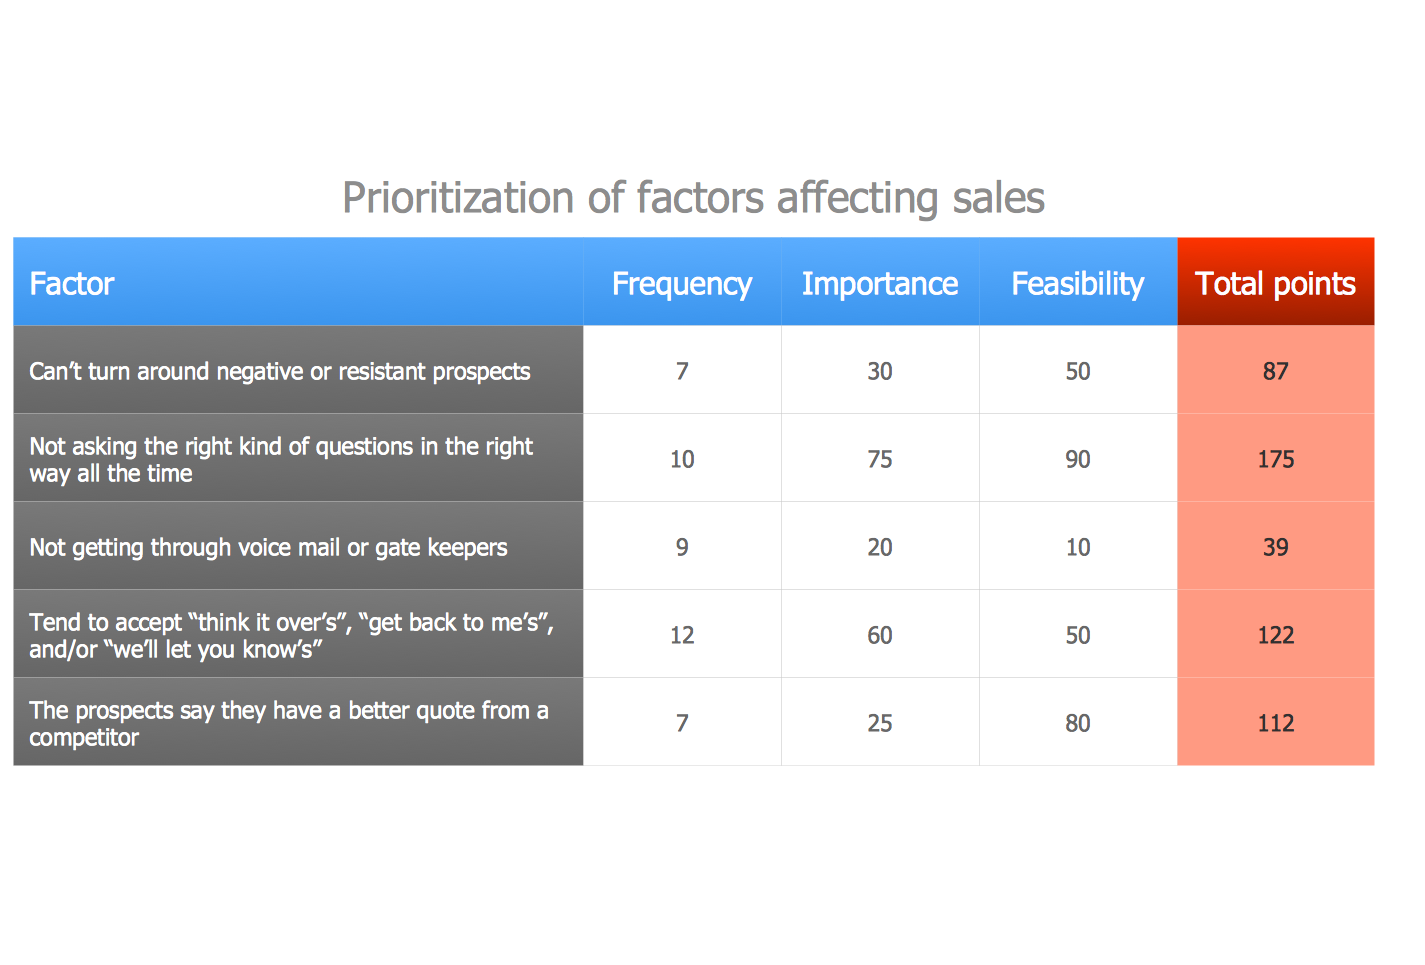
Prioritization Matrix — Sales Activity
Inside
What I Need to Get Started
To get started you need ConceptDraw OFFICE and the “7 Management and Planning Tools” solution. You can find the solution in the Management area of ConceptDraw Solution Park. Install the solution on your computer, using ConceptDraw STORE.
Step 1. Explore the examples of the downloaded solution
Open ”Seven Management and Planning Tools“ solution and select any of the templates, there are examples presented at the bottom. Examples of the solution diagrams contained there are:
- Affinity Diagram
- Relations Diagram
- Prioritization Matrix
- Root Cause Analysis Tree Diagram
- Involvement Matrix
- PERT Chart
- Risk Diagram (PDPC)
Step 2. Create your own documents
Create your own documents using one of the provided templates.
- Affinity Diagram
Affinity Diagram input in Management Area in ConceptDraw DIAGRAM. - Relations Diagram
Relations Diagram input in Management Area in ConceptDraw DIAGRAM. - Prioritization Matrix
Prioritization Matrix Template in Seven Management and Planning Tools Solution in ConceptDraw DIAGRAM. - Root Cause Analysis Tree Diagram
Root Cause Analysis Tree Diagram input in Management Area in ConceptDraw DIAGRAM. - Involvement Matrix
Action Involvement Matrix Template in Seven Management and Planning Tools Solution in ConceptDraw DIAGRAM. - PERT Chart
PERT Chart output plugin in ConceptDraw PROJECT Reports. - Risk Diagram (PDPC)
Risk Diagram input in Management Area in ConceptDraw DIAGRAM.
Step 3. Present Results
Present your work results. Use ConceptDraw DIAGRAM or MS PowerPoint:
- Display presentation in ConceptDraw DIAGRAM by pressing F5.
- Export your work documents to MS PowerPoint for sharing with others.

