Bio Flowchart Lite
This app targets to help teachers and students to create vivid and professional biological flowcharts and diagrams in an easy way.The vector stencils library "Citric acid cycle (TCA cycle)" contains 26 symbols of metabolites for drawing metabolic pathway maps and biochemical shematic diagrams of the citric acid cycle (TCA cycle, tricarboxylic acid cycle, Krebs cycle) and diagrams of metabolism processes.
"The citric acid cycle - also known as the tricarboxylic acid cycle (TCA cycle), or the Krebs cycle, - is a series of chemical reactions used by all aerobic organisms to generate energy through the oxidation of acetate derived from carbohydrates, fats and proteins into carbon dioxide and chemical energy in the form of adenosine triphosphate (ATP). In addition, the cycle provides precursors of certain amino acids as well as the reducing agent NADH that is used in numerous other biochemical reactions. Its central importance to many biochemical pathways suggests that it was one of the earliest established components of cellular metabolism and may have originated abiogenically.
The name of this metabolic pathway is derived from citric acid (a type of tricarboxylic acid) that is consumed and then regenerated by this sequence of reactions to complete the cycle. In addition, the cycle consumes acetate (in the form of acetyl-CoA) and water, reduces NAD+ to NADH, and produces carbon dioxide as a waste byproduct. The NADH generated by the TCA cycle is fed into the oxidative phosphorylation (electron transport) pathway. The net result of these two closely linked pathways is the oxidation of nutrients to produce usable chemical energy in the form of ATP." [Citric acid cycle. Wikipedia]
The shapes example "Design elements - TCA cycle" is included in the Biology solution from the Science and Education area of ConceptDraw Solution Park.
Steps of Accounting Cycle
The steps of accounting cycle include the processes of identifying, collecting, analyzing documents, recording transactions, classifying, summarizing, posting, and preparing trial balance, making journal entries, closing the books and final reporting financial information of an organization.Use the ConceptDraw PRO with Accounting Flowcharts Solution to create your own professional Accounting Flowcharts of any complexity quick and easy.
 Biology
Biology solution extends ConceptDraw PRO software with samples, templates and libraries containing biological vector symbols, to help you create scientific and educational designs in the field of biology.
Education Information
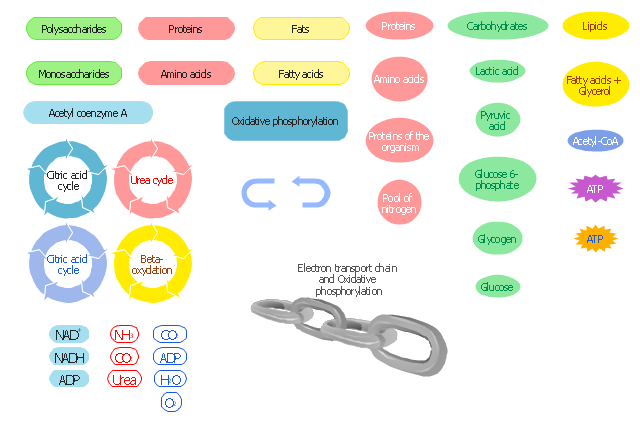
The Education Information is multifariuos and can be often represented in various forms. Еру the most successful ways of presentation the information and data are various illustrations, diagrams and colorful education infographics which you can easily make in ConceptDraw PRO software extended with Education Infographics Solution from the Business Infographics Area.The vector stencils library " Biochemistry of metabolism" contains 46 metabolite symbols for drawing metabolic pathways maps, biochemical diagrams and metabolism process flow charts using the ConceptDraw PRO diagramming and vector drawing software.
"Metabolites are the intermediates and products of metabolism. The term metabolite is usually restricted to small molecules. Metabolites have various functions, including fuel, structure, signaling, stimulatory and inhibitory effects on enzymes, catalytic activity of their own (usually as a cofactor to an enzyme), defense, and interactions with other organisms (e.g. pigments, odorants, and pheromones). A primary metabolite is directly involved in normal "growth", development, and reproduction. Alcohol is an example of a primary metabolite produced in large-scale by industrial microbiology. A secondary metabolite is not directly involved in those processes, but usually has an important ecological function. Examples include antibiotics and pigments such as resins and terpenes etc. ...
The metabolome forms a large network of metabolic reactions, where outputs from one enzymatic chemical reaction are inputs to other chemical reactions." [Metabolite. Wikipedia]
The shapes example "Design elements - Biochemistry of metabolism" is included in the Biology solution from the Science and Education area of ConceptDraw Solution Park.
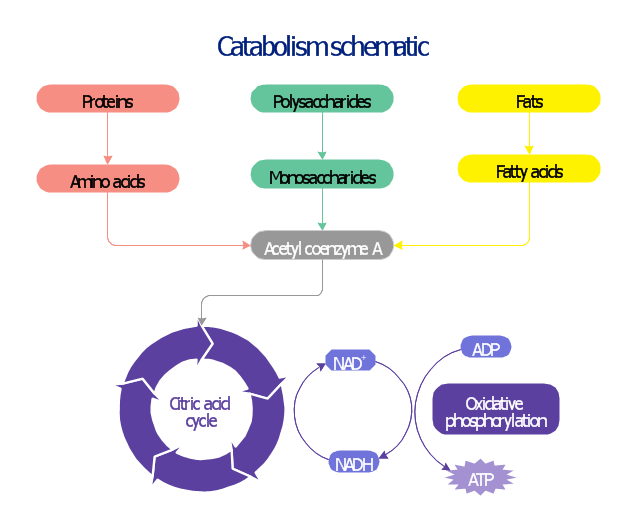
This biochemical chart display how proteins, polysaccharides and fats from food are digested into gastrointestinal tract into aminoacids, monosaccharides and fatty acids, and then broken down and oxidized to carbon dioxide and water in cellular processes of energy generation.
This metabolic pathway map was redesigned from Wikipedia file: Catabolism schematic.svg. [en.wikipedia.org/ wiki/ File:Catabolism_ schematic.svg]
The biochemical diagram example "Catabolism schematic" was created using the ConceptDraw PRO diagramming and vector drawing software extended with the Biology solution from the Science and Education area of ConceptDraw Solution Park.
- Citric acid cycle ( TCA cycle ) | Design elements - TCA cycle | Biology ...
- Biology | Design elements - TCA cycle | Citric Acid Cycle Flow Chart
- LLNL Flow Charts | Manufacturing and Maintenance | Citric acid ...
- Citric acid cycle ( TCA cycle ) | Biology | Catabolism schematic ...
- Tca Cycle Flow Chart
- Chart On Tca Cycle
- Kreb Cycle Step By Step In A Flos Chart
- Citric Acid Cycle Diagram
- Diagram Of Krebs Cycle Or Citric Acid Cycle
- Citric acid cycle ( TCA cycle ) | Biology | Design elements - TCA cycle ...
- Diagram Of Citric Acid Cycle
- Tricarboxylic Acid Cycle Diagram
- Citric acid cycle ( TCA cycle ) | Biochemical metabolic pathway map ...
- Product life cycle process - Flowchart | Water cycle diagram | What is ...
- Water Cycle Drawing
- Citric acid cycle ( TCA cycle ) | Biology | Tca Cycle Flow Images
- Nature | Citric acid cycle ( TCA cycle ) | Types of Flowchart - Overview ...
- Biology | Biology Drawing Software | Biology Drawing | Diagram To ...
- Citric acid cycle ( TCA cycle ) | Biology | Biology Symbols | Draw A ...
- Biology | ConceptDraw Solution Park | Citric acid cycle ( TCA cycle ...

-symbols--design-elements---tca-cycle.png--diagram-flowchart-example.png)


