Flowchart Components
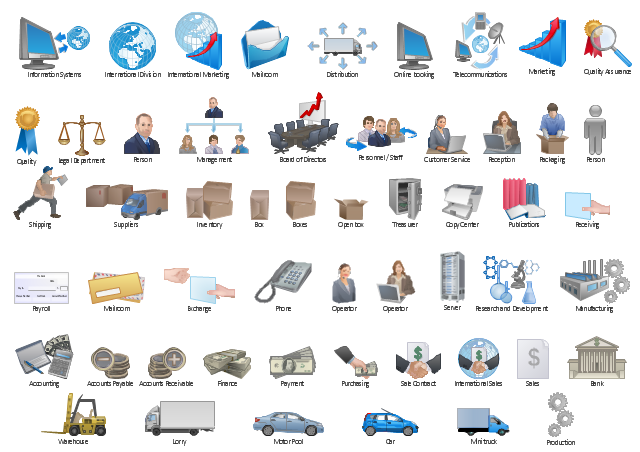
The ConceptDraw Flowchart component includes a set of samples and templates. This geathered as flowchart maker toolbox which focused on drawing flowcharts of any industry standards.The vector stencils library "Workflow diagrams" contains 54 symbol icons for drawing the work flow charts.
Use these clipart to represent information flow, automation of business processes, business process re-engineering, accounting, management, and human resources tasks in industry, business, and manufacturing.
"A workflow consists of an orchestrated and repeatable pattern of business activity enabled by the systematic organization of resources into processes that transform materials, provide services, or process information. It can be depicted as a sequence of operations, declared as work of a person or group, an organization of staff, or one or more simple or complex mechanisms.
From a more abstract or higher-level perspective, workflow may be a view or representation of real work, thus serving as a virtual representation of actual work. The flow being described may refer to a document, service or product that is being transferred from one step to another.
Workflows may be viewed as one fundamental building block to be combined with other parts of an organisation's structure such as information silos, teams, projects, policies and hierarchies." [Workflow. Wikipedia]
The clipart example "Design elements - Workflow diagram" was drawn using the ConceptDraw PRO diagramming and vector drawing software extended with the Workflow Diagrams solution from the Business Processes area of ConceptDraw Solution Park.
Bubble diagrams in Landscape Design with ConceptDraw DIAGRAM
Bubble Diagrams are the charts with a bubble presentation of data with obligatory consideration of bubble's sizes. They are analogs of Mind Maps and find their application at many fields, and even in landscape design. At this case the bubbles are applied to illustrate the arrangement of different areas of future landscape design, such as lawns, flowerbeds, playgrounds, pools, recreation areas, etc. Bubble Diagram helps to see instantly the whole project, it is easy for design and quite informative, in most cases it reflects all needed information. Often Bubble Diagram is used as a draft for the future landscape project, on the first stage of its design, and in case of approval of chosen design concept is created advanced detailed landscape plan with specification of plants and used materials. Creation of Bubble Diagrams for landscape in ConceptDraw DIAGRAM software is an easy task thanks to the Bubble Diagrams solution from "Diagrams" area. You can use the ready scanned location plan as the base or create it easy using the special ConceptDraw libraries and templates.Diagramming Software for Design UML Collaboration Diagrams
ConceptDraw helps you to start designing your own UML Collaboration Diagrams with examples and templates.
Flowchart Maker
A flowchart maker is a software showing the interaction, sequence or organization. It also known as flowchart maker or ConceptDraw DIAGRAM standard supplied with different types of symbol collections: standard symbols, branded set and authored. It used strictly for enhancing scientific or business documents with abstract explanatory pictures. Business graphic applications show a special knowledge representations and include many features for creating schematic pictures. These graphic tools are known as flowchart maker or flowchart maker software.Process with UML
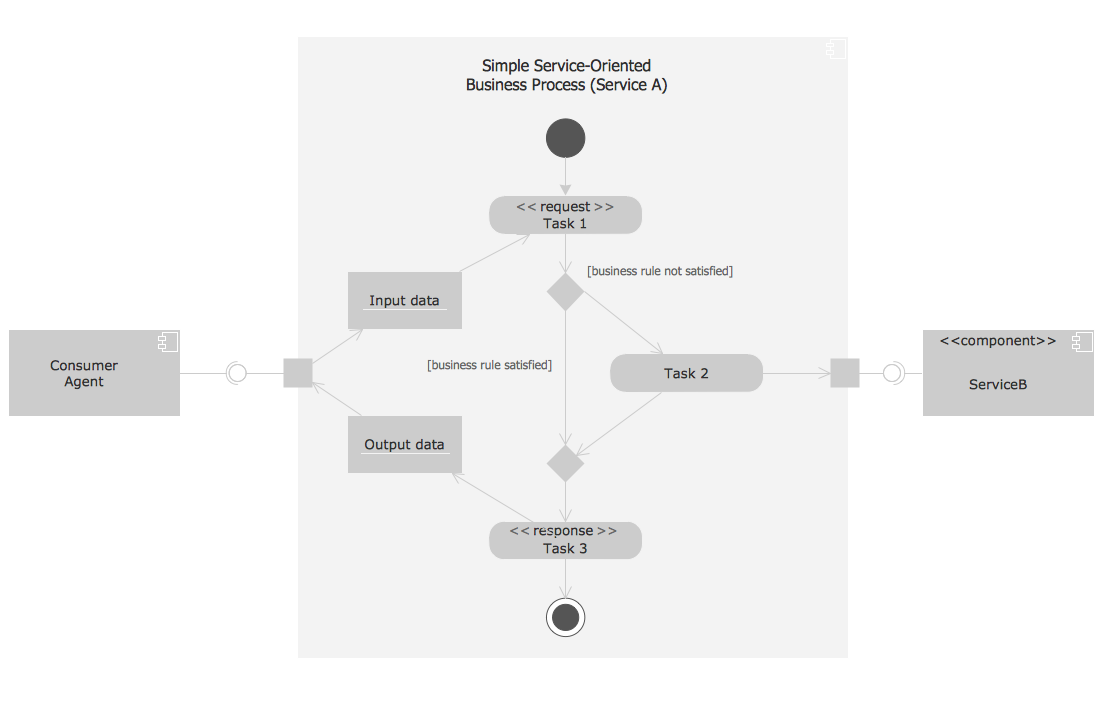
This UML activity diagram shows the abstract example of orchestration of service-oriented business process. Orchestration is the method for composition the hierarchical and self-contained service-oriented business processes. It is coordinated by the single agent. This sample was created in ConceptDraw DIAGRAM diagramming and vector drawing software using the Rapid UML Solution from the Software Development area of ConceptDraw Solution Park.UML Class Diagrams. Diagramming Software for Design UML Diagrams
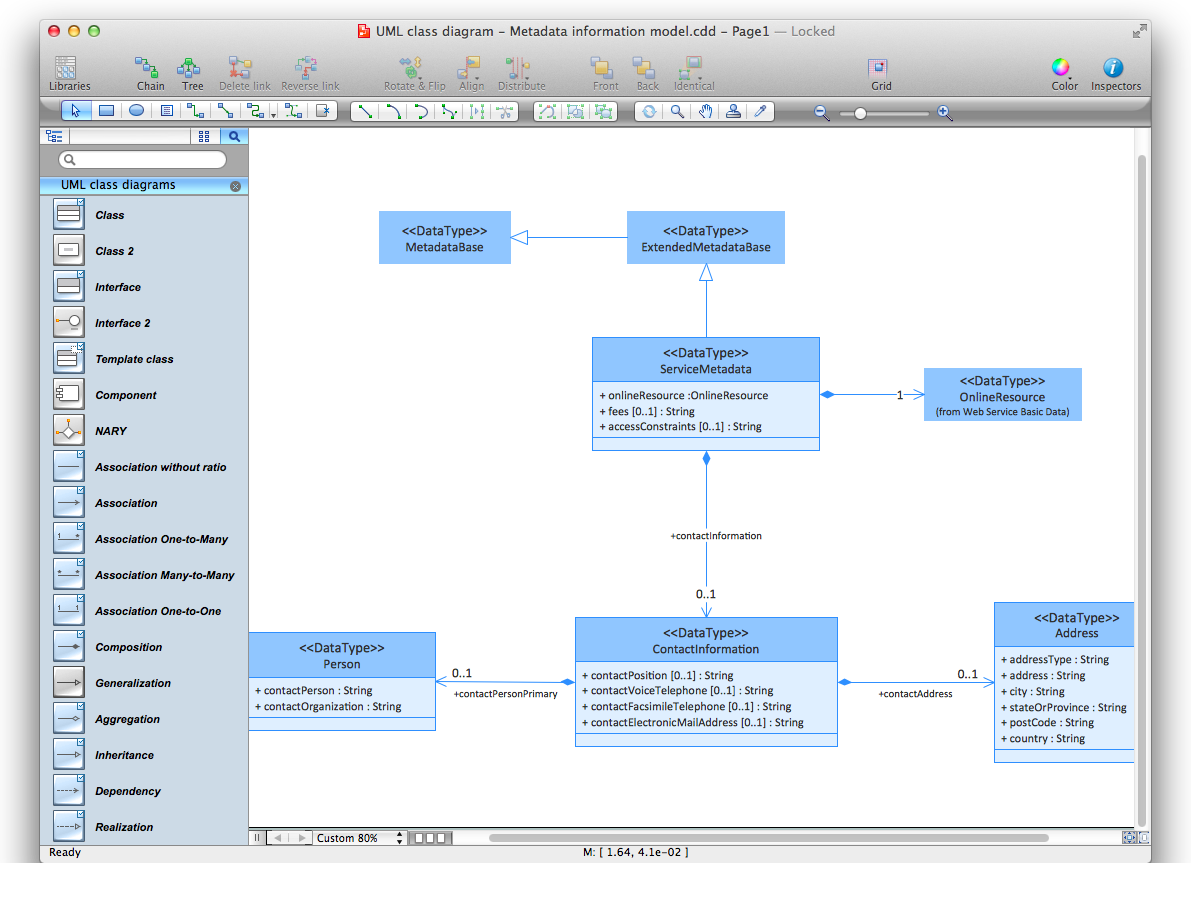
In software engineering, a UML Class Diagrams is a type of static structure diagram that is used both for general conceptual modeling of the systematics of the application, and for detailed modeling translating the models into programming code. Use ConceptDraw DIAGRAM with UML class diagram templates, samples and stencil library from Rapid UML solution to show the classes of system, their attributes, operations or methods, and the relationships among the classes.
Entity Relationship Diagram Symbols
The semantic modeling method nowadays is successfully applied in database structure design. It is effective method of modeling the data structures, which is based on the meaning of these data. As a tool of semantic modeling, there are used different types of Entity-Relationship Diagrams. Entity Relationship Diagram (ERD) is applied to visually and clearly represent a structure of a business database. The main components of ERDs are: entity, relation and attributes. An entity is a class of similar objects in the model, each entity is depicted in the form of rectangle and has the name expressed by a noun. Relation is shown in the form of non-directional line that connects two entities. There are several notation styles used for ERDs: information engineering style, Chen style, Bachman style, Martin Style. The Entity Relationship Diagram symbols used for professional ERD drawing are predesigned by professionals and collected in the libraries of the Entity-Relationship Diagram (ERD) solution for ConceptDraw DIAGRAM software.
 HR Dashboard
The HR Dashboard solution extends ConceptDraw DIAGRAM functionality with powerful drawing tools and great collection of comprehensive vector design elements, icons, pictograms and objects, navigation elements, live objects of HR charts, HR indicators, and thematic maps. The range of HR Dashboards applications is extensive, among them the human resource management, recruitment, hiring process, human resource development. ConceptDraw DIAGRAM software is perfect for creation HR Dashboard with any goal you need. It gives you all opportunities for designing not only informative, but also professional looking and attractive HR Dashboards of any style and degree of detalization, that are perfect for using in presentations, reports and other thematic documents.
Diagramming Software for Design UML Interaction Overview Diagrams
UML Interaction Overview Diagram schematically shows a control flow with nodes and a sequence of activities that can contain interaction or sequence diagrams.
- Design elements - IVR people | Network Icons | AWS Simple Icons ...
- Design elements - IVR people | Cisco Network Design . Cisco icons ...
- Design elements - IVR computer | Design elements - IVR people ...
- Design elements - Scrum people | Design elements - IVR people ...
- Business Process Workflow Diagrams | Scrum Workflow | Design ...
- Chen Notation | Design elements - ER diagram (Chen notation ...
- Logistics - Choreography BPMN 2.0 diagram | Design elements ...
- Design Element: IVR for Network Diagrams | Network Diagramming ...
- Flowchart design . Flowchart symbols, shapes, stencils and icons ...
- Design elements - Workflow diagram


