HelpDesk
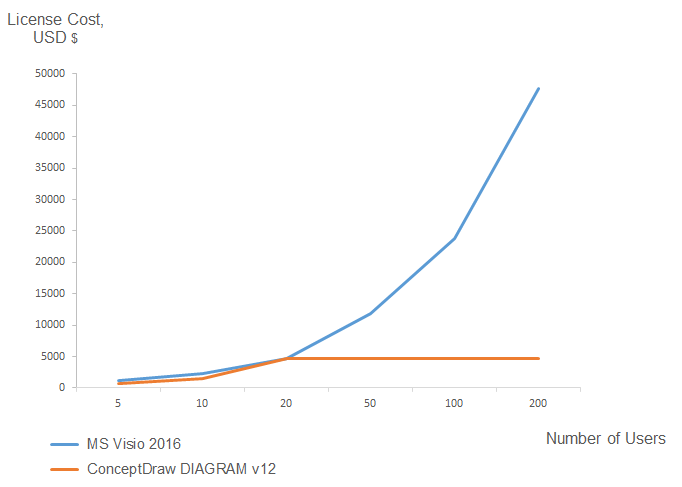
How to Track Multiple Licenses in Your Organization

HelpDesk
Replace Your Current Diagramming Tool
Metropolitan area networks (MAN). Computer and Network Examples
. Computer and Network Examples")

This area chart sample shows the US federal prisoner population changes from 1914 to 2010.
"The Federal Bureau of Prisons (BOP) is a United States federal law enforcement agency. A subdivision of the U.S. Department of Justice, the Bureau is responsible for the administration of the federal prison system. The system also handles prisoners who committed acts considered felonies under the District of Columbia's law. The Bureau was established in 1930 to provide more progressive and humane care for federal inmates, to professionalize the prison service, and to ensure consistent and centralized administration of the 11 federal prisons in operation at the time.
According to its official web site, the Bureau consists of more than 116 institutions, six regional offices, its headquarters office in Washington, D.C., two staff training centers, and 22 community corrections offices, and is responsible for the custody and care of approximately 210,000 federal offenders. Approximately 82 percent of these inmates are confined in Bureau-operated correctional facilities or detention centers. The remainder are confined through agreements with state and local governments or through contracts with privately operated community corrections centers, detention centers, prisons, and juvenile facilities." [Federal Bureau of Prisons. Wikipedia]
This area graph sample was redesigned from the Wikimedia Commons file: Federal timeline US prisoners.gif. [commons.wikimedia.org/ wiki/ File:Federal_ timeline_ US_ prisoners.gif]
The area chart example "Federal timeline US prisoners" was created using the ConceptDraw PRO diagramming and vector drawing software extended with the Area Charts solution from the Graphs and Charts area of ConceptDraw Solution Park.
Area graph

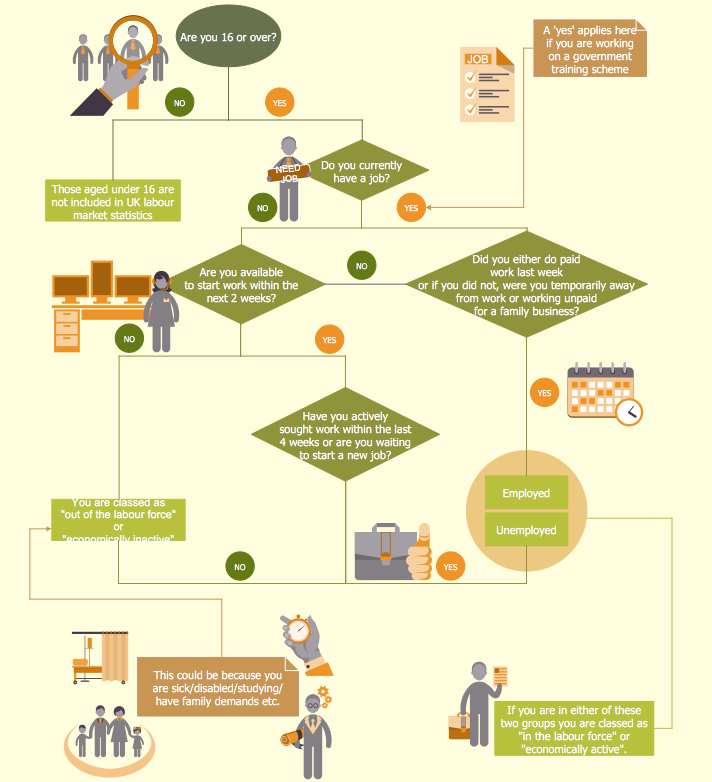
HelpDesk
How to Create a HR Process Flowchart
Flowchart Marketing Process. Flowchart Examples

Geo Map — Europe — Finland

Diagram of a Basic Computer Network. Computer Network Diagram Example

Account Flowchart. Flowchart Examples

Samples of Flowcharting
Flowchart. What is Flowchart

This circle-spoke diagram sample shows how leadership and data provide essential coordination of other functions in an asset management environment. Leadership points the way and common data systems keep all divisions communicating effectively.
This circle-spoke diagram example was created on the base of illustration of article "Beyond the Short Term: Transportation Asset Management for Long-Term Sustainability, Accountability and Performance" from the website of The Federal Highway Administration (FHWA).
[fhwa.dot.gov/ asset/ 10009/ tam_ topr806_ 3.cfm]
"Asset management, broadly defined, refers to any system that monitors and maintains things of value to an entity or group. It may apply to both tangible assets such as buildings and to intangible concepts such as intellectual property and goodwill. Asset management is a systematic process of operating, maintaining, upgrading, and disposing of assets cost-effectively. Alternative views of asset management in the engineering environment are: the practice of managing assets to achieve the greatest return (particularly useful for productive assets such as plant and equipment), and the process of monitoring and maintaining facilities systems, with the objective of providing the best possible service to users (appropriate for public infrastructure assets)." [Asset management. Wikipedia]
The hub-and-spoke diagram example "Leadership and data" was created using the ConceptDraw PRO diagramming and vector drawing software extended with the Circle-Spoke Diagrams solution from the area "What is a Diagram" of ConceptDraw Solution Park.
Circle-spoke diagram

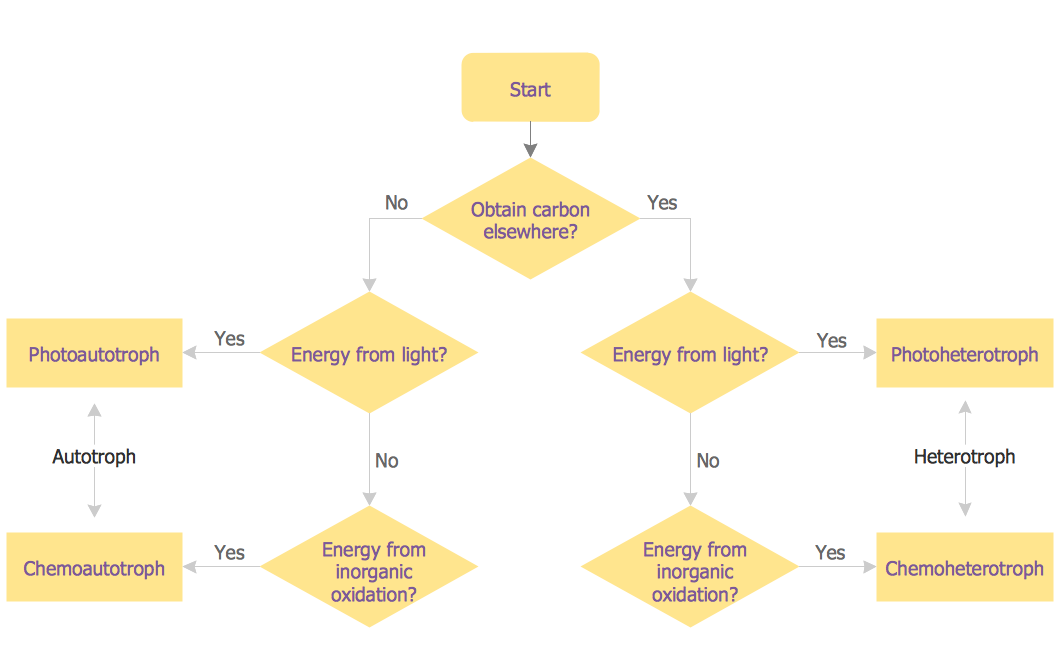
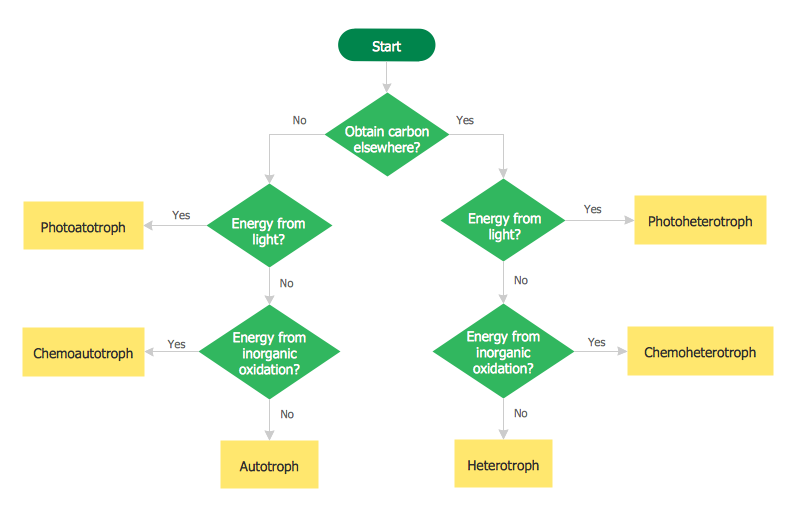
Creating Flowcharts
 Quality Mind Map
This solution extends ConceptDraw MINDMAP software with Quality Management Mind Maps (Presentations, Meeting Agendas, Problem to be solved).
- Office Administration Graphs
- Administration Process To Purchase A Delivery Truck
- Flow chart Example. Warehouse Flowchart | Administration Process ...
- A Diagram To Explain The Correct Administration Process For ...
- Management And Administration With Flow Chat
- AWS Administration and Security - Vector stencils library | Design ...
- Administration Management System Flowchart
- Diagram To Explain The Administration Process To Purchase A ...
- Office Administration Pie Chat
- Land sales process flowchart | Diagrams Of Administration Process ...
- Draw The Organogram Of The Agencies In Primary School ...
- Administration System Diagram For Decision Making
- AWS Administration and Security - Vector stencils library | AWS ...
- Prepare A Chart On District Administration Full Images
- Office Administration Department Organogram
- Sketch On Organization Chart Of Road Administration
- Design elements - AWS Enterprise Applications, AWS ...
- Easy Flowchart Of Administration Department
- Administration Diagrammatic Representative
- AWS Architecture Diagrams | Design elements - AWS Enterprise ...