Agile Methodology
Agile methodology is an excellent alternative to waterfall and traditional sequential development. ConceptDraw PRO software extended with SCRUM Workflow solution is ideal for quick and easy designing various diagrams, charts, mind maps and schematics illustrating software development using Agile methodologies, and in particular Scrum methodology.
 Seven Basic Tools of Quality
Manage quality control in the workplace, using fishbone diagrams, flowcharts, Pareto charts and histograms, provided by the Seven Basic Tools of Quality solution.
Scrum process work items and workflow
Teams working with Scrum methodology use the product backlog items (PBIs), bug work item types (WITs), reports and dashboards. SCRUM Workflow solution for ConceptDraw PRO software offers collection of samples, variety of predesigned objects, clipart and graphic elements, a set of Scrum process work items and workflow which are developed for agile teams working using Scrum.
 Project Management Area
Project Management area provides Toolbox solutions to support solving issues related to planning, tracking, milestones, events, resource usage, and other typical project management functions.
 ConceptDraw Solution Park
ConceptDraw Solution Park collects graphic extensions, examples and learning materials
 Business Package for Management
Package intended for professional who designing and documenting business processes, preparing business reports, plan projects and manage projects, manage organizational changes, prepare operational instructions, supervising specific department of an organization, workout customer service processes and prepare trainings for customer service personal, carry out a variety of duties to organize business workflow.
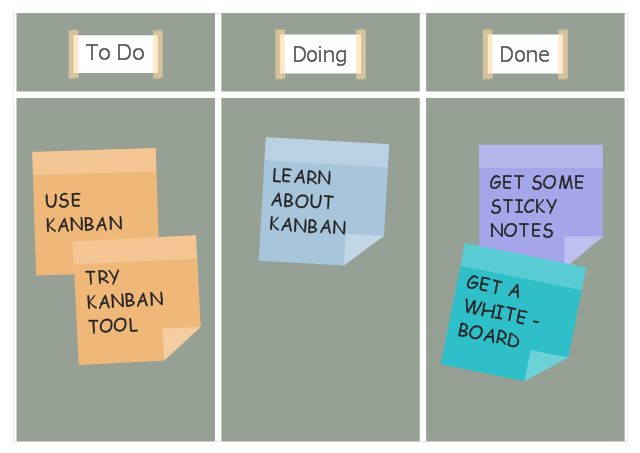
This agile software development infographic example was designed on the base of the Wikimedia Commons file: Simple-kanban-board-.jpg. [commons.wikimedia.org/ wiki/ File:Simple-kanban-board-.jpg]
This file is licensed under the Creative Commons Attribution-Share Alike 3.0 Unported license. [creativecommons.org/ licenses/ by-sa/ 3.0/ deed.en]
"The basic Scrumban board is composed out of three columns: To Do, Doing and Done. After the planning meeting the tasks are added to the To Do column, when a team member is ready to work on a task, he/ she moves it to the Doing column and when he/ she completes it, he/ she moves it to the Done column. The Scrumban board visually represents the progress of the team. The task board columns are adapted and expanded based on the team's work progress. The most common add-ons include priority columns in the To Do section and columns like Design, Manufacturing, Testing in the Doing section." [Scrumban. Wikipedia]
The infographic sample "Scrum board suggesting to use Kanban" was created using the ConceptDraw PRO software extended with the Scrum solution from the Project Management area of ConceptDraw Solution Park.
Gantt Chart Diagram
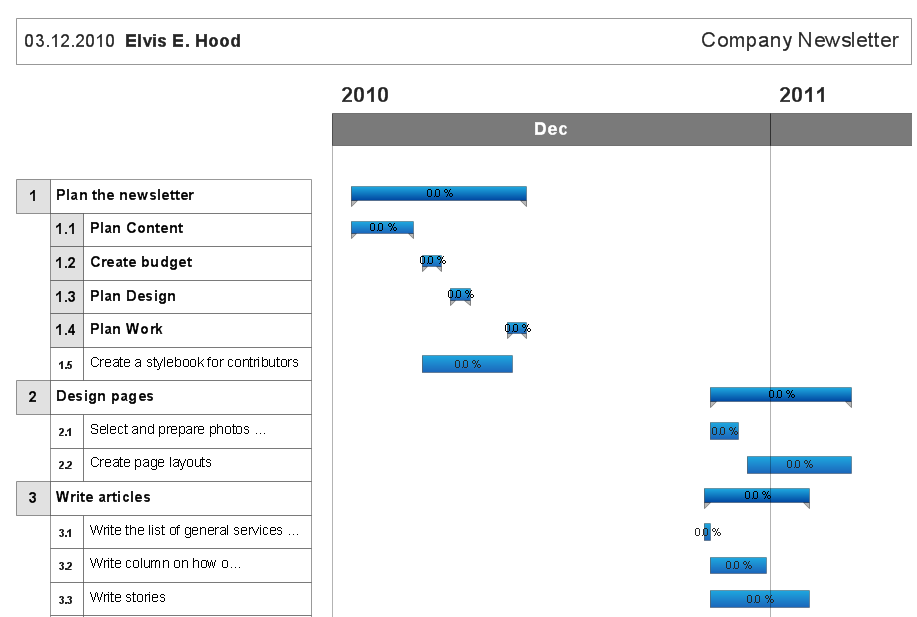
Gantt Chart is a popular type of bar charts and widely used projects planning method. It helps to illustrate the plan for some project, the progress of tasks, the resources planning, the schedule of works and working time. The Gantt Chart contains a set of intervals (bars) located on the time axis and reflects the use of resources by objects. Each bar represents a separate task in the project, its length is a duration of the work. The vertical axis of the graph represents the list of tasks. Besides, the chart can contain additional data, such as the percents of complete, the total tasks, the tasks dependencies, the key points (milestones), etc. The use of Gantt Chart greatly simplifies the project management and enables to visualize in visual and compressed view the most important information of the project, what resources are used for execution the certain tasks and which must to be the speed of their execution. ConceptDraw Office suite applications help to cope perfectly the project management tasks, to construct easily the basic structure of your project and create a Gantt Chart Diagram. PM Easy solution allows you to plan and execute the projects using the mind mapping technique, to implement planning using mind mapping, and track tasks using ConceptDraw Project.Flowcharting Software
A flowchart is a useful type of diagram quite popular in many areas of science and business, which represents some algorithm, workflow or process. ConceptDraw PRO diagramming and vector graphic software extended with Flowcharts solution from the "Diagrams" area of ConceptDraw Solution Park is also ideal flowcharting software with powerful tools that assist in easily making the Flowcharts of different types and directions, in representing the flowchart steps and describing the flowchart processes, in realizing the flowchart constructions, creating the process flow models, designing the data flow diagrams, and many other flowcharting related diagrams. ConceptDraw PRO software maximally facilitates the drawing process by means of included predesigned vector objects, which only need to be dragged to your ConceptDraw document from the corresponding library and connected with smart connectors. This way lets equally easy make the simple flowcharts, as well as flowcharts of complex processes and procedures.Linux Audit Flowchart Example. Flowchart Examples
Create your own Linux audit flowcharts using the ConceptDraw PRO diagramming and vector drawing software extended with the Audit Flowcharts solution from the Finance and Accounting area of ConceptDraw Solution Park. This flowchart example describing auditd, the linux audit tool.How To Create a Workflow Diagram
A workflow diagram is less general notation than a process flow diagram. Workflow as a term can apply to organizational process which involves people, resources, documents, sort of data, for instance; whereas a process is general collection of steps occuring in any sort of activity. That is why process flow diagram can be used as workflow diagram to describe business process, data flow or department interactions. The fastest way to create a workflow diagram is using pre-designed workflow template. ConceptDraw PRO with the Workflow Diagrams solution delivers rich set of workflow diagram templates you may start from.Use Case Diagrams technology with ConceptDraw PRO
Use case diagrams are used at the development of software and systems for definition of functional system requirements or system of systems. Use case diagram presents the consecution of object’s actions (user’s or system’s) which are executed for reaching the definite result.Value stream with ConceptDraw PRO
The Value stream is a totality of all actions on the projection, order composition and production: starting from creation a product project to launching this product, from order to delivery, from extraction of raw materials to ready product manufacturing. Value stream mapping is a process of visualization of these actions and creation of a detailed and graphical map.- Plumbing and Piping Plans | Telecommunication Network Diagrams ...
- Basic Flowchart Symbols and Meaning | Agile Methodology | Scrum ...
- Agile Mind Maps: Exploring the User Wishes | Scrum | Agile ...
- Basic Flowchart Symbols and Meaning | Best Program to Make ...
- Agile Methodology | Agile Mind Maps: Exploring the User Wishes ...
- Basic Flowchart Symbols and Meaning | Process Flowchart ...
- Structured Systems Analysis and Design Method (SSADM) with ...
- PM Agile
- Basic Flowchart Symbols and Meaning | Process Flowchart | How to ...
- Basic Flowchart Symbols and Meaning | Process Flowchart | Flow ...
- Basic Flowchart Symbols and Meaning | Process Flowchart ...
- Process Flowchart | Basic Flowchart Symbols and Meaning | Cross ...
- PM Docs | Process Flowchart | Basic Flowchart Symbols and ...
- ConceptDraw PRO Compatibility with MS Visio | Visio Files and ...
- Basic Diagramming | Quality | Marketing | Network Of Objective ...
- Process Flowchart | UML Deployment Diagram Example - ATM ...
- ConceptDraw Solution Park | Scrum Workflow | PM Agile | Top ...
- Agile Methodology | SSADM Diagram | Scrum Workflow | Agile ...
- Agile Methodology | PM Agile | How to Create an IDEF0 Diagram for ...


