SSADM Diagram
The vector stencils library SSADM from the solution Systems engineering contains specific symbols of SSADM diagrams for ConceptDraw PRO diagramming and vector drawing software. The Systems engineering solution is contained in Software Development area of ConceptDraw Solution Park. The example below illustrates the waterfall model used in SSADM. This model involves 5 stages of developing a product such as requirements specification and its' analysis, design, coding and testing.Agile Methodology
Agile methodology is an excellent alternative to waterfall and traditional sequential development. ConceptDraw PRO software extended with SCRUM Workflow solution is ideal for quick and easy designing various diagrams, charts, mind maps and schematics illustrating software development using Agile methodologies, and in particular Scrum methodology.HelpDesk
Agile Mind Maps: Exploring the User Wishes
Agile method advocate use cases and user stories, but there are no standard processes or guides available to help gather user requirements. That is why documenting user requirements can be challenging. Without strong communication experience the scrum process can collapse, leading towards unfruitful requirements and imperfect software. This article offers a path to overcome these hurdles through the simplicity and clearness of mind mapping. ConceptDraw Scrum Worflow solution lets explore the user requirements for your Agile development project before they are formalized. You can easily create professional Mind Maps that will effectively collect and structure the information on what a user actually wants, or the “User Wish.”
 Scrum Workflow
The Scrum Workflow Solution extends the capabilities of ConceptDraw PRO 10 with a large collection of professionally-designed samples and a selection of ready-to-use scrum design elements: scrum diagrams and arrows, scrum icons of people, artifacts, workflow, workspace and other colorful scrum clipart, and also scrum charts.
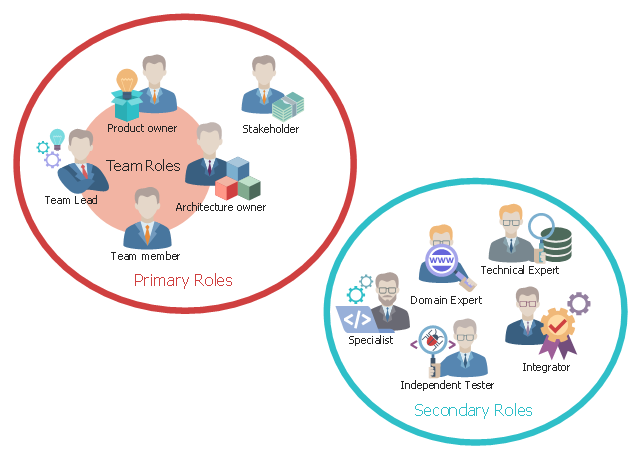
This agile software development infographic example illustrates roles in disciplined agile delivery (DAD).
"Disciplined agile delivery (DAD) is a process decision framework that enables simplified process decisions around incremental and iterative solution delivery. DAD builds on the many practices espoused by advocates of agile software development, including Scrum, agile modeling, lean software development, and others." [Disciplined agile delivery. Wikipedia]
The infographic sample "Roles on DAD teams" was created using the ConceptDraw PRO software extended with the Scrum solution from the Project Management area of ConceptDraw Solution Park.
Used Solutions
HelpDesk
How to Create an IDEF0 Diagram for an Application Development
IDEF0 methods are intended to model the functions of a process, creating a graphical model that displays: what controls the function, who makes it, what resources are used and how they are connected with other functions. The IDEF0 tool is used to model the decisions, actions, and activities of a software system during the development process . IDEF0 diagram graphically depicts a model of a desired version of the application. ConceptDraw PRO allows you to create and communicate the IDEF0 diagrams of any complexity.Scrum
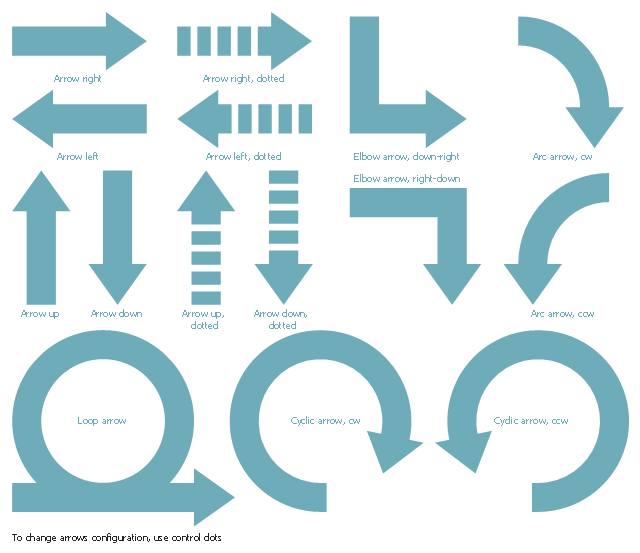
What is Scrum? Scrum is the famous agile software development methodology which depicts an iterative and incremental approach for the work on the complex projects. Use ConceptDraw PRO diagramming and vector drawing software extended with SCRUM Workflow solution to draw various types of professional-looking Scrum Charts, Scrum Workflow Diagrams, Scrum Mind Maps, Scrum boards and attractive Scrum Infographics.The vector stencils library "Scrum arrows" contains 15 shapes.
Use it to design your agile software development diagrams and scrum infographics with ConceptDraw PRO software.
"Agile software development is a set of principles for software development in which requirements and solutions evolve through collaboration between self-organizing, cross-functional teams. It promotes adaptive planning, evolutionary development, early delivery, and continuous improvement, and it encourages rapid and flexible response to change. Agile itself has never defined any specific methods to achieve this, but many have grown up as a result and have been recognized as being 'Agile'." [Agile software development. Wikipedia]
The diagram shapes sample "Design elements - Scrum arrows" is included in the Scrum solution from the Project Management area of ConceptDraw Solution Park.
Scrum process work items and workflow
Teams working with Scrum methodology use the product backlog items (PBIs), bug work item types (WITs), reports and dashboards. SCRUM Workflow solution for ConceptDraw PRO software offers collection of samples, variety of predesigned objects, clipart and graphic elements, a set of Scrum process work items and workflow which are developed for agile teams working using Scrum.The vector stencils library "Scrum people" contains 30 icons: scrum master, product owner, development team, etc.
Use this clipart set to design your agile software development diagrams and infographics with ConceptDraw PRO software.
"There are three core roles in the scrum framework. These core roles are those committed to the project in the scrum process — they are the ones producing the product (objective of the project). They represent the scrum team. ...
Product owner
The product owner represents the stakeholders and is the voice of the customer, who is accountable for ensuring that the team delivers value to the business. The product owner writes (or has the team write) customer-centric items (typically user stories), ranks and prioritizes them, and adds them to the product backlog. ...
Development team
The development team is responsible for delivering potentially shippable increments (PSIs) of product at the end of each sprint (the sprint goal). A team is made up of 3–9 individuals who do the actual work (analyse, design, develop, test, technical communication, document, etc.). Development teams are cross-functional, with all of the skills as a team necessary to create a product increment. The development team in scrum is self-organizing...
Scrum master
Scrum is facilitated by a scrum master, who is accountable for removing impediments to the ability of the team to deliver the product goals and deliverables. The scrum master is not a traditional team lead or project manager, but acts as a buffer between the team and any distracting influences. The scrum master ensures that the scrum process is used as intended. The scrum master helps ensure the team follows the agreed scrum processes, often facilitates key sessions, and encourages the team to improve." [Scrum (software development). Wikipedia]
The clip art sample "Design elements - Scrum people" is included in the Scrum solution from the Project Management area of ConceptDraw Solution Park.
Used Solutions
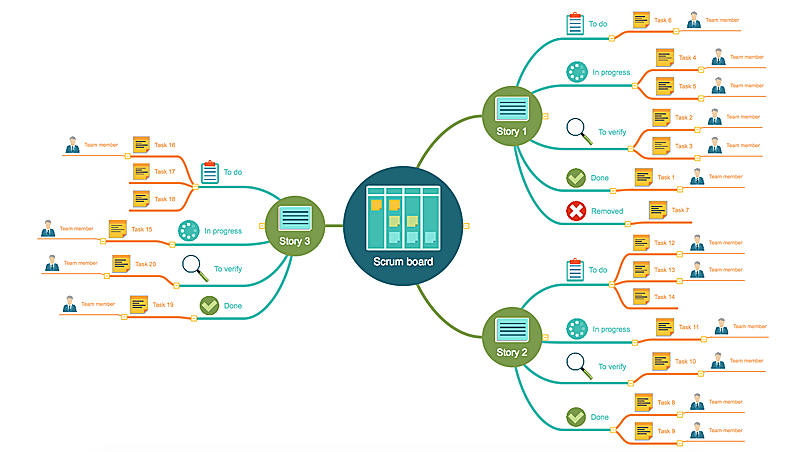
Scrum board
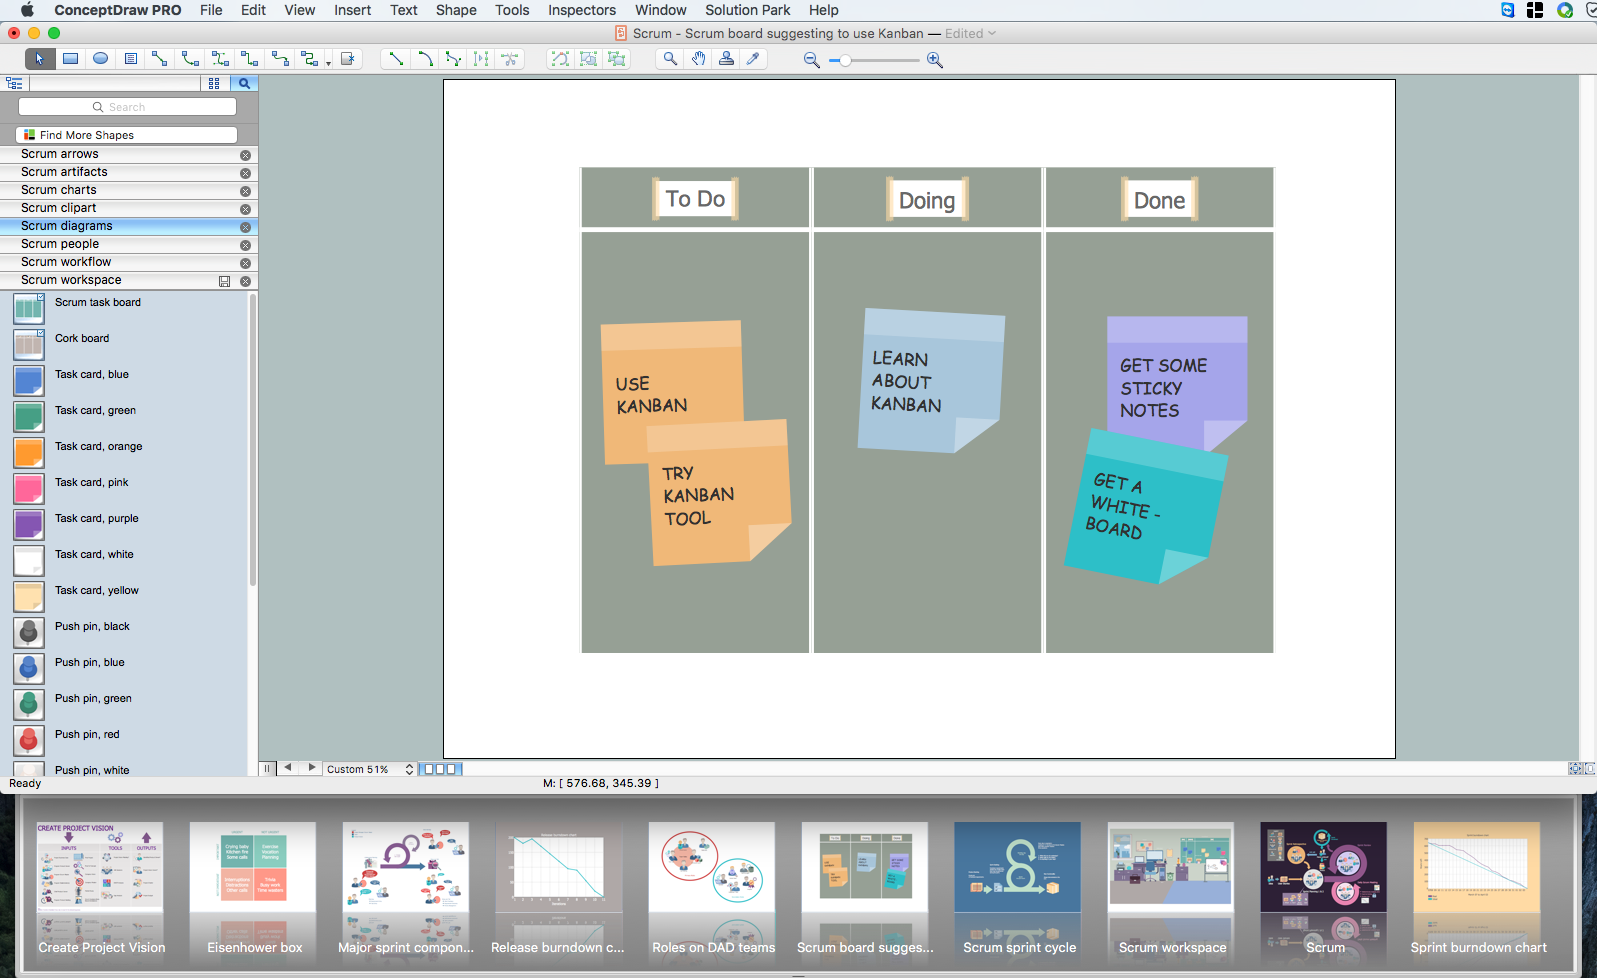
ConceptDraw diagramming and vector drawing software extended with SCRUM Workflow solution from the Project Management area of ConceptDraw Solution Park is an ideal scrum tool and powerful software for creating pictorial and professional-looking Scrum board for easy tracking the workflow, for facilitating daily synchronization and productivity improvement.The vector stencils library "Scrum artifacts" contains 52 icons.
Use this clipart set to design your agile software development diagrams and infographics with ConceptDraw PRO software.
"Product backlog
The product backlog comprises an ordered list of requirements that a scrum team maintains for a product. It consists of features, bug fixes, non-functional requirements, etc.—whatever must be done to successfully deliver a viable product. The product owner orders the product backlog items (PBIs) based on considerations such as risk, business value, dependencies, and date needed. ...
Sprint backlog
The sprint backlog is the list of work the development team must address during the next sprint. The list is derived by the scrum team selecting product backlog items from the top of the product backlog until the development team feels it has enough work to fill the sprint. This is done by the development team asking "Can we also do this?" and adding product backlog items to the sprint backlog. The development team should keep in mind its past performance assessing its capacity for the new sprint, and use this as a guide line of how much "effort" they can complete.
The product backlog items may be broken down into tasks by the development team. Tasks on the sprint backlog are never assigned; rather, tasks are signed up for by the team members as needed according to the set priority and the development team member skills. This promotes self-organization of the development team, and developer buy-in. ...
Sprint burn-down chart
The sprint burndown chart is a public displayed chart showing remaining work in the sprint backlog. Updated every day, it gives a simple view of the sprint progress. ...
Release burn-down chart
The release burndown chart is the way for the team to track progress and provide visibility. The release burndown chart is updated at the end of each sprint by the scrum master. The horizontal axis of the release burndown chart shows the sprints; the vertical axis shows the amount of work remaining at the start of each sprint." [Scrum (software development). Wikipedia]
The clip art sample "Design elements - Scrum artifacts" is included in the Scrum solution from the Project Management area of ConceptDraw Solution Park.
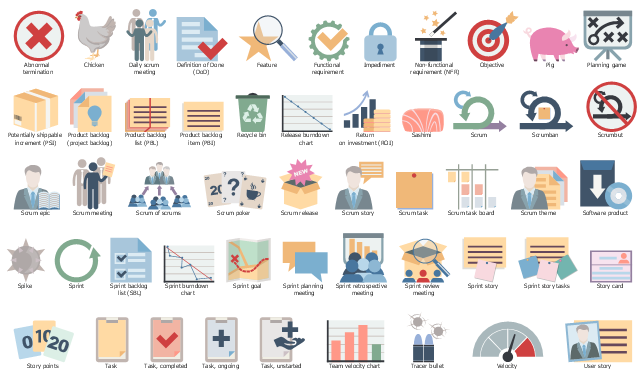
The vector stencils library "Scrum workflow" contains 39 icons.
Use this clipart set to design your agile software development diagrams and flowcharts with ConceptDraw PRO software.
"A sprint (or iteration) is the basic unit of development in scrum. The sprint is a timeboxed effort; that is, it is restricted to a specific duration. The duration is fixed in advance for each sprint and is normally between one week and one month, with two weeks being the most common.
Each sprint starts with a sprint planning event that aims to define a sprint backlog, identify the work for the sprint, and make an estimated commitment for the sprint goal. Each sprint ends with a sprint review and sprint retrospective, that reviews progress to show to stakeholders and identify lessons and improvements for the next sprints.
Scrum emphasizes working product at the end of the sprint that is really done. In the case of software, this likely includes that the software has been integrated, fully tested, end-user documented, and is potentially shippable." [Scrum (software development). Wikipedia]
The clip art sample "Design elements - Scrum workflow" is included in the Scrum solution from the Project Management area of ConceptDraw Solution Park.
Used Solutions
The vector stencils library "Scrum workspace" contains 21 icons.
Use this clipart set to design your agile software development diagrams and infographics with ConceptDraw PRO software.
"... a list of all the things that ... should be visible within the ideal agile workspace:
Big Visible Charts. ... the sprint burndown chart, showing the number of hours remaining as of each day of the current sprint. ... big visible charts showing the number of passing customer acceptance tests, the pass/ fail status of tests by day, sprint and release burndown charts, number of new stories introduced to the product backlog per sprint, and more.
Additional feedback devices. In addition to big, visible charts, it is common for an agile team to use additional visual feedback devices in their workspace. One of the most common is a lava lamp that is turned on whenever the automated build is broken.
... flashing red traffic lights to indicate exceptional conditions such as an issue on a production server. Also popular are ambient orbs and Nabaztag rabbits, which are wireless programmable devices that can also be configured to change colors, speak messages, or wiggle their ears as a team desires. ...
Everyone on your team. Each person on the team should ideally be able to see each other person on the team. This absolutely includes the ScrumMaster and ideally includes the product owner. ...
The sprint backlog. One of the best ways to ensure that everything necessary is completed in the sprint is to make the sprint backlog visible. The best way to do that is by displaying the sprint backlog on a wall, ideally in the form of a task board ...
The product backlog. One problem with running an endless series of sprints is that each can feel disconnected or isolated from the whole of a planned released or related set of new capabilities. A good way to reduce the impact of this problem is by displaying the product backlog somewhere clearly visible. ... tack the index cards with those upcoming user stories on a wall where all can see them. This allows team members to see how the user stories they are working on in the current sprint relate to others that are coming soon.
At least one big white board. ... Locating this in the team’s common workspace encourages spontaneous meetings." [mountaingoatsoftware.com/ blog/ the-ideal-agile-workspace]
The clip art sample "Design elements - Scrum workspace" is included in the Scrum solution from the Project Management area of ConceptDraw Solution Park.
- Agile Software Development Method
- SSADM Diagram | Scrum | Agile Methodology | Agile Software ...
- Basic Flowchart Symbols and Meaning | Agile Methodology | Scrum ...
- Agile Methodology | How to Create an IDEF0 Diagram for an ...
- SSADM Diagram | Agile Methodology | Scrum process work items ...
- Agile Methodology | Scrum Workflow | Scrum | Scrum Development ...
- Agile Methodology | How to Create an IDEF0 Diagram for an ...
- Agile Software Development With Scrum Pdf
- Agile Software Development Process
- Agile Methodology | Scrum Workflow | Agile Mind Maps: Exploring ...
- Create Workflow Of Software Development
- Agile Methodology | Agile Mind Maps: Exploring the User Wishes ...
- Scrum | Scrum board | Agile Methodology | Agile Software ...
- SSADM Diagram | Waterfall Bar Chart | Best Program to Make ...
- Methodology Diagram Template
- Scrum | Agile Mind Maps: Exploring the User Wishes | Scrum ...
- Agile Methodology | Scrum process work items and workflow | PM ...
- Agile Methodology | PM Agile | SSADM Diagram | What Is Agile ...
- Agile Methodology | SSADM Diagram | Scrum | Agile Approach


