HelpDesk
How to Create Flowchart Using Standard Flowchart Symbols
Flowcharts are used to display an algorithm for consistent execution of certain steps. Flowchart is probably the easiest way to make a graphical representation of any process. Flowcharts use the set of standard geometric symbols and arrows to define relationships. ConceptDraw DIAGRAM allows you to create professional flowchart quickly and easily. The ability to create flowcharts is contained in the Flowcharts solution. The solution provides a set of special tools for creating flowcharts.HelpDesk
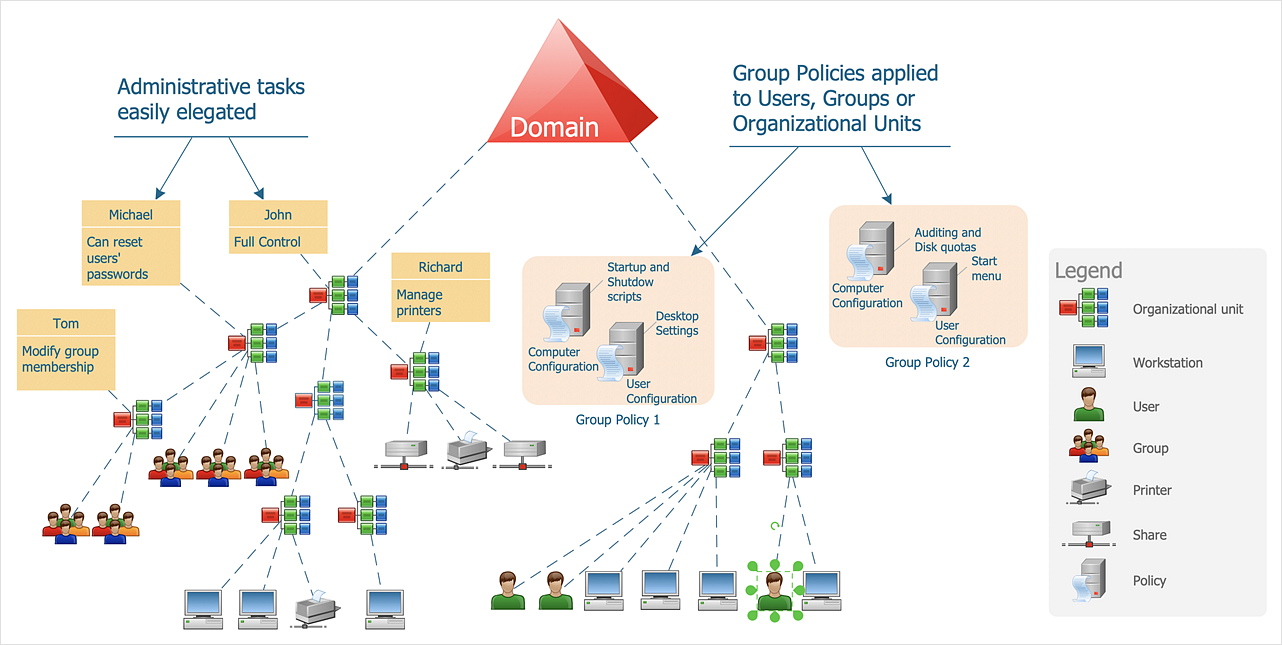
How to Create an Active Directory Diagram
Active Directory Service represents a distributed database that contains all the domain objects. The Active Directory domain environment is a single point of authentication and authorization of users and applications across the enterprise. The domain of the organization and deployment of Active Directory Service are exactly the cornerstones of the enterprise IT infrastructure. The logical diagrams of MS Windows Active Directory structure are used to visually support an enterprise IT infrastructure planning and management. ConceptDraw DIAGRAM allows you to make AD Diagrams quickly and easily using the set of special libraries.HelpDesk
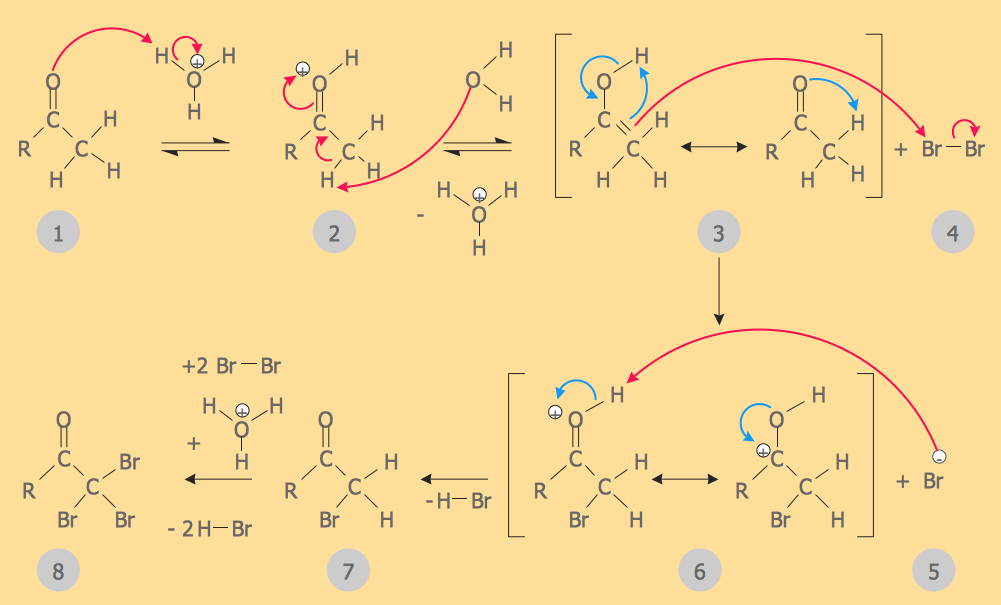
How to Draw Chemistry Structures
Making chemistry drawings for science and education purposes involves many different elements that can be managed using ConceptDraw DIAGRAM. ConceptDraw Chemistry solution can be used as a tool for creating chemical schemes and diagrams of chemical lab set-ups and labware, formulas, reaction schemes, and molecular structures. With ConceptDraw DIAGRAM you can easily create and communicate chemistry drawings of any complexity.Business diagrams & Org Charts with ConceptDraw DIAGRAM
The business diagrams are in great demand, they describe the business processes, business tasks and activities which are executed to achieve specific organizational and business goals, increase productivity, reduce costs and errors. They let research and better understand the business processes. ConceptDraw DIAGRAM is a powerful professional cross-platform business graphics and business flowcharting tool which contains hundreds of built-in collections of task-specific vector stencils and templates. They will help you to visualize and structure information, create various Business flowcharts, maps and diagrams with minimal efforts, and add them to your documents and presentations to make them successful. Among them are Data flow diagrams, Organization charts, Business process workflow diagrams, Audit flowcharts, Cause and Effect diagrams, IDEF business process diagrams, Cross-functional flowcharts, PERT charts, Timeline diagrams, Calendars, Marketing diagrams, Pyramids, Target diagrams, Venn diagrams, Comparison charts, Analysis charts, Dashboards, and many more. Being a cross-platform application, ConceptDraw DIAGRAM is very secure, handy, free of bloatware and one of the best alternatives to Visio for Mac users.
HelpDesk
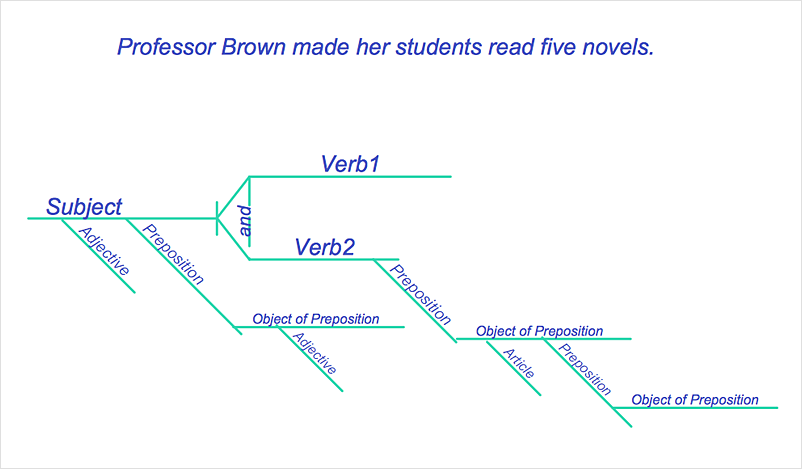
How to Diagram Sentences
Diagramming sentences is a playful, fun way to learning English Grammer. Sentences can be very complex, and can contain many different parts of speech which implicate many different grammatical rules. Diagramming sentences will help you to make sure every parts of your sentence are grammatically correct, and provides you with more comprehensive understanding of the English Language. A Sentence Diagram displays the parts of a sentence as a diagram in order to show the relationship of words and groups of words within the sentence. Sentence Diagram shows the relationship between the proposal of its parts. This is a good way to teach grammar! Sentence Diagram helps to make the writing more coherent as well as more interesting to read. ConceptDraw DIAGRAM allows you to create clear sentence diagrams using the special templates and vector stencils library.- Basic Flowchart Symbols and Meaning | Euclidean algorithm ...
- Organizational Structure | Process Flowchart | Basic Flowchart ...
- Basic Flowchart Symbols and Meaning | Flowchart design ...
- Solving quadratic equation algorithm - Flowchart | Basic ...
- Basic Flowchart Symbols and Meaning | Process Flowchart | Create ...
- Euclidean algorithm - Flowchart | Solving quadratic equation ...
- Flowchart Definition | How to Draw a Matrix Organizational Chart ...
- Credit Card Processing System UML Diagram | Basic Flowchart ...
- Solving quadratic equation algorithm - Flowchart | Basic ...
- Flowchart Programming Project. Flowchart Examples | Flowchart ...
- Free Sample Business Structure Flowchart Templates
- Basic Flowchart Symbols and Meaning | Process Flowchart ...
- Create Organizational Chart | How To use Kitchen Design Software ...
- Basic Flowchart Symbols and Meaning | Process Flowchart | Types ...
- Basic Flowchart Symbols and Meaning | Flow chart Example ...
- Solving quadratic equation algorithm - Flowchart | Simple Flow ...
- Flow Chart Of Algorithm Example 7 Diagram
- Develop The Flowchart For The Developed Algorithm
- Solving quadratic equation algorithm - Flowchart | Basic Flowchart ...


