The vector stencils library "AWS Analytics" contains 9 Amazon Web Services analytics icons: Amazon EMR, Cluster, MapR M3 engine, MapR M5 engine, MapR M7 engine, Engine, Amazon Kinesis, Kinesis-enabled app, AWS Data Pipeline. Use it to draw AWS architecture diagrams of cloud service. AWS analytics services include: Hadoop, Real-time, Machine Learning, Data Warehouse, Data Pipelines. The symbols example "AWS Analytics - Vector stencils library" was created using the ConceptDraw PRO diagramming and vector drawing software extended with the AWS Architecture Diagrams solution from the Computer and Networks area of ConceptDraw Solution Park.
The vector stencils library "AWS Analytics" contains 9 Amazon Web Services analytics icons: Amazon Elastic MapReduce, Amazon Kinesis, AWS Data Pipeline.
Use it to draw AWS architecture diagrams.
The AWS icons example "Design elements - AWS Analytics" was created using the ConceptDraw PRO diagramming and vector drawing software extended with the AWS Architecture Diagrams solution from the Computer and Networks area of ConceptDraw Solution Park.
Use it to draw AWS architecture diagrams.
The AWS icons example "Design elements - AWS Analytics" was created using the ConceptDraw PRO diagramming and vector drawing software extended with the AWS Architecture Diagrams solution from the Computer and Networks area of ConceptDraw Solution Park.
Spatial Data Analysis
ConceptDraw PRO diagramming and vector drawing software extended with Pictorial Infographics Solution from the “What are Infographics” Area is the best for Spatial Data Analysis. You have a perfect possibility to make sure this right now.Best Diagramming
Need to draw a diagram, process chart, flowchart, organizational chart, graphic design? ConceptDraw can help you to make professional graphic documents quickly.
The vector stencils library "AWS simple icons v2.0" contains 94 symbol icons of Amazon Web Services (AWS) elements for drawing AWS cloud architecture diagrams.
"Amazon Web Services offers a broad set of global compute, storage, database, analytics, application, and deployment services that help organizations move faster, lower IT costs, and scale applications. These services are trusted by the largest enterprises and the hottest start-ups to power a wide variety of workloads including: web and mobile applications, data processing and warehousing, storage, archive, and many others." [aws.amazon.com/ products/ ]
The symbols example "AWS simple icons v2.0 - Vector stencils library" was created using the ConceptDraw PRO diagramming and vector drawing software extended with the AWS Architecture Diagrams solution from the Computer and Networks area of ConceptDraw Solution Park.
www.conceptdraw.com/ solution-park/ computer-networks-aws
The vector stencils library "AWS Mobile Services" contains 6 Amazon Web Services mobile services icons: Amazon Cognito, Amazon Simple Notification Service, Amazon Mobile Analytics.
Use it to draw Amazon Web Services architecture diagrams.
The AWS icons example "Design elements - AWS Mobile Services" was created using the ConceptDraw PRO diagramming and vector drawing software extended with the AWS Architecture Diagrams solution from the Computer and Networks area of ConceptDraw Solution Park.
Pie Donut Chart. Pie Chart Examples
This sample shows the Pie Donut Chart. It was created in ConceptDraw PRO diagramming and vector drawing software using the ready-to-use object from the Pie Charts Solution from Graphs and Charts area of ConceptDraw Solution Park. The Pie Donut Chart visualizes the percentage of parts of the whole and looks like as a ring divided into sectors. Pie Donut Charts are widely used in the business, statistics, analytics, mass media.Line Chart Template for Word
This sample was created in ConceptDraw PRO diagramming and vector drawing software using the Line Graphs Solution from Graphs and Charts area of ConceptDraw Solution Park. This sample shows the Line Chart of annual percentage change. The Line Chart allows you to clearly see the changes of data over the time.Geo Map - Canada
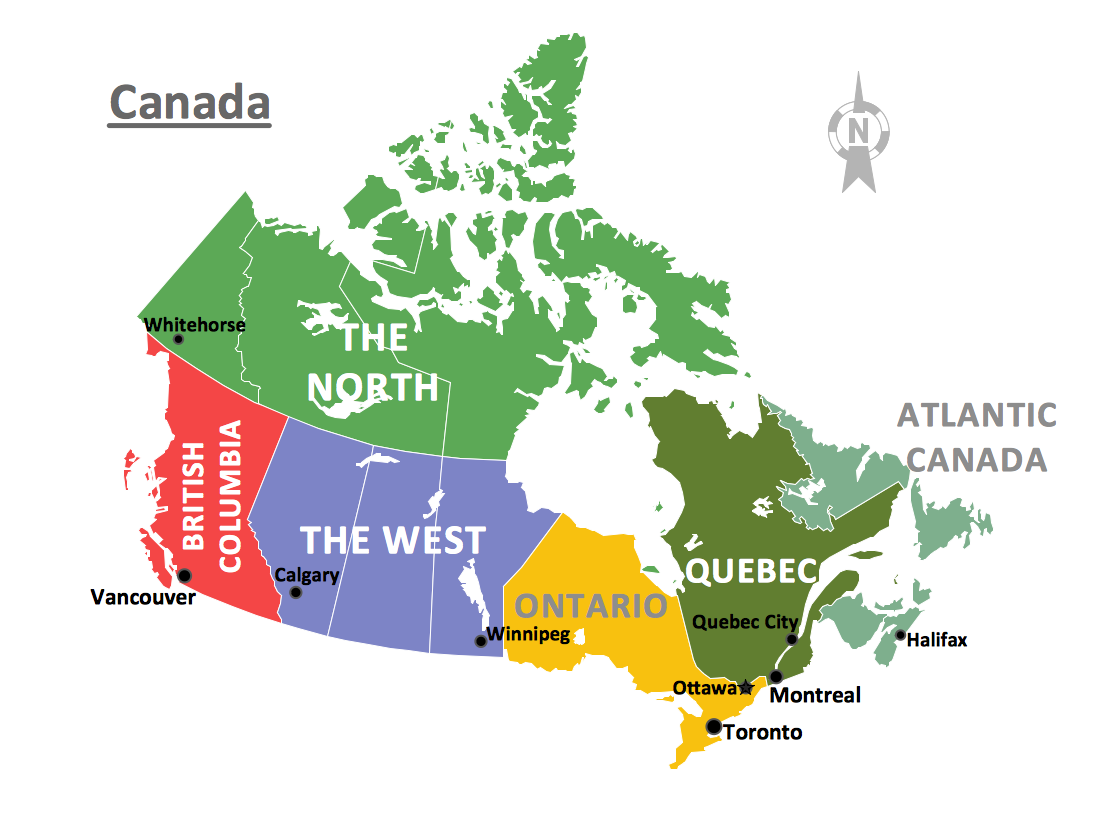
Canada is a country in North America consisting of 10 provinces and 3 territories. ConceptDraw PRO is idea to draw the geological maps of Canada from the pre-designed vector geo map shapes.Percentage Pie Chart. Pie Chart Examples
This sample was created in ConceptDraw PRO diagramming and vector drawing software using the Pie Charts Solution from Graphs and Charts area of ConceptDraw Solution Park. This sample shows the Pie Chart of the approximate air composition. You can see the percentage of oxygen, nitrogen and other gases in the air visualized on this Pie Chart.Design Pictorial Infographics. Design Infographics
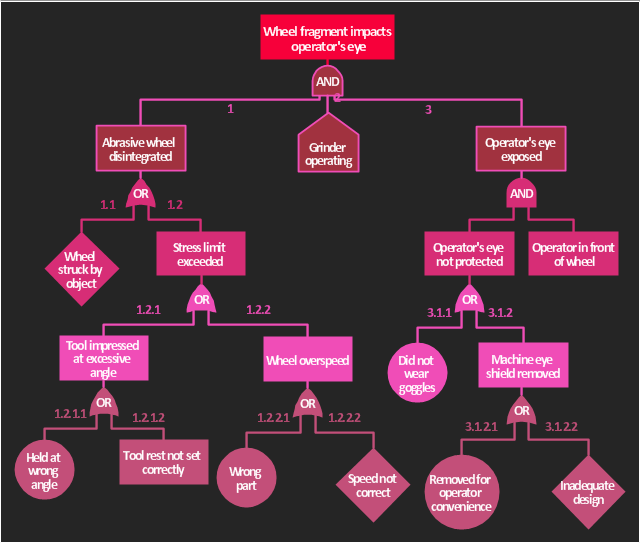
In the course of recent decades data visualization went through significant development and has become an indispensable tool of journalism, business intelligence and science. The way visual information may be conveyed is not limited simply to static or dynamic representation, it can also be interactive. Infographics can be conditionally divided into several general levels. Primarily, this is level of visualization of information, its interpretation and association on any ground. Second level can be defined as a visualization of knowledge, depiction of thoughts and ideas in the form of images or diagrams. Finally, the level of data visualization, which processes data arrays in charts, enabling the information to be more clearly perceived. You can also identify the main approaches to the creation of infographics: exploratory and narrative. Exploratory method insists on minimalist design in favor of data precision without unnecessary details and is common for scientific researches and anaThe accident analysis diagram example "Accident analytic tree" was redesigned from the picture 7-14 from the "DOE Workbook. Conducting Accident Investigations. Revision 2."
"Analytic tree analyses are well defined, useful methods that graphically depict, from beginning to end, the events and conditions preceding and immediately following an accident. An analytic tree is a means of organizing information that helps the investigator conduct a deductive analysis of any system (human, equipment, or environmental) to determine critical paths of success and failure. Results from this analysis identify the details and interrelationships that must be considered to prevent the oversights, errors, and omissions that lead to failures. In accident investigations, this type of analysis can consist of both failure paths and success paths, and can lead to neutral, negative, or positive conclusions regarding accident severity.
TIP.
An analytic tree enables the user to:
(1) Systematically identify the possible paths from events to outcome.
(2) Display a graphical record of the analytical process.
(3) Identify management system weaknesses and strengths."
[homer.ornl.gov/ sesa/ corporatesafety/ aip/ docs/ workbook/ Rev2/ chpt7/ chapt7.htm]
The FTA diagram example "Accident analytic tree" was created using the ConceptDraw PRO diagramming and vector drawing software extended with the Fault Tree Analysis Diagrams solution from the Engineering area of ConceptDraw Solution Park.
Business Report Pie. Pie Chart Examples
This sample shows the Business Report Pie Chart. The Pie Chart visualizes the data as the proportional parts of a whole, illustrates the numerical proportion. Pie Charts are very useful in the business, statistics, analytics, mass media.Azure Services
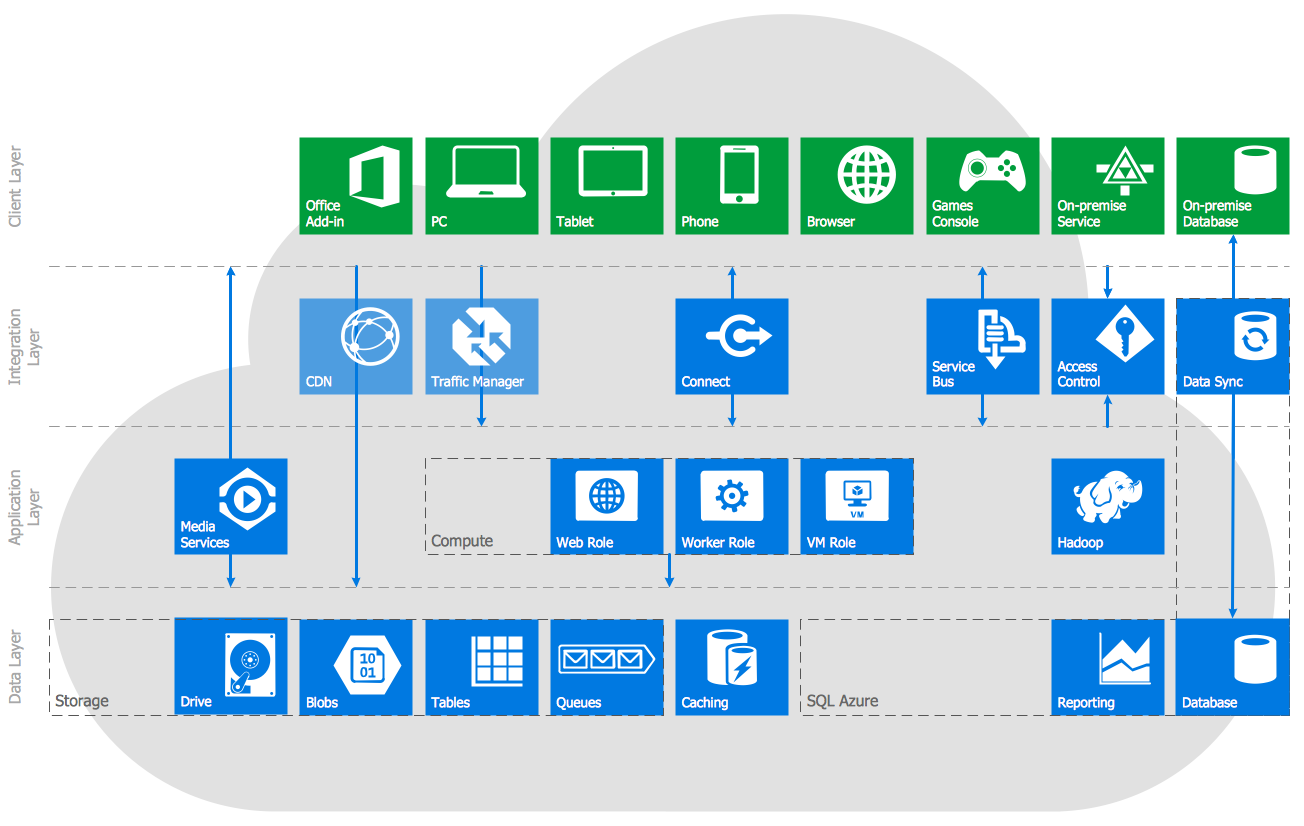
Azure is a cloud computing platform developed by Microsoft which offers the extensive infrastructure and wide set of integrated Azure services useful for effective computing, storage, analytics, databases, networking, application development and deployment. ConceptDraw PRO extended with Azure Architecture Solution from the Computer and Networks area is a powerful diagramming and vector drawing software with extensive set of useful drawing tools for easy creating Azure Architecture Diagrams and documenting Azure services.Map Infographic Design
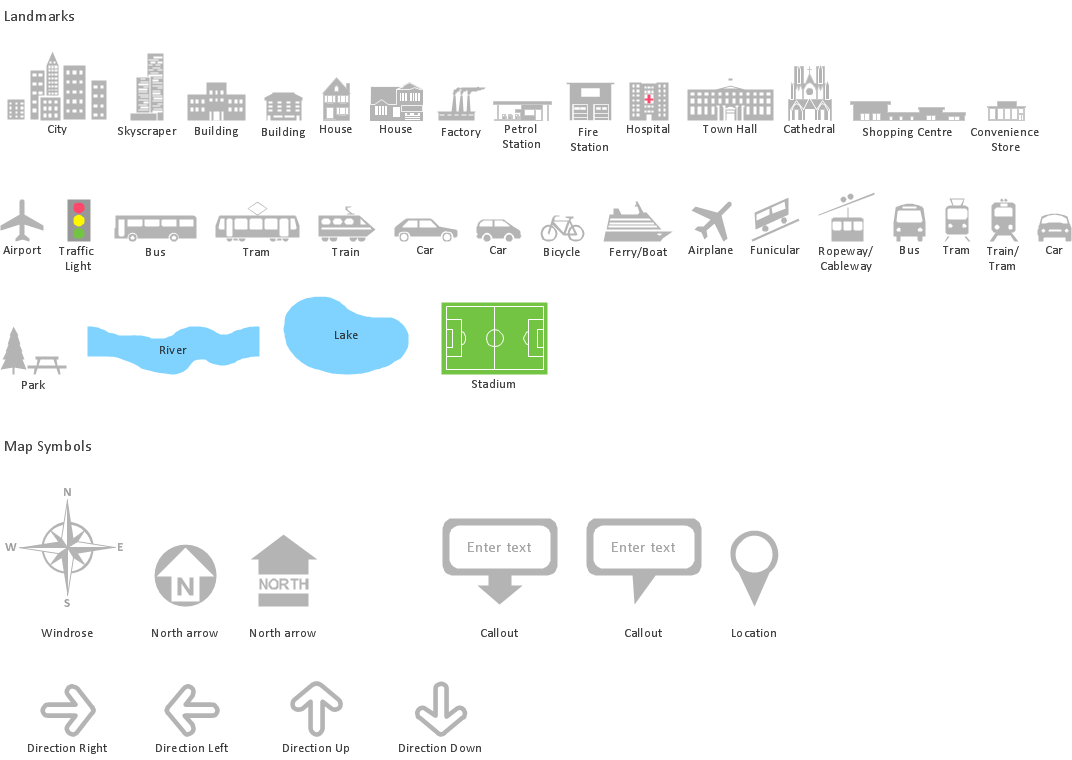
ConceptDraw collection of vector elements for infographics design.- AWS Analytics - Vector stencils library | Design elements - AWS ...
- Design elements - AWS Analytics | AWS Analytics - Vector stencils ...
- AWS Analytics - Vector stencils library | AWS Analytics - Vector ...
- AWS Analytics - Vector stencils library
- Amazon Analytics Icon
- AWS Analytics - Vector stencils library | Cisco products additional ...
- AWS simple icons - Vector stencils library | AWS Analytics - Vector ...
- Decision Tree Analytics
- Website metrics - Visual dashboard
- Accident analytic tree - FTA diagram | Fault Tree Analysis Diagrams ...
- AWS simple icons v2.0 - Vector stencils library
- AWS Application Services - Vector stencils library | Amazon Web ...
- Internet symbols - Vector stencils library | Internet symbols - Vector ...
- AWS simple icons v2.0 - Vector stencils library | AWS Application ...
- AWS simple icons v2.0 - Vector stencils library
- AWS Compute and Networking - Vector stencils library | AWS ...
- AWS icons 2.0 | AWS Simple Icons for Architecture Diagrams ...
- How To Create Onion Diagram | HR department - Vector stencils ...
- UML Diagram | Cisco IBM. Cisco icons, shapes, stencils and ...
- Storage Products Vector Png
