PROBLEM ANALYSIS. Relations Diagram


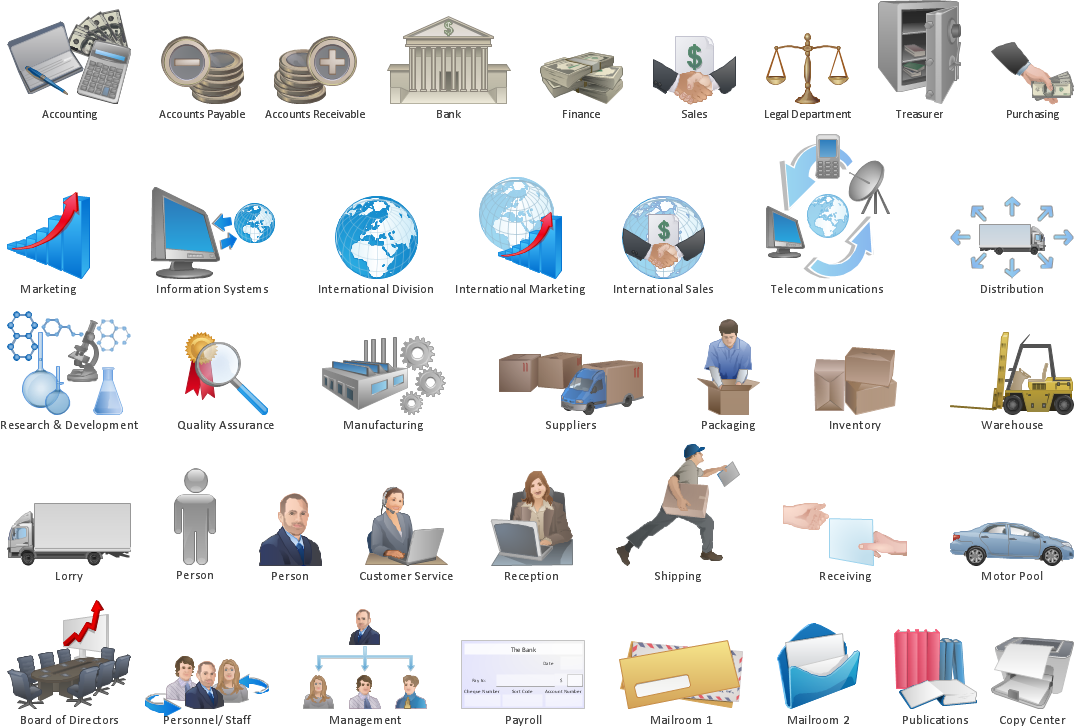
The vector stencils library "Sales steps" contains 23 sales steps symbols.
Use these sales pictograms to draw your sales flowcharts, workflow diagrams and process charts with the ConceptDraw PRO diagramming and vector drawing software.
The vector stencils library "Sales steps" is included in the Sales Flowcharts solution from the Marketing area of ConceptDraw Solution Park.
Accept

Agree

Analyze

Attention

Сheckbox

Checkout

Commit

Hand over

Log in

Manual filling

Meeting

Pay

Phone

Presentation

Problem

Question

Receive

Refuse

Run

Secure payment

Shipping

Stop

Synchronization

The vector stencils library "HR steps" contains 32 HR workflow symbols.
Use this HR icon set to draw your HR flowcharts, workflow diagrams and process charts with the ConceptDraw PRO diagramming and vector drawing software.
The HR pictograms library "HR steps" is included in the HR Flowcharts solution from the Management area of ConceptDraw Solution Park.
Use this HR icon set to draw your HR flowcharts, workflow diagrams and process charts with the ConceptDraw PRO diagramming and vector drawing software.
The HR pictograms library "HR steps" is included in the HR Flowcharts solution from the Management area of ConceptDraw Solution Park.
Accept

Agree

Analyze

Appraisal

Attention

Сheckbox

Checkout

Commit

Grievance procedures

Hand over

Interview

Job analysis

Job offer

Job search

Learning

Log in

Manual filling

Meeting

Pay

Phone interview

Presentation

Problem

Question

Receive

Refuse

Run

Secure payment

Select staff

Shipping

Stop

Synchronization

Video conference

Competitor Analysis

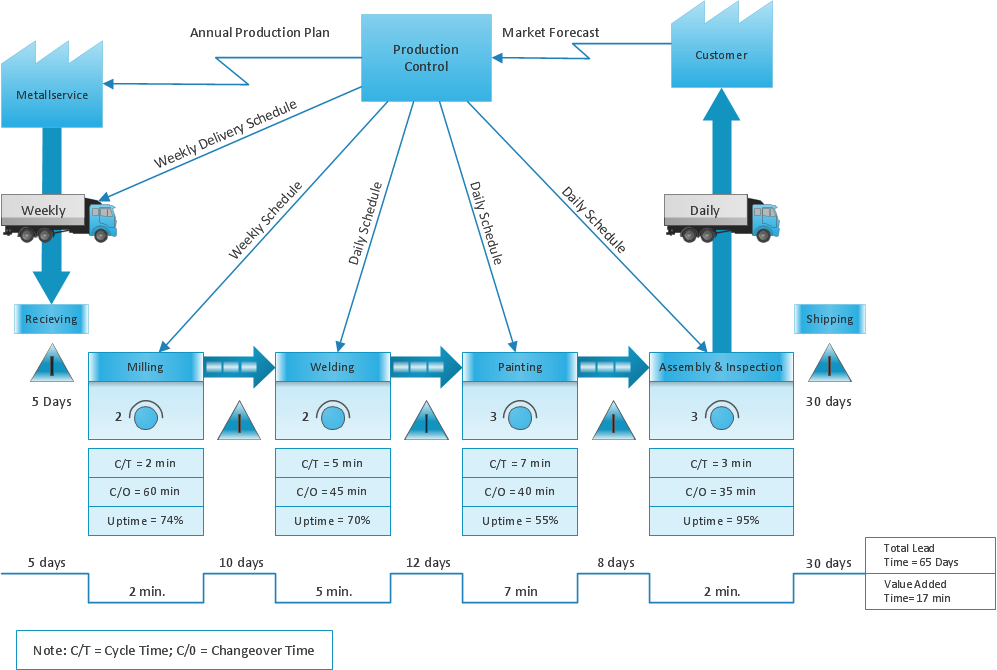
The Lean Enterprise Value Stream Mapping
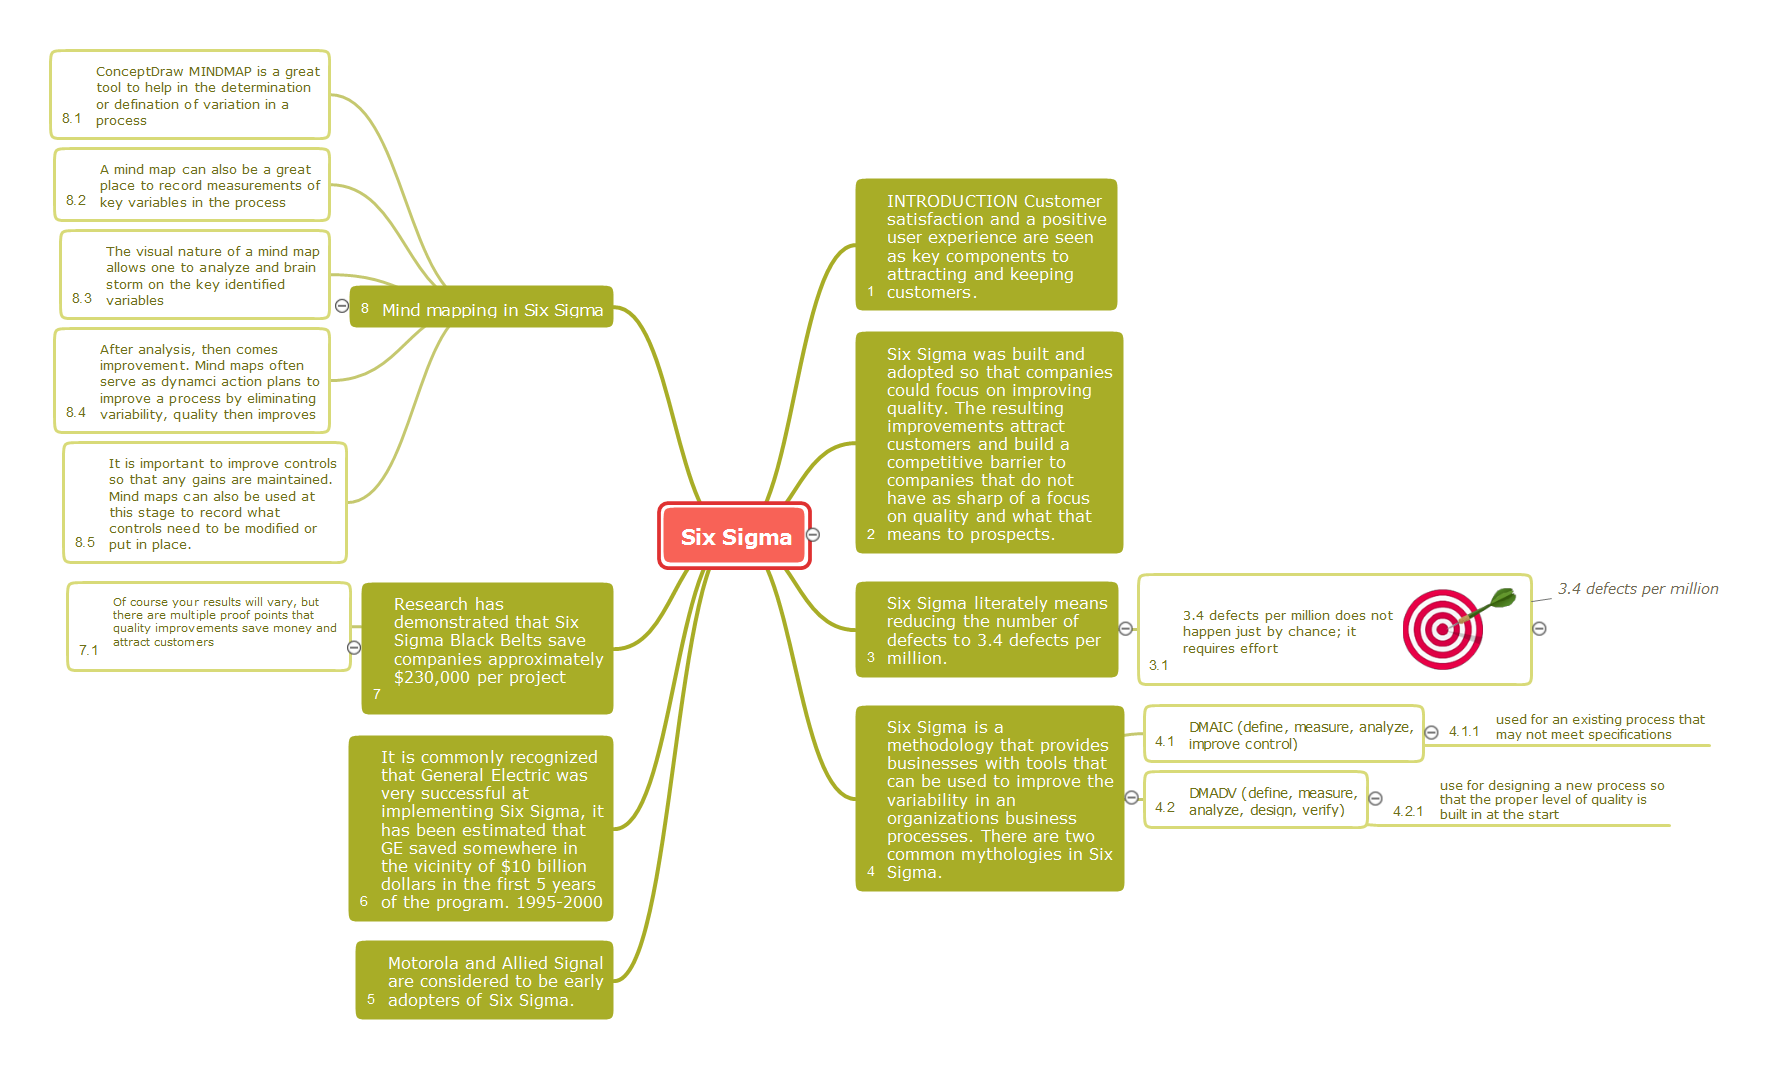
6 sigma
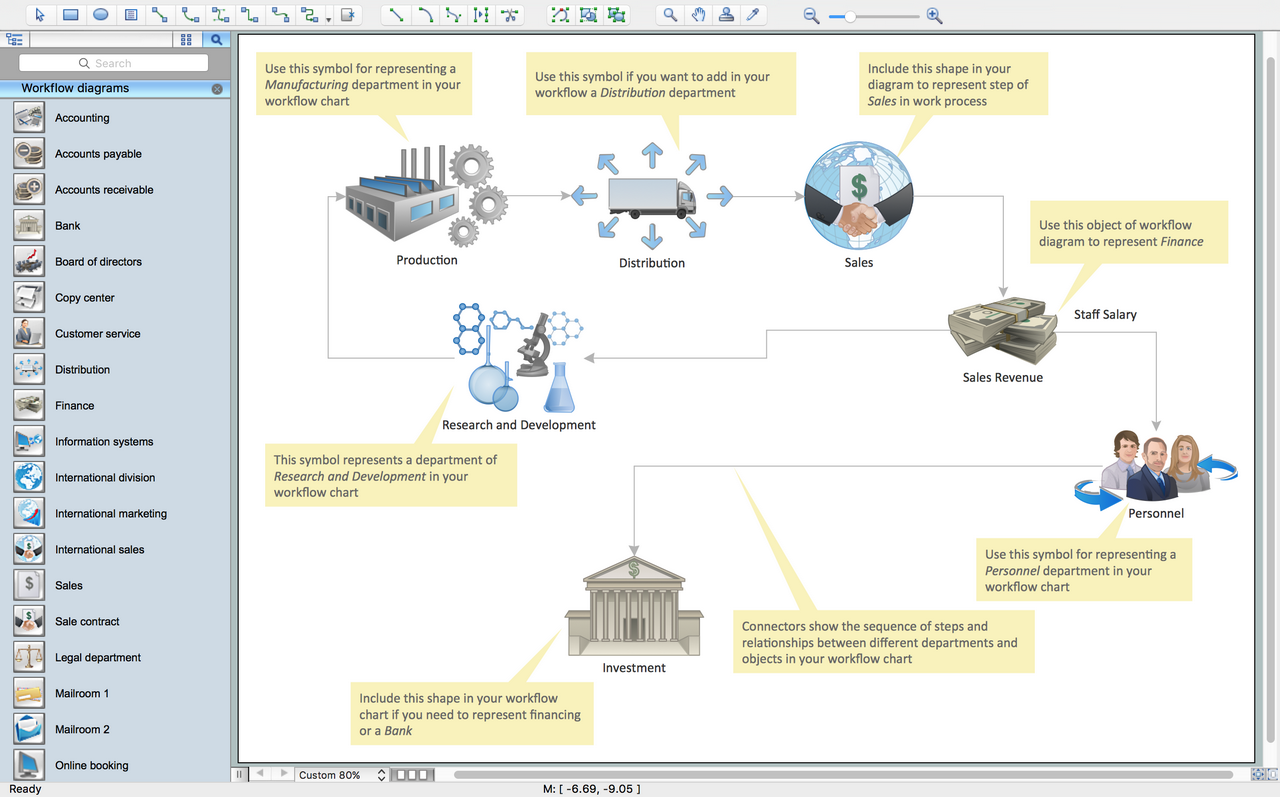
Workflow Diagram

Drawing Workflow Diagrams
DFD Flowchart Symbols

Work Flow Process Chart

Workflow Diagram Template

7 Management & Planning Tools

Pyramid Diagram

Create Workflow Diagram
- Cross-Functional Flowchart | Draw And Analyze The Dfd Of Book ...
- PROBLEM ANALYSIS Relations Diagram | Root Cause Analysis ...
- Analyze Clipart Png
- Analyze Of Partnership Firm
- How To Analyze Assembly Drawing In Mechanical Engineering
- Analyze Flow Chart
- Solutions To Analyze The Quick Finance Company Network Diagram
- Sentences Analyze By Sketching
- Draw And Analyze The Data Management Cycle
- Analyze An Operational Accounting And Financial Information ...
- Analyze In Vector
- Sales steps - Vector stencils library
- HR steps - Vector stencils library
- Analyze Vector
- PROBLEM ANALYSIS. Prioritization Matrix | PROBLEM ANALYSIS ...
- Program Evaluation and Review Technique (PERT) with ...
- Analyze Cause And Effect Mind Map
- Cause and Effect Analysis - Fishbone Diagrams for Problem Solving ...
- Value stream map - Template
- Root cause analysis tree diagram - Template | Cause and Effect ...