This site uses cookies. By continuing to browse the ConceptDraw site you are agreeing to our Use of Site Cookies.

Basic Flowchart Symbols and Meaning

Flowcharts are the best for visually representation the business processes and the flow of a custom-order process through various departments within an organization. ConceptDraw PRO diagramming and vector drawing software extended with Flowcharts solution offers the full set of predesigned basic flowchart symbols which are gathered at two libraries: Flowchart and Flowcharts Rapid Draw. Among them are: process, terminator, decision, data, document, display, manual loop, and many other specific symbols. The meaning for each symbol offered by ConceptDraw gives the presentation about their proposed use in professional Flowcharts for business and technical processes, software algorithms, well-developed structures of web sites, Workflow diagrams, Process flow diagram and correlation in developing on-line instructional projects or business process system. Use of ready flow chart symbols in diagrams is incredibly useful - you need simply drag desired from the libraries to your document and arrange them in required order. There are a few serious alternatives to Visio for Mac, one of them is ConceptDraw PRO. It is one of the main contender with the most similar features and capabilities.
How to Build a Flowchart
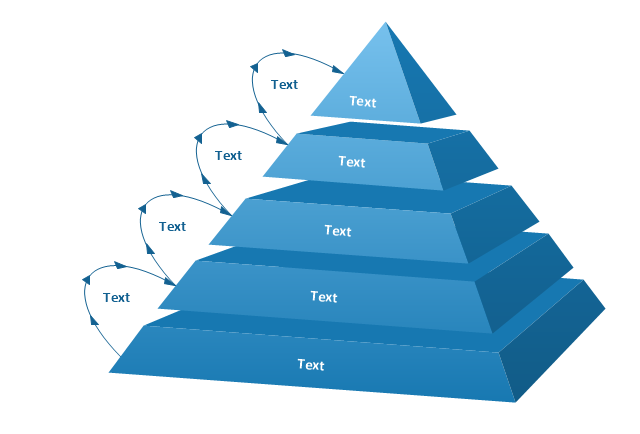
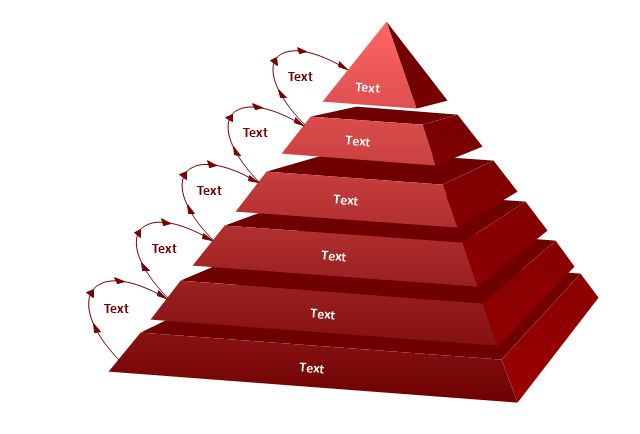
The vector stencils library "Pyramid diagrams" contains 28 templates of pyramid diagrams, triangle charts and triangular schemes.
Use these templates to create your pyramid diagrams in the ConceptDraw PRO diagramming and vector drawing software extended with the Pyramid Diagrams solution from the Marketing area of ConceptDraw Solution Park.
Pyramid 1
Pyramid 1, pyramid, triangle,
Pyramid 2
Pyramid 2, pyramid, triangle,
Pyramid 3
Pyramid 3, pyramid, triangle,
Pyramid 4
Pyramid 4, pyramid, triangle,
Pyramid 5
Pyramid 5, pyramid, triangle,
Pyramid 1 Isometric
Pyramid 1 Isometric, pyramid, triangle,
Pyramid 2 Isometric
Pyramid 2 Isometric, pyramid, triangle,
Pyramid 3 Isometric
Pyramid 3 Isometric, pyramid, triangle,
Pyramid 4 Isometric
Pyramid 4 Isometric, pyramid, triangle,
Pyramid 5 Isometric
Pyramid 5 Isometric, pyramid, triangle,
Triangle diagram, arrows
Triangle diagram, arrows, triangle diagram with circle and arrows,
Triangle diagram
Triangle diagram, triangle diagram with circles,
Triangular pyramid
Triangular pyramid, triangle diagram,
Triangular diagram
Triangular diagram, triangle diagram, triangular diagram, triangle chart, triangular chart, triangle scheme, triangular scheme,
Triangle scheme
Triangle scheme, triangle diagram with oval,
Triangle chart
Triangle chart, triangle diagram, triangular diagram, triangle chart, triangular chart, triangle scheme, triangular scheme,
Triangle chart, isometric
Triangle chart, isometric, triangle chart, triangle, pyramid, triangle diagram,
Triangular scheme
Triangular scheme, triangular Venn diagram,
Arrowed block pyramid
Arrowed block pyramid, arrowed block pyramid, triangle diagram, triangular diagram, triangle chart, triangular chart, triangle scheme, triangular scheme,
Funnel diagram
Funnel diagram, funnel diagram,
3-level funnel diagram
3-level funnel diagram, funnel diagram,
4-level funnel diagram
4-level funnel diagram, funnel diagram,
5-level funnel diagram
5-level funnel diagram, funnel diagram,
2-level pyramid diagram
2-level pyramid diagram, 3D pyramid diagram,
3-level pyramid diagram
3-level pyramid diagram, 3D pyramid diagram,
4-level pyramid diagram
4-level pyramid diagram, 3D pyramid diagram,
5-level pyramid diagram
5-level pyramid diagram, 3D pyramid diagram,
6-level pyramid diagram
6-level pyramid diagram, 3D pyramid diagram,
HelpDesk

How to Connect Objects on PC

ConceptDraw PRO provides a few options for drawing connections between objects: Direct Connectors, Smart, Arc, Bezier, Curve and Round Connectors. You can connect objects in your ConceptDraw diagram with proper connectors using the embedded automatic connection modes. This article describes how you can connect objects with connectors and how you can ascribe different types and behaviors.
Arrow 10 Technology
Arrow 10 Technology

Flowchart design. Flowchart symbols, shapes, stencils and icons

A flowchart is a type of diagram which represents an algorithm, process or workflow, displays the steps as boxes of various kinds and depicts their order by connecting them with arrows. Any business graphic document will be more colorful and understandable if will use professional-looking and visual diagrams and flowcharts. Flowchart design gives versatile presenting and explaining of the process. ConceptDraw PRO flowchart software enhanced with Flowcharts solution helps effectively make Flowchart Design. Use of predesigned flowchart symbols and bright color palette offers a fresh view and favorably distinguishes the flowcharts designed in ConceptDraw PRO from the black and white flowcharts on a paper. Preferably to use no more than three or four colors and apply identical for the same shape types. The best flowchart design can be achieved by starting with Flowchart template, or any of suitable ready examples or samples offered in ConceptDraw STORE, open one of them and enter the proper text into each Flowchart shape. Each symbol of the flowchart has a definition that can't be changed. This means that all flowcharts shapes can be grouped in according to their meaning. Users with ConceptDraw PRO flowchart software can style groups of symbols with close definitions by color sets chosen from complementary palette. Almost all workflows can be depicted as a flowchart. Colored diagrams are more light for perception of the certain information, this is part of flowchart design. Bright colors need to be used in the key points of Decision symbols, to focus attention on their importance for whole process flow.
Business Process Modeling with ConceptDraw
Business Process Modeling with ConceptDraw "Business Process Diagrams" Solution
HelpDesk

How to Create a Typography Infographic Using ConceptDraw PRO

Infographics are a good way to visually share knowledge , to communicate information and illustrate a message. Typography Infographics can help to present at a glance a large pack of complex information in a clear and vivid manner. Designers use the elements of typography Infographics to compose a graphic presentation of an information that is intended to depict the information behind the numbers in a creative and interesting visual way. Each infographic element is used to depict and explain an idea of the current portion of information. Each infographic element must inform its message clearly. ConceptDraw PRO provides the ability to design different kinds of typography infographics. You can use ConceptDraw Typography Infographics solution to create typography infographics effortlessly and quickly using the special set of vector stencils libraries.

data flow diagram, DFD templates Data Flow Diagrams (DFD)

data flow diagram, DFD templates
Data Flow Diagrams solution extends ConceptDraw PRO software with templates, samples and libraries of vector stencils for drawing the data flow diagrams (DFD).

cross-functional flowchart template, flowchart, example business process flow Cross-Functional Flowcharts

cross-functional flowchart template, flowchart, example business process flow
Cross-functional flowcharts are powerful and useful tool for visualizing and analyzing complex business processes which requires involvement of multiple people, teams or even departments. They let clearly represent a sequence of the process steps, the order of operations, relationships between processes and responsible functional units (such as departments or positions).

ducation infographics and infograms, Business intelligence dashboards, Business intelligence charts and maps, Bubble diagrams and charts, Spray diagrams, Circle-Spoke diagrams and models, Circle diagrams, Circular arrows diagrams, Circular flow diagrams, Education Package

ducation infographics and infograms, Business intelligence dashboards, Business intelligence charts and maps, Bubble diagrams and charts, Spray diagrams, Circle-Spoke diagrams and models, Circle diagrams, Circular arrows diagrams, Circular flow diagrams,
Education Package is a comprehensive set of multifarious graphical solutions from ConceptDraw Solution Park, collected together in help to ConceptDraw PRO users working in a field of science, education and training, which is aimed at improving the quality of education and helping to design with ease variety of interesting and colorful educational materials, diagrams, charts and maps. Use it to present the information and knowledge in an interesting, clear, structured and simple form to achieve a success in education and pedagogy, to maintain the interest of students and pupils throughout the whole learning process, at the lectures, lessons and even during independent work with additional materials, to contribute to better perception of scientific information by listeners during the conferences and reports.

Cross Functional Flowchart Symbols

The excellent possibility to create attractive Cross Functional Flowcharts for step-by-step visualization the operations of a business process flow of any degree of detailing is offered by ConceptDraw’s Cross-Functional Flowcharts solution. The extensive selection of commonly used vector cross functional flowchart symbols allow you to demonstrate the document flow in organization, to represent each team member’s responsibilities and how processes get shared or transferred between different teams and departments.

Flowchart design. Flowchart symbols, shapes, stencils and icons

A flowchart is a type of diagram which represents an algorithm, process or workflow, displays the steps as boxes of various kinds and depicts their order by connecting them with arrows. Any business graphic document will be more colorful and understandable if will use professional-looking and visual diagrams and flowcharts. Flowchart design gives versatile presenting and explaining of the process. ConceptDraw PRO flowchart software enhanced with Flowcharts solution helps effectively make Flowchart Design. Use of predesigned flowchart symbols and bright color palette offers a fresh view and favorably distinguishes the flowcharts designed in ConceptDraw PRO from the black and white flowcharts on a paper. Preferably to use no more than three or four colors and apply identical for the same shape types. The best flowchart design can be achieved by starting with Flowchart template, or any of suitable ready examples or samples offered in ConceptDraw STORE, open one of them and enter the proper text into each Flowchart shape. Each symbol of the flowchart has a definition that can't be changed. This means that all flowcharts shapes can be grouped in according to their meaning. Users with ConceptDraw PRO flowchart software can style groups of symbols with close definitions by color sets chosen from complementary palette. Almost all workflows can be depicted as a flowchart. Colored diagrams are more light for perception of the certain information, this is part of flowchart design. Bright colors need to be used in the key points of Decision symbols, to focus attention on their importance for whole process flow.
Business Process Modeling with ConceptDraw
Business Process Modeling with ConceptDraw "Business Process Diagrams" Solution

Cross Functional Flowchart

ConceptDraw PRO extended with Cross-Functional Flowcharts Solution from the Business Processes Area is the best software for quick and easy designing Cross Functional Flowchart of any complexity. Make sure in it right now!
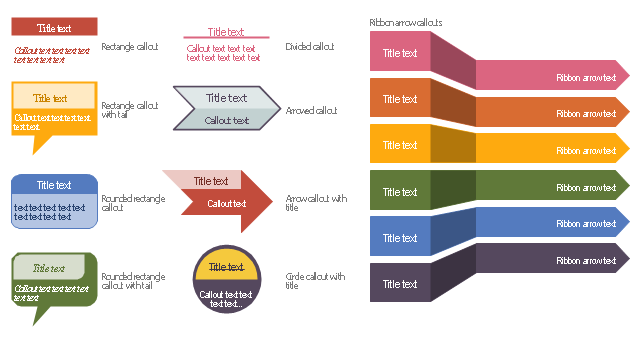
The vector stencils library "Education titled callouts" contains 14 titled callout blocks.
Use it to design your educational infograms.
"In publishing, a call-out or callout is a short string of text connected by a line, arrow, or similar graphic to a feature of an illustration or technical drawing, and giving information about that feature. The term is also used to describe a short piece of text set in larger type than the rest of the page and intended to attract attention.
A similar device in word processing is a special text box with or without a small "tail" that can be pointed to different locations on a document." [Callout. Wikipedia]
The shapes example "Design elements - Education titled callouts" was created using the ConceptDraw PRO diagramming and vector drawing software extended with the Education Infographics solition from the area "Business Infographics" in ConceptDraw Solution Park.
Titled callout blocks
Titled callout blocks, rounded rectangle callout, ribbon arrow callout, rectangle callout, circle callout , callout with divider, balloon callout, arrowed callout, ribbon callout, arrowed callout, arrow right callout, arrow callout,

Flowchart Software

A Flowchart visualizes a process or algorithm of a program as step blocks composed of shapes, connected with arrows that show the process flow direction. The Flowcharts give users the ability to represent structural data in a visual form and are widely used to visualize the business and technical processes, as well as software algorithms. ConceptDraw PRO is a powerful Mac OS X and Windows technical diagramming, business diagramming and flowchart drawing software. Numerous vector stencils, built-in templates and samples created by professional designers are included at the basic package. ConceptDraw PRO is a classic flowchart maker, which exactly follows the industry standards and provides ready-to-use flowchart symbols gathered at the solutions of ConceptDraw Solution Park. Use the free trial versions of ConceptDraw PRO software for Mac and PC to experience the powerful possibilities of ConceptDraw PRO in designing the Flowcharts, Flow Diagrams, Business Flow Charts of different types, styles, and degree of complexity.

Typography Art

Typography Infographics Solution for ConceptDraw Solution Park is the best answer on the question “How to create an Infographic?”. The Typography Infographics created in ConceptDraw PRO using the Typography Infographics Solution are the real typography art.