 Pie Charts
Pie Charts are extensively used in statistics and business for explaining data and work results, in mass media for comparison (i.e. to visualize the percentage for the parts of one total), and in many other fields. The Pie Charts solution for ConceptDraw PRO v10 offers powerful drawing tools, varied templates, samples, and a library of vector stencils for simple construction and design of Pie Charts, Donut Chart, and Pie Graph Worksheets.
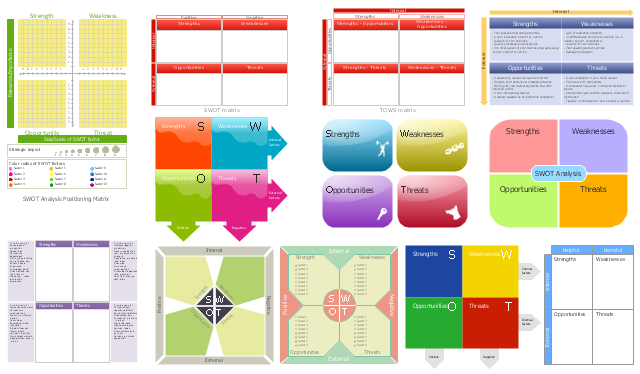
"SWOT analysis is a classic strategic planning tool. Using a framework of internal strengths and weaknesses and external opportunities and threats, it provides a simple way to assess how a strategy can best be implemented. The tool helps planners be realistic about what they can achieve, and where they should focus. ...
The SWOT framework - a two-by-two matrix - is best completed in a group with key members of the team or organisation present. First it is important to be clear what the policy change objective is, and what team or organisation the analysis is being carried out on. Once these are clarified and agreed, begin with a brainstorm of ideas, and then hone them down and clarify them afterwards in discussion.
An assessment of internal capacity helps identify where the project or organisation is now: the existing resources that can be used immediately and current problems that won't go away. It can help identify where new resources, skills or allies will be needed. When thinking of strengths it is useful to think of real examples of success to ground and clarify the conversation. ...
An assessment of the external environment tends to focus on what is going on outside the organisation, or areas which are not yet affecting the strategy but could do - either positively or negatively." [odi.org.uk/ publications/ 5876-swot-analysis-context-mapping]
The vector stencils library "SWOT" contains 16 SWOT and TOWS matrix diagram templates for the ConceptDraw PRO diagramming and vector drawing software.
The example "Design elements - SWOT and TOWS analysis matrices" is included in the SWOT Analysis solution from the Management area of ConceptDraw Solution Park.
- Earthquake disaster assessment - Workflow diagram | Weather ...
- Earthquake disaster assessment - Workflow diagram | Weather ...
- Elements location of a welding symbol | Location of the Migration ...
- Goods And Services Png
- SWOT Analysis Solution - Strategy Tools | TOWS Matrix | SWOT and ...
- Foods Draw Png
- Earthquake disaster assessment - Workflow diagram | Workflow ...
- Increase Sales Vector Png
- Security Illustration Png
- Risk Png
- Healthy Foods | Energy Pyramid Diagram | Ecosystem goods and ...
- Charts And Graphs Png
- Mathematical Diagrams Png
- Ecosystem goods and services - Segmented pyramid diagram | Pie ...
- Object-Oriented Design | Basic Area Charts | Star Network Topology ...
- How to Supervise People | HR Flowchart Symbols | Motivation Png ...
- Fault Tree Analysis Example
- Decision Png
- Combination Furniture Layout Png
- Earthquake disaster assessment - Workflow diagram | Emergency ...
