Material Requisition Flowchart. Flowchart Examples
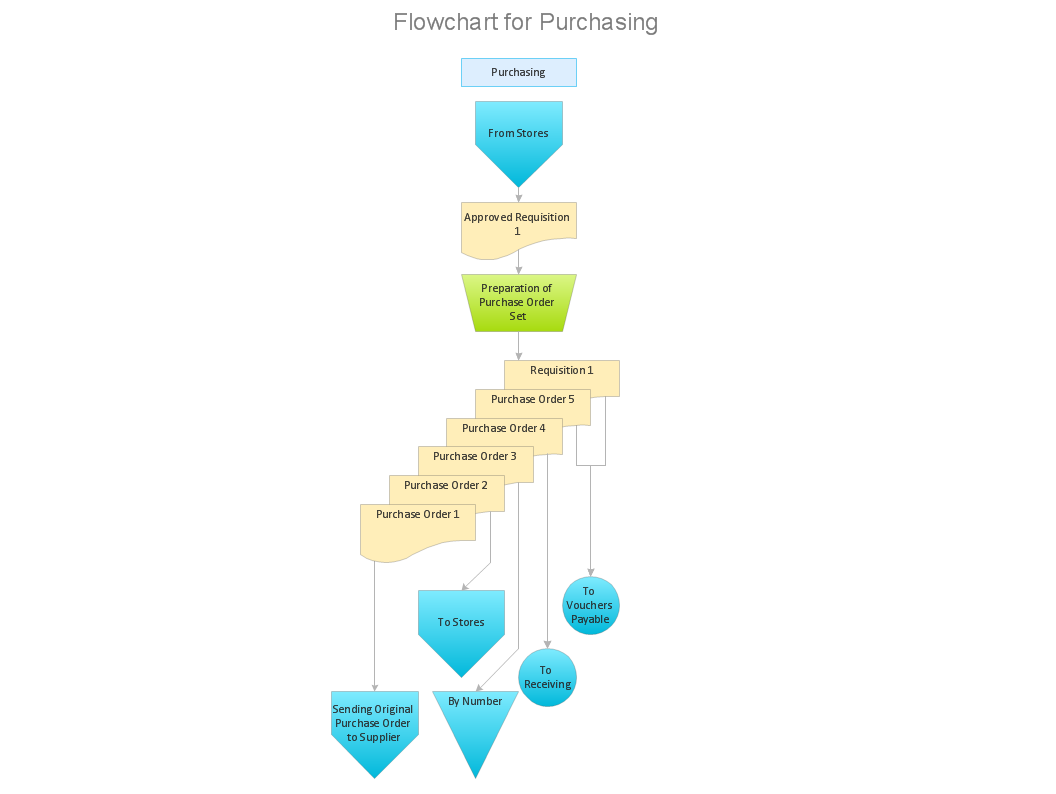
Material requisition is a request generated by internal or external organization with a goal to inform the purchase department about the needed items and materials. The requisition can be represented as a written document on a pre-printed form or online request in form of electronic document. The electronic inquisition occupies a leading position in a modern world, now the paper forms are replaced by electronic ordering processes and workflows. The requisition is actively used in business as an internal document for notification the store about the needed goods, in medicine for making the orders on medical equipment and medicaments, in industry for creation request for purchasing some items and materials, and so on. ConceptDraw DIAGRAM ector graphics software extended with Flowcharts solution from the Diagrams area is powerful and useful tool for drawing various types of Flowcharts, including without doubt the Material Requisition Flowchart of any degree of detailing. Succeed in drawing using the large quantity of predesigned flowchart specific shapes, symbols and icons.Basic Flowchart Examples
ConceptDraw DIAGRAM is a business flowchart software includes the wide flowchart examples package.Process Flow Chart
A Process Flow Chart is a type of flowchart which is mostly used in industrial, chemical and process engineering for illustrating high-level processes, major plant processes and not shows minor details. ConceptDraw DIAGRAM diagramming and vector drawing software extended with Flowcharts Solution from the "Diagrams" Area of ConceptDraw Solution Park is the best way to create Process Flow Chart and other types of flowcharts.Flowchart Marketing Process. Flowchart Examples
This sample shows the Flowchart that displays the layout and work flow of the cloud marketing platform. This diagram has a style of the marketing brochure. This style displays the central product that is related to the other issues. Using the ready-to-use predesigned objects, samples and templates from the Flowcharts Solution for ConceptDraw DIAGRAM you can create your own professional looking Flowchart Diagrams quick and easy.Flow chart Example. Warehouse Flowchart
Warehouse Flowcharts are various diagrams that describe the warehousing and inventory management processes on the warehouses. Typical purposes of Warehouse Flowcharts are evaluating warehouse performance, measuring efficiency of customer service and organizational performance. This type of Workflow diagrams can be used for identifying any disconnection between business activities and business objectives. They are effectively used by warehouse-related people and organizations, manufacturers, wholesalers, exporters, importers, transporters, and others. Standard Warehousing process flow diagram and standard Workflow diagram are used for process identification for further evaluating effectiveness and profitability of overall business process. Use the ConceptDraw DIAGRAM ector graphic software extended with Flowcharts solution to design your own professional-looking Workflow diagrams and Flowcharts of any types, including the Warehouse flowchart, Process flow diagrams which depict in details all steps of Warehouse packages flow. Microsoft Visio, designed for Windows users, can’t be opened directly on Mac. But fortunately, there are several Visio alternatives for Mac which will help Mac users to work Visio files. With ConceptDraw DIAGRAM , you may open, edit and save files in Visio format.
Ordering Process Flowchart. Flowchart Examples
A flowchart is a widely used type of diagram that visually represents an algorithm, workflow or process, using the boxes of various kinds to depict the steps and connecting them with arrows to show the order of execution these steps. Еhe ConceptDraw DIAGRAM supplied with Accounting Flowcharts Solution from the Finance and Accounting Area of ConceptDraw Solution Park is a powerful diagramming and vector drawing software which ideally suits for designing Ordering Process Flowchart of any complexity.Process Engineering
ConceptDraw DIAGRAM diagramming and vector drawing software supplied with Chemical and Process Engineering Solution from the Industrial Engineering Area of ConceptDraw Solution Park is powerful and effective process engineering software.Value Stream Mapping Symbols
VSM symbols are the best for a production process designing. The entire Value Stream Mapping method uses a graphical representation of the manufacturing process, factors' pros and cons, that all stakeholders can easily understand. Value Stream Mapping is a graphical technique that provides possibilities to improve analysis of a manufacturing process, at the stage of the transferring information or materials that required to deliver a product or service to the customer.Pyramid Diagram and Pyramid Chart
Pyramid Diagram, Triangle Chart or Triangular Diagram is a convenient and useful type of diagrams, which lets represent the data hierarchical structure and to illustrate the foundation-based relationships between the hierarchy levels. Pyramid Diagrams are used to visualize effectively the hierarchical, as well as proportional and foundation-based relationships, the process steps, the interconnections of organizational layers or topics. ConceptDraw DIAGRAM software enhanced with Pyramid Diagrams solution from Marketing area of ConceptDraw Solution Park is a powerful business charting software, that includes all required tools for designing the multilevel Pyramid Diagrams as quickly as possible. The build-in vector stencils and templates are the great aid for designers, a variety of examples and samples is a good base and source of inspiration. Use attractive and vivid 2D and 3D Pyramid Diagrams and Triangle Charts designed in ConceptDraw DIAGRAM to illustrate your documents, presentations, infographics, articles, reports, websites, etc.Business Process Flowchart
Cross-functional (deployment) flowcharts visualize what functional units (people, departments or functional areas) are responsible for the business process operations. The flowcharts are divided into rows/columns of functional units. Blocks of various shapes represent the process steps, and are placed in rows/columns of the responsible functional units.Cross Functional Flowchart
ConceptDraw DIAGRAM extended with Cross-Functional Flowcharts Solution from the Business Processes Area is the best software for quick and easy designing Cross Functional Flowchart of any complexity. Make sure in it right now!Copying Service Process Flowchart. Flowchart Examples
This sample was created in ConceptDraw DIAGRAM diagramming and vector drawing software using the Flowcharts solution from the Diagrams area of ConceptDraw Solution Park. This sample shows the Flowchart on that it is displayed the process of the determination the permissibility according the Access Copyright license. The diamonds represent the decision points. Inside the diamonds are the questions that need the answer yes/no. It is necessary to answer on the question, make the decision that will determine the next step.Flowchart Components
The ConceptDraw Flowchart component includes a set of samples and templates. This geathered as flowchart maker toolbox which focused on drawing flowcharts of any industry standards.Circular Flow Diagram Template
You need to draw the Circular Arrows Diagram, Segmented Diagram or Circular Flow Diagram? Any of these diagrams can be fast and easy designed in ConceptDraw DIAGRAM.ConceptDraw DIAGRAM diagramming and vector drawing software offers the Circular Arrows Diagrams Solution from the "Diagrams" Area with extensive drawing tools, predesigned samples and circular flow diagram template. Use of ready template is the easiest way of drawing.Draw Company Structure with Organization Charting Software
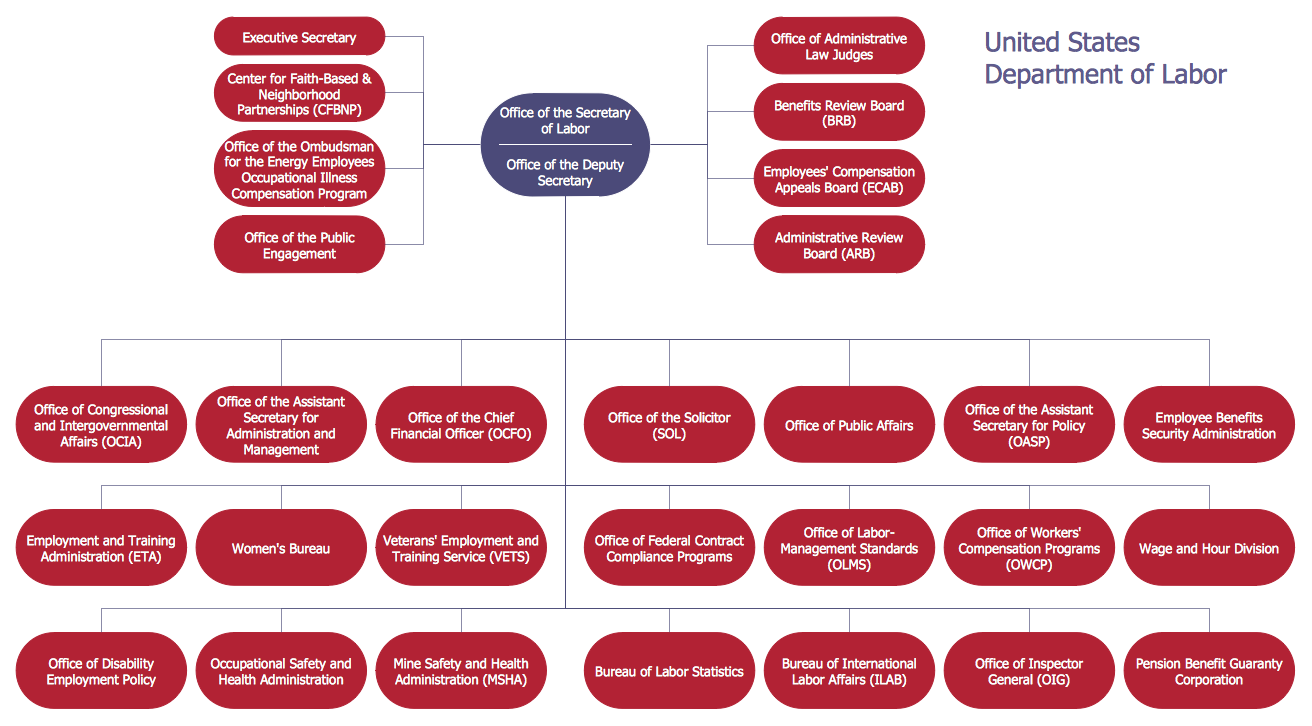
Draw Company Structure Diagram - get the detailed information about the company structure and hierarchy - who execute what tasks and who is in charge at this company. This information shows the reasoning and success of business and is indispensable for investors and financial institutions.
Value Stream Mapping for the Lean Office
Value Stream Mapping for the lean office is a tool that uses a flow diagram to document in great detail every step of a manufacturing process.Flowchart Examples and Templates
ConceptDraw DIAGRAM ector diagramming software and ConceptDraw Solution Park provide a wide variety of diagrams, organizational charts, business charts and flowchart examples, templates and samples. You are free to choose any example or template you are interested in from the ConceptDraw STORE, then use it to simplify your work at the designing professional-looking flowcharts and diagrams. As for flowcharts, turn your attention for the Flowcharts solution from the "Diagrams" area of ConceptDraw Solution Park, Process Flowcharts and Cross-Functional Flowcharts solutions from the Business Processes area, Accounting Flowcharts and Audit Flowcharts solutions from the Finance and Accounting area, which are completely devoted to flowcharts creation and provide an enormous collection of helpful flowchart templates and samples. Each of them is specially developed, well thought-out, dedicated to a certain thematic and carries a specific purpose. You need only to determine with your needs and to decide which one corresponds them the best and suits for you.Swim Lane Flowchart Symbols
Use the set of special professionally developed swim lane flowchart symbols - single, multiple, vertical and horizontal lanes from the Swimlanes and Swimlanes BPMN 1.2 libraries from the Business Process Diagram solution, the Swim Lanes library from the Business Process Mapping solution as the perfect basis for your Swim Lane Flowcharts of processes, algorithms and procedures.What can go wrong if the purchasing process is not followed?
Make sure that your purchasing process complies with the standards and regulations. Common key elements of purchasing process.Accounting Flowchart: Purchasing, Receiving, Payable and Payment
Accounting flowchart is a system of processes to represent accounting system of an organization. How to create flowcharts for an accounting information system.- Material Flow Chart Template
- Process Flowchart | Flow chart Example . Warehouse Flowchart ...
- Flow Chart In Receiving Tools Equipment Supplies And Materials In
- Basic Pie Charts | Flowchart Components | Column Chart Template ...
- Material Requisition Flowchart . Flowchart Examples | Flowchart ...
- Flow chart Example . Warehouse Flowchart | Process Flowchart ...
- Flow process chart | Business Process Modeling Notation Template ...
- Material Requisition Flowchart . Flowchart Examples | Flowchart ...
- Basic Flowchart Symbols and Meaning | Flow chart Example ...
- Flowchart Components | Material Requisition Flowchart . Flowchart ...
- Process Flowchart | Material Requisition Flowchart . Flowchart ...
- Draw A Flow Chart Of Chemical Industries Using Air As Raw Material
- Work Order Process Flowchart . Business Process Mapping ...
- Manufacturing 8 Ms fishbone diagram - Template | 7m Man Power ...
- Flow process chart
- ConceptDraw DIAGRAM Compatibility with MS Visio | Event-driven ...
- Material Requisition Flowchart . Flowchart Examples | Flow Chart ...
- Flow chart Example . Warehouse Flowchart | Accounting Flowchart ...
- Material Requisition Flowchart . Flowchart Examples | Business ...


