Histogram Chart
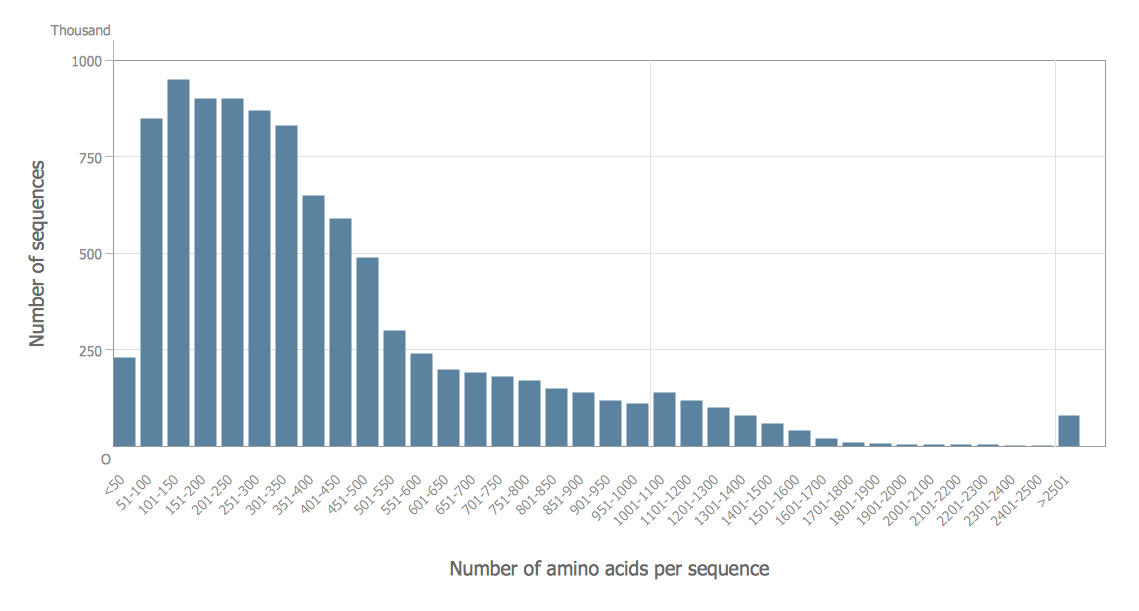
What is a Histogram Chart? It is a chart which visually displays a distribution of the data. ConceptDraw DIAGRAM extended with Histograms solution from the Graphs and Charts area of ConceptDraw Solution Park is the best software for fast and simple drawing professional looking Histogram Chart.Histogram
ConceptDraw DIAGRAM diagramming and vector drawing software offers the Histograms solution from the Graphs and Charts area of ConceptDraw Solution Park with powerful tools to help you draw a Histogram of any complexity quick and easy.How to Make a Histogram: A Beginner's Tutorial
How to make a Histogram quick and easy? ConceptDraw DIAGRAM diagramming and vector drawing software extended with Histograms solution from the Graphs and Charts area will effectively help you in Histogram drawing.How To Make Histogram in ConceptDraw DIAGRAM ?
How to make histogram in ConceptDraw DIAGRAM ? ConceptDraw DIAGRAM diagramming and vector drawing software is the best choice for making professional looking Histograms. ConceptDraw DIAGRAM provides Histograms solution from the Graphs and Charts Area of ConceptDraw Solution Park.Seven Basic Tools of Quality - Histogram
A histogram is a chart which visually displays a distribution of numerical data. ConceptDraw DIAGRAM diagramming and vector drawing software offers a powerful Seven Basic Tools of Quality solution from the Quality area of ConceptDraw Solution Park which contains a set of useful tools for easy drawing Histogram and other quality related diagrams of any complexity.Making a Histogram
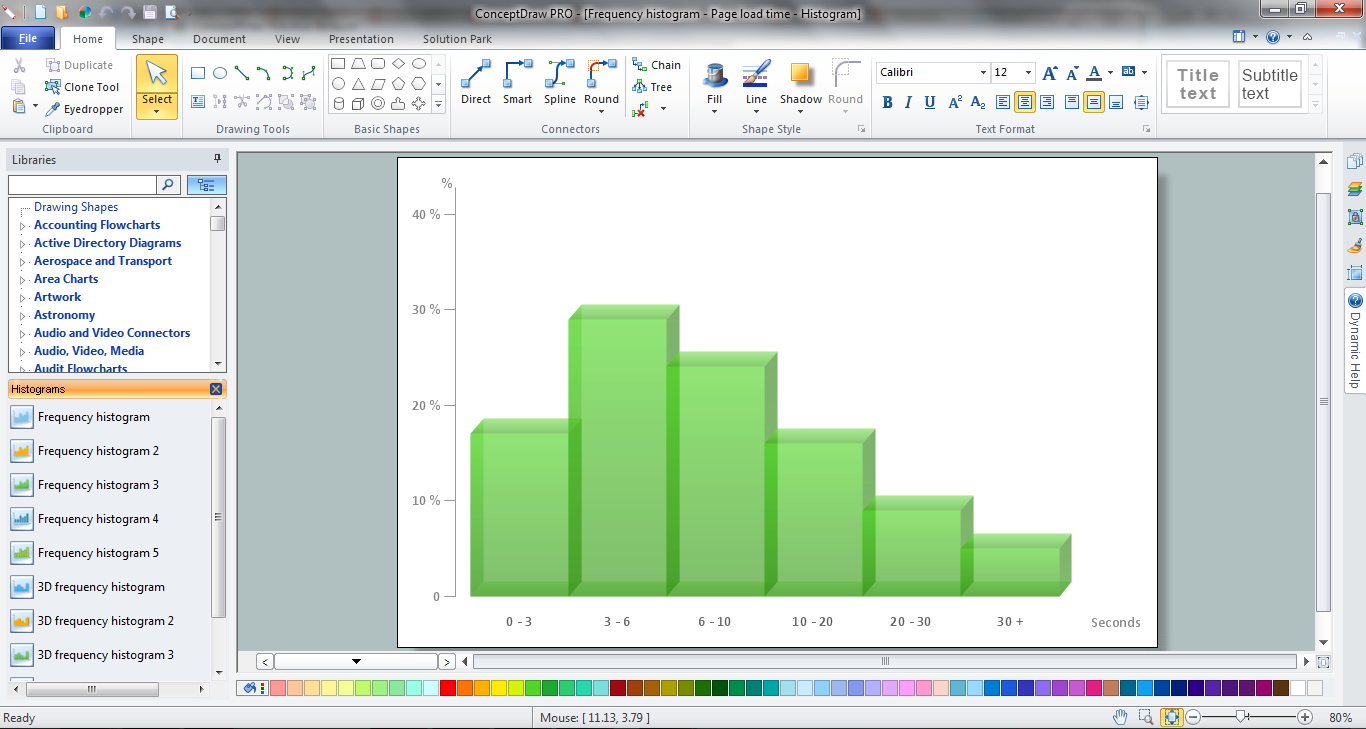
ConceptDraw DIAGRAM is a powerful diagramming and vector drawing software. Extended with Histograms solution from the Graphs and Charts area, ConceptDraw DIAGRAM became the ideal software for making a Histogram.This histogram sample shows the national distribution of FICO scores in the United States. It was designed on the base of the Wikimedia Commons file: Fico histogram.svg. [commons.wikimedia.org/ wiki/ File:Fico_ histogram.svg]
This file is licensed under the Creative Commons Attribution-Share Alike 3.0 Unported license. [creativecommons.org/ licenses/ by-sa/ 3.0/ deed.en]
"The FICO score is the best-known and most widely used credit score model in the United States. It was first introduced in 1989 by FICO, then called Fair, Isaac, and Company. The FICO model is used by the vast majority of banks and credit grantors, and is based on consumer credit files of the three national credit bureaus: Experian, Equifax, and TransUnion. Because a consumer's credit file may contain different information at each of the bureaus, FICO scores can vary depending on which bureau provides the information to FICO to generate the score." [Credit score in the United States. Wikipedia]
The histogram example "National distribution of FICO scores" was created using the ConceptDraw PRO diagramming and vector drawing software extended with the Histograms solution from the Graphs and Charts area of ConceptDraw Solution Park.
Seven Basic Tools of Quality
Seven Basic Tools of Quality solution is useful for all ConceptDraw DIAGRAM users, giving them a particular set of different graphical techniques helping on focus on such activity as identifying the root cause of many quality-related issues. This solution offers the well-known visual tools helpful in representing all the data related to different quality initiatives. Some of such tools are the pre-made templates useful for making different fishbone diagrams, Pareto charts, and histograms. It is ideal for all who want to manage quality control throughout an organization by using a modern tool.
ConceptDraw DIAGRAM UML Diagrams with ConceptDraw DIAGRAM
ConceptDraw DIAGRAM is a great UML modeling and design tool that enables you to quickly and easily generate all types of UML diagrams. ConceptDraw DIAGRAM offers a large collection of industry-standard UML object libraries for all types of UML diagrams.Best Multi-Platform Diagram Software
ConceptDraw DIAGRAM is a powerful tool for drawing business communication ideas and concepts, simple visual presentation of numerical data in the Mac environment.Basic Diagramming
Create flowcharts, organizational charts, bar charts, line graphs, and more with ConceptDraw DIAGRAM.Best Program to Make Diagrams
Make diagrams, charts, workflows, flowcharts, org charts, project charts easily with ConceptDraw software.Chart Examples
Easy charting software comes with beautiful chart templates and examples. This makes it easy to create professional charts without prior experience.Chart Maker for Presentations
Easy charting software comes with beautiful chart templates and examples. This makes it easy to create professional charts without prior experience.Basic Diagramming
Block diagrams are essentially a very simple format of diagrams. A variety of commonly used shapes and connecting lines, rules of construction and actions pertaining to them, make Block diagram a versatile and flexible tool for many forms of industry. Another advantage is the ease with which Block diagrams can be constructed, especially if you use professional diagramming software. ConceptDraw DIAGRAM software is an example of purpose built application designed with the form of process modeling in mind. It includes Block Diagrams solution from Diagrams area of ConceptDraw Solution Park for easy drawing professional-looking simple diagram - Block diagram, and a lot of other useful solutions for designing variety of other types of diagrams, schematics and flowcharts (Line graphs, Bar charts, Organizational charts, Histograms, Pie charts, Process flowcharts, Fault tree analysis diagrams, Scatter plots, Venn diagrams, Bubble diagrams, etc.). The RapidDraw functionality of ConceptDraw DIAGRAM lets create new objects and their connectors in just single-click.The Best Mac Software for Diagramming or Drawing
ConceptDraw DIAGRAM is a powerful intelligent vector graphics engine that can be used to create basic diagrams including flowcharts, charts, workflows, flowcharts, organizational charts, business diagram, learn business diagrams, flow diagrams.Seven Basic Tools of Quality — Quality Control
ConceptDraw DIAGRAM diagramming and vector drawing software extended with Seven Basic Tools of Quality solution from the Quality area of ConceptDraw Solution Park provides effective tools for quality control and helps design any types of quality-related diagrams.This frequency histogram sample shows the relative species abundance of beetles sampled from the river Thames. It was designed on the base of the Wikimedia Commons file: PrestonPlot beetles.png.
[commons.wikimedia.org/ wiki/ File:PrestonPlot_ beetles.png]
"Relative species abundance is a component of biodiversity and refers to how common or rare a species is relative to other species in a defined location or community. Relative species abundances tend to conform to specific patterns that are among the best-known and most-studied patterns in macroecology. ...
Relative species abundance distributions are usually graphed as frequency histograms (“Preston Plots”) or rank-abundance diagrams ("Whittaker Plots”)." [Relative species abundance. Wikipedia]
The frequency histogram example "Beetles in the river Thames" was created using the ConceptDraw PRO diagramming and vector drawing software extended with the Histograms solution from the Graphs and Charts area of ConceptDraw Solution Park.
- Seven Basic Tools of Quality - Histogram | Histograms | Basic ...
- Best Vector Drawing Application for Mac OS X | How to Draw a ...
- Histogram | Basic Diagramming | Pie Chart Software | Histograms ...
- Seven Basic Tools of Quality - Histogram | Histogram | How Do You ...
- Chart Maker for Presentations | Histograms Bar Graphs Software For ...
- Histogram Chart | Seven Basic Tools of Quality - Histogram | How to ...
- Seven Basic Tools of Quality - Histogram | Wind speed histogram ...
- Seven Basic Tools of Quality - Histogram | Histogram Chart | Make a ...
- Seven Basic Tools of Quality - Histogram - Conceptdraw.com