Electrical Symbols, Electrical Diagram Symbols
When drawing Electrical Schematics, Electrical Circuit Diagrams, Power Systems Diagrams, Circuit and Wiring Diagrams, Digital and Analog Logic Schemes, you will obligatory need the electrical symbols and pictograms to represent various electrical and electronic devices, such as resistors, wires, transistors, inductors, batteries, switches, lamps, readouts, amplifiers, repeaters, relays, transmission paths, semiconductors, generators, and many more. Today these symbols are internationally standardized, so the diagrams designed using them are recognizable and comprehensible by specialists from different countries. Electrical Engineering Solution included to ConceptDraw Solution Park provides 26 libraries with 926 commonly used electrical schematic and electrical engineering symbols making the reality the easy drawing of Electrical diagrams, schematics and blueprints. Now you need only a few minutes to create great-looking Electrical diagram, simply choose required electrical design elements from the libraries, drag them on the needed places at the document and connect in a suitable way.
 Business Process Mapping
The Business Process Mapping solution for ConceptDraw DIAGRAM is for users involved in process mapping and creating SIPOC diagrams.
 SYSML
SYSML
The SysML solution helps to present diagrams using Systems Modeling Language; a perfect tool for system engineering.
Process Flow Chart
A Process Flow Chart is a type of flowchart which is mostly used in industrial, chemical and process engineering for illustrating high-level processes, major plant processes and not shows minor details. ConceptDraw DIAGRAM diagramming and vector drawing software extended with Flowcharts Solution from the "Diagrams" Area of ConceptDraw Solution Park is the best way to create Process Flow Chart and other types of flowcharts.HelpDesk
How to Create a Fishbone (Ishikawa) Diagram Quickly
A Fishbone (Ishikawa) diagram is also called cause-and-effect diagram. Fishbone diagram is often used in business to determine the cause of some problem. The diagram illustrates the main causes and sub-causes leading to an event. The main goal of the Fishbone diagram is to illustrate in a graphical way the relationship between a given outcome and all the factors that influence this outcome. The complete diagram resembles a fish skeleton as its name implies. The ability to create a Fishbone Diagram is supported by the Fishbone Diagram solution. Use ConceptDraw MINDMAP for structuring data and then ConceptDraw DIAGRAM for generating a Fishbone Diagram from mind map structure.
 PM Response
The PM Response solution extends the functional abilities in project management for all three ConceptDraw products by helping to improve the response time to project changes, to plan on how to effectively respond on issues and events impacting the project. It supplies the project managers, team leaders, and all other project participants with wide abilities of iteration planning, creative collaboration, effective decision-making, discussions of the project layout approaches and solving the project challenges, lets them use mind mapping technique for iteration planning and applying the project changes, to represent the projects data as Mind Maps and use them to construct the clear plans, to convert project maps to project implementations, to use different kinds of Visual diagrams to solve the current project problems and to make correct decisions, to plan resources usage and to respond to changes in the project environment.
 Project Exchange
This solution extends ConceptDraw PROJECT and ConceptDraw MINDMAP software with the ability to import and export project data.
 Directional Maps
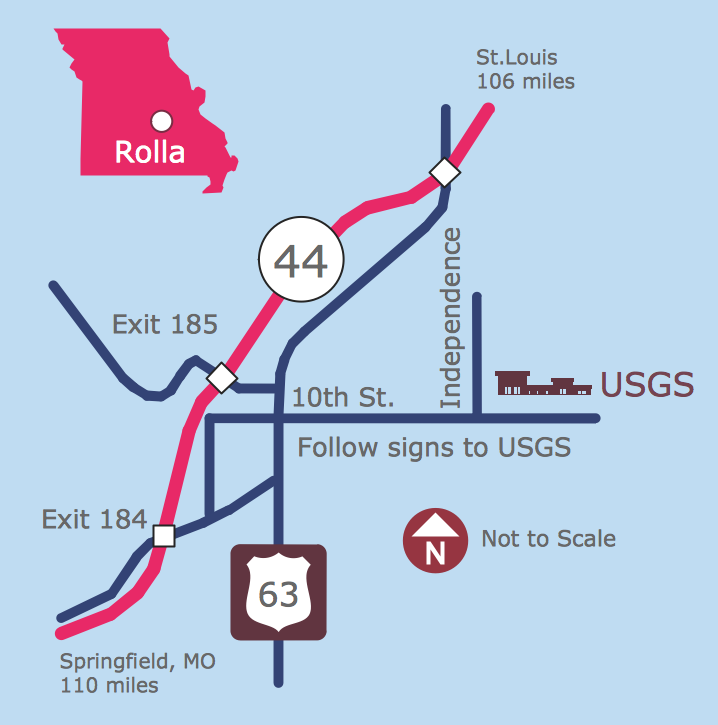
Directional Maps solution extends ConceptDraw DIAGRAM software with templates, samples and libraries of vector stencils for drawing the directional, location, site, transit, road and route maps, plans and schemes.
 Seven Management and Planning Tools
Seven Management and Planning Tools solution extends ConceptDraw DIAGRAM and ConceptDraw MINDMAP with features, templates, samples and libraries of vector stencils for drawing management mind maps and diagrams.
 Food Court
Use the Food Court solution to create food art. Pictures of food can be designed using libraries of food images, fruit art and pictures of vegetables.
 Quality Mind Map
This solution extends ConceptDraw MINDMAP software with Quality Management Mind Maps (Presentations, Meeting Agendas, Problem to be solved).
Maps and Directions
ConceptDraw DIAGRAM diagramming and vector drawing software extended with Directional Maps Solution from the Maps Area of ConceptDraw Solution Park is a powerful maps and directions design software. Let's review the tools of this solution.- Block Diagram Of Maintenance Management
- Block Diagram Of Maintenance In Manufacturing Plant
- Block Diagram Of Maintenance
- Replacement Maintenance Planning Block Diagram
- Block Diagram Of Maintenance Planning
- Breakdown Maintenance Flow Chart
- Block Diagram Of Maintenance Planing
- SysML block definition diagram - Function Breakdown model | PM ...
- Maintenance Types Diagram
- Process Flowchart | Circuits and Logic Diagram Software | Technical ...
- Corrective Maintenance Process Flow Chart For Manufacturing
- Breakdown Maintenance Process Flow Diagram
- Diagram Of Maintenance Management
- Block diagram - Planning process | Block Diagrams | Block diagram ...
- Block diagram - Planning process | Block Diagrams | Interior Design ...
- Block Dia And Definition Of Maintenance Planning
- Electrical Symbols — Maintenance | Circuits and Logic Diagram ...
- Maintenance Planning Process Flowchart
- Block diagram - Planning process | Process Flowchart | Block ...


