BCG Matrix
The growth–share matrix (BCG Matrix) was created by Bruce D. Henderson for the Boston Consulting Group in 1970 to help corporations to analyze their business units and to help the company allocate resources. How is it easy design the BCG Matrices in ConceptDraw DIAGRAM diagramming and vector drawing software supplied with unique Matrices Solution from the Marketing Area of ConceptDraw Solution Park.Growth-Share Matrix Software
Growth-Share Matrix Software - ConceptDraw DIAGRAM is a powerful diagramming and vector drawing software for creating professional looking Growth–Share Matrices. For simple and quick creating the Growth–Share Matrix ConceptDraw DIAGRAM offers the Matrices Solution from the Marketing Area of ConceptDraw Solution Park. The Matrices Solution also provides a wide variety of templates and samples that will help you to create the Matrix diagrams of any difficulty.CORRECTIVE ACTIONS PLANNING. Involvement Matrix
The Involvement Matrix can identify the distribution of responsibilities and identify roles in a group or team. Use the Involvement Matrix to specify roles and responsibilities of actions in problem solving. ConceptDraw Office suite is a software for corrective actions planning.
Positioning Map
ConceptDraw DIAGRAM is a powerful diagramming and vector drawing software. Extended with Matrices Solution from the Marketing Area of ConceptDraw Solution Park it became the best software for quick and easy designing various types of Matrix Diagrams, including Positioning Map.Competitor Analysis
Competitor analysis is a first and obligatory step in elaboration the proper corporate marketing strategy and creating sustainable competitive advantage. Use powerful opportunities of numerous solutions from ConceptDraw Solution Park for designing illustrative diagrams, charts, matrices which are necessary for effective competitor analysis.MindMap Presentation
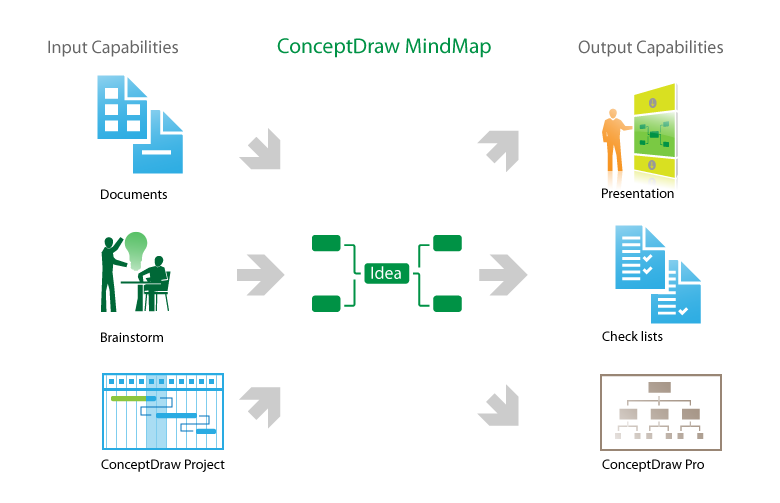
Mindmap Presentation. Present Mindmaps via Skype with ConceptDraw MINDMAP.Root Cause Tree Diagram
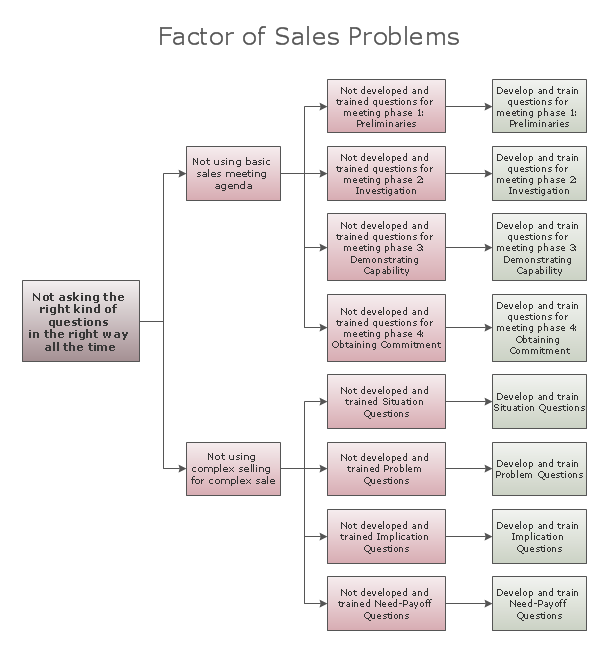
Root Cause Tree Diagram is one of the best tools to outline the problems and their causes, to analyze them and to formulate the possible corrective actions. Root Cause Tree Diagrams are successfully used in management, marketing, quality control and depth analysis, and are based on the principle that solution of any problem is concentrated at the root. Root Cause Tree Diagram contains the main problem on the top, from the top depart two branches of causes, which then diverge on additional causes, thus is constructed the hierarchy of root causes. So, the step by step defining of causes lets to detect the main reasons of a given effect and to make the correct arrangements to solve a problem. The ConceptDraw MINDMAP and ConceptDraw DIAGRAM products included to ConceptDraw Office suite, with help of Business Productivity solutions from the ConceptDraw Solution Park are effective in questions of problem solving, defining root causes of various problems, root causes analysis and designing the Root Cause Tree Diagrams.- Boston growth - share ( BCG ) matrix diagram | Boston Consulting ...
- BCG Matrix | Swot Analysis Examples | SWOT Analysis Tool for ...
- Boston growth - share ( BCG ) matrix diagram | Matrices | Example Of ...
- BCG Matrix | Swot Analysis Examples | Growth - Share Matrix ...
- BCG Matrix | Growth - Share Matrix Software | Pyramid Diagram ...
- Boston Consulting Group Matrix Template
- BCG Matrix | Growth - Share Matrix Software | SWOT Sample in ...
- Ansoff Matrix | Growth - Share Matrix Software | Competitor Analysis ...
- Ansoff Matrix | SWOT Analysis matrix templates and samples ...
- Boston growth - share ( BCG ) matrix diagram | Draw A Bcg Matrix In ...
- BCG Matrix | Growth - Share Matrix Software | Matrix Organization ...
- BCG Matrix | Growth - Share Matrix Software | Matrix Organization ...
- Ansoff Matrix | BCG Matrix | Swot Analysis Examples | Boston Matrix ...
- Matrices | Competitor Analysis | BCG Matrix | Types Of Matrix In ...
- Boston growth - share matrix - Template | Boston growth-share ( BCG ...
- Ansoff Matrix | Ansoff's product / market matrix | BCG Matrix | Ansoff ...
- Growth - Share Matrix Software | Sales Growth. Bar Graphs Example ...
- Ansoff product-market growth matrix - Template | Growth - Share ...
- Sales Growth . Bar Graphs Example | Basic Diagramming | BCG ...
- BCG Matrix | Competitor Analysis | Ansoff Matrix | Bcg Matrix Graph


