Bubble diagrams in Landscape Design with ConceptDraw DIAGRAM
Bubble Diagrams are the charts with a bubble presentation of data with obligatory consideration of bubble's sizes. They are analogs of Mind Maps and find their application at many fields, and even in landscape design. At this case the bubbles are applied to illustrate the arrangement of different areas of future landscape design, such as lawns, flowerbeds, playgrounds, pools, recreation areas, etc. Bubble Diagram helps to see instantly the whole project, it is easy for design and quite informative, in most cases it reflects all needed information. Often Bubble Diagram is used as a draft for the future landscape project, on the first stage of its design, and in case of approval of chosen design concept is created advanced detailed landscape plan with specification of plants and used materials. Creation of Bubble Diagrams for landscape in ConceptDraw DIAGRAM software is an easy task thanks to the Bubble Diagrams solution from "Diagrams" area. You can use the ready scanned location plan as the base or create it easy using the special ConceptDraw libraries and templates.HelpDesk
How to Create a Bubble Diagram
Bubble Diagram is a simple chart that consists of circles (bubbles) repesening certain topics or processes. Bubbles are connected by lines depicting the type of relationships between the bubbles. The size of each bubble is depended on the importance of the entity it represents. Bubble charts are widely used throughout social, economical, medical, and other scientific researches as well as throughout architecture and business management. Bubble charts are often used during the early stages of product development to visualize thoughts and ideas for the purpose of sketching out a development plan. ConceptDraw DIAGRAM allows you to draw a bubble diagrams using the Bubble Diagrams solution.
 Bubble Diagrams
Bubble diagrams have enjoyed great success in software engineering, architecture, economics, medicine, landscape design, scientific and educational process, for ideas organization during brainstorming, for making business illustrations, presentations, planning, design, and strategy development. They are popular because of their simplicity and their powerful visual communication attributes.
HelpDesk
How to Add a Bubble Diagram to PowerPoint Presentation
Bubble diagrams can be used to compare concepts, and identify areas of similarity and difference. ConceptDraw DIAGRAM allows you to make a MS PowerPoint Presentation from your charts in a few simple steps.
 SWOT and TOWS Matrix Diagrams
SWOT and TOWS Matrix Diagrams solution extends ConceptDraw DIAGRAM and ConceptDraw MINDMAP software with features, templates, samples and libraries of vector stencils for drawing SWOT and TOWS analysis matrices and mind maps.
 Comparison Dashboard
Comparison dashboard solution extends ConceptDraw DIAGRAM software with samples, templates and vector stencils library with charts and indicators for drawing the visual dashboard comparing data.
HelpDesk
How to Create a Sales Dashboard
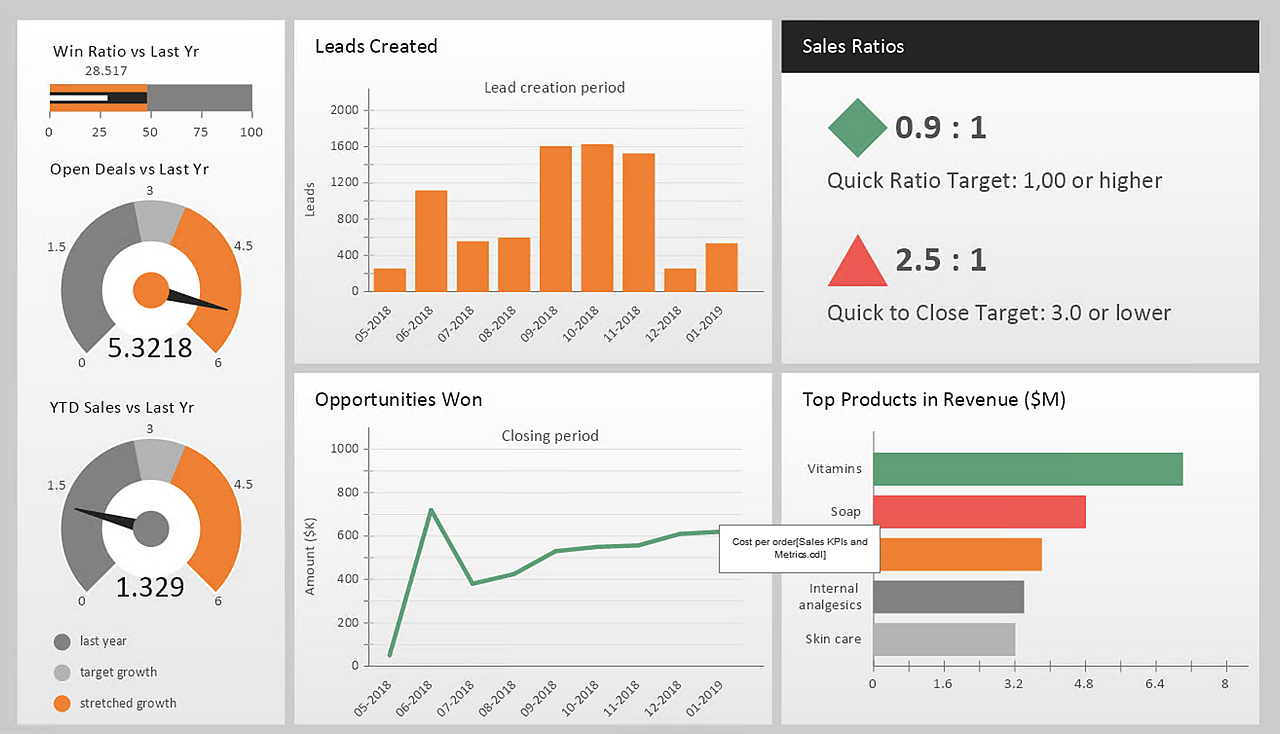
A visual dashboard is a valuable tool for any sales team. Sales dashboard allows you to view and monitor sales indicators that are important for manager and sales staff. It helps to use timely and reliable information to improve the quality of sales performance and increase sales revenues. ConceptDraw Sales Dashboard solution is a tool for both: sales manager and sales team. It provides the visualization of key performance indicators that are critical to the entire sales organization. The custom sales dashboard displays real-time information on sales performance KPIs with the help of intuitive and easy-to-understand diagrams and charts.This SWOT analysis matrix template helps you in positioning of SWOT factors as bubbles on bubble chart by size/ scale (X axis) and relevance/ importance (Y axis). The diameter of bubbles shows strategic impact of SWOT factors.
The template "SWOT analysis positioning matrix" for the ConceptDraw PRO diagramming and vector drawing software is included in the SWOT Analysis solution from the Management area of ConceptDraw Solution Park.
The template "SWOT analysis positioning matrix" for the ConceptDraw PRO diagramming and vector drawing software is included in the SWOT Analysis solution from the Management area of ConceptDraw Solution Park.
The vector stencils library "Sales dashboard" contains 27 charts and indicators: bar charts, line graphs, gauges, sliders, pie charts, divided bar diagrams, bubble indicators, bullet indicators.
The design elements library "Sales dashboard" for the ConceptDraw PRO diagramming and vector drawing software is included in the Sales Dashboard solution from the Marketing area of ConceptDraw Solution Park.
The design elements library "Sales dashboard" for the ConceptDraw PRO diagramming and vector drawing software is included in the Sales Dashboard solution from the Marketing area of ConceptDraw Solution Park.
- Bubble Diagrams | Bubble Map Maker | SWOT and TOWS Matrix ...
- Bubble diagrams in Landscape Design with ConceptDraw PRO ...
- How To Create a Visio Bubble Chart Using ConceptDraw PRO ...
- How to Add a Bubble Diagram to a PowerPoint Presentation Using ...
- Bubble diagrams with ConceptDraw PRO | Bubble Charts | Bubble ...
- How to Draw a Bubble Chart | How To Create a Bubble Chart | How ...
- How To Make a Bubble Chart | Bubble diagrams with ConceptDraw ...
- Basic Flowchart Symbols and Meaning | How to Add a Bubble ...
- Bubble Diagrams | ATM UML Diagrams | Enterprise Architecture ...
- How to Create a Bubble Diagram Using ConceptDraw PRO | Bubble ...
- How to Create a Bubble Diagram Using ConceptDraw PRO | How to ...
- How to Draw a Bubble Chart | How to Create a Bubble Diagram ...
- Bubble Diagrams For Logic Design
- Bubble Diagrams | Bubble diagrams in Landscape Design with ...
- How to Draw a Bubble Chart
- How to Draw a Bubble Chart | SWOT analysis positioning matrix ...
- Bubble Diagram Drawing Software
- Bubble diagrams in Landscape Design with ConceptDraw PRO
- SWOT analysis positioning matrix - Template | How to Add a Bubble ...
- Bubble Chart For Market Analysis


