Bubble diagrams in Landscape Design with ConceptDraw DIAGRAM
Bubble Diagrams are the charts with a bubble presentation of data with obligatory consideration of bubble's sizes. They are analogs of Mind Maps and find their application at many fields, and even in landscape design. At this case the bubbles are applied to illustrate the arrangement of different areas of future landscape design, such as lawns, flowerbeds, playgrounds, pools, recreation areas, etc. Bubble Diagram helps to see instantly the whole project, it is easy for design and quite informative, in most cases it reflects all needed information. Often Bubble Diagram is used as a draft for the future landscape project, on the first stage of its design, and in case of approval of chosen design concept is created advanced detailed landscape plan with specification of plants and used materials. Creation of Bubble Diagrams for landscape in ConceptDraw DIAGRAM software is an easy task thanks to the Bubble Diagrams solution from "Diagrams" area. You can use the ready scanned location plan as the base or create it easy using the special ConceptDraw libraries and templates.
 Bubble Diagrams
Bubble diagrams have enjoyed great success in software engineering, architecture, economics, medicine, landscape design, scientific and educational process, for ideas organization during brainstorming, for making business illustrations, presentations, planning, design, and strategy development. They are popular because of their simplicity and their powerful visual communication attributes.
HelpDesk
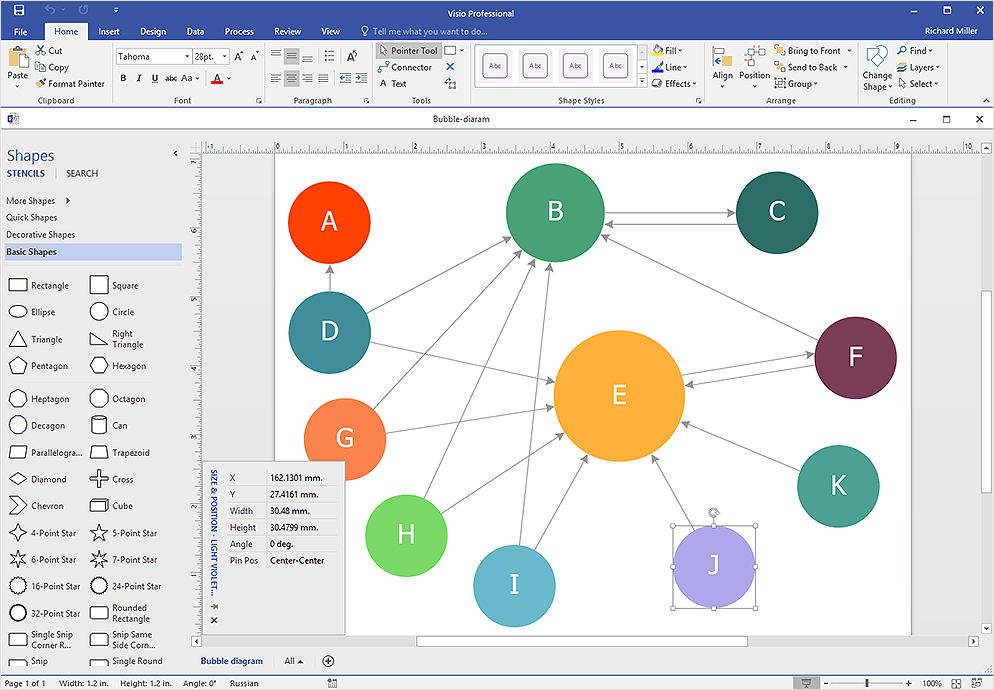
How To Create Visio Bubble Chart
ConceptDraw DIAGRAM allows you to easily create business charts and diagrams of any complexity, including the bubbles diagram and then make a MS Visio file from your diagram in a few simple steps.HelpDesk
How to Add a Bubble Diagram to MS Word
A bubble chart is a diagram in which the data points are replaced with bubbles, and the size of the bubbles represents some additional dimension of the data. A bubble chart does not have the axis. A bubble chart can be used instead of a scatter diagram if the data has three dimensions, each of that containing the set of values. The sizes of the bubbles are determined by the values in the third dimension. Any additional information about the entities beyond their three primary dimensions can be depicted by rendering bubbles in colors and patterns that are selected in a certain way. The legend containing the further information can be added to a bubble diagram. ConceptDraw DIAGRAM allows you to easily create various business management and marketing charts, including bubble diagrams and then add them to a MS Word document.HelpDesk
How to Create a Bubble Diagram
Bubble Diagram is a simple chart that consists of circles (bubbles) repesening certain topics or processes. Bubbles are connected by lines depicting the type of relationships between the bubbles. The size of each bubble is depended on the importance of the entity it represents. Bubble charts are widely used throughout social, economical, medical, and other scientific researches as well as throughout architecture and business management. Bubble charts are often used during the early stages of product development to visualize thoughts and ideas for the purpose of sketching out a development plan. ConceptDraw DIAGRAM allows you to draw a bubble diagrams using the Bubble Diagrams solution.- Create Floor Plans easily with ConceptDraw PRO! | Bubble ...
- How To use Landscape Design Software | Bubble diagrams in ...
- How to Add a Bubble Diagram to a PowerPoint Presentation Using ...
- Applications | Universal Diagramming Area | Interior Design ...
- How To use Landscape Design Software | Bubble diagrams in ...
- Cafe and Restaurant Floor Plan | Bubble diagrams in Landscape ...
- How To Create Restaurant Floor Plans in Minutes | Interior Design ...
- How To use Landscape Design Software | Bubble diagrams in ...
- Interior Design Site Plan - Design Elements | Design elements ...
- Parking Building Bubble Diagram
- Flowchart on Bank. Flowchart Examples | Bubble diagrams in ...
- Landscape Architecture with ConceptDraw PRO | How To use ...
- Seven Management and Planning Tools | Bubble diagrams in ...
- How to Create a Bubble Diagram Using ConceptDraw PRO | Bubble ...
- How To Design Building With Plan In A Concept
- Landscape & Garden | How To use Landscape Design Software ...
- Landscape architecture with ConceptDraw PRO | Bubble diagrams ...
- Bubble Diagram Drawing Software
- Café Floor Plan Design Software | How To Create Restaurant Floor ...


