How To Create a Bubble Chart
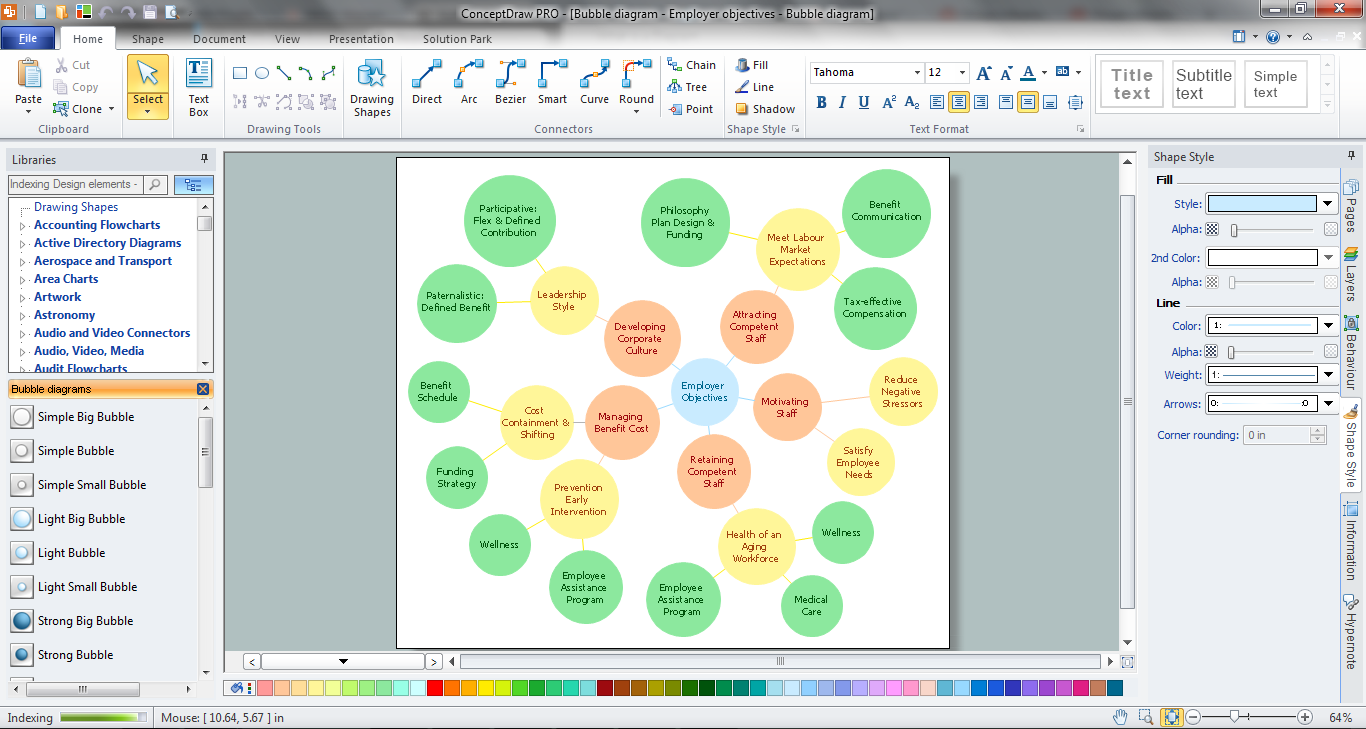
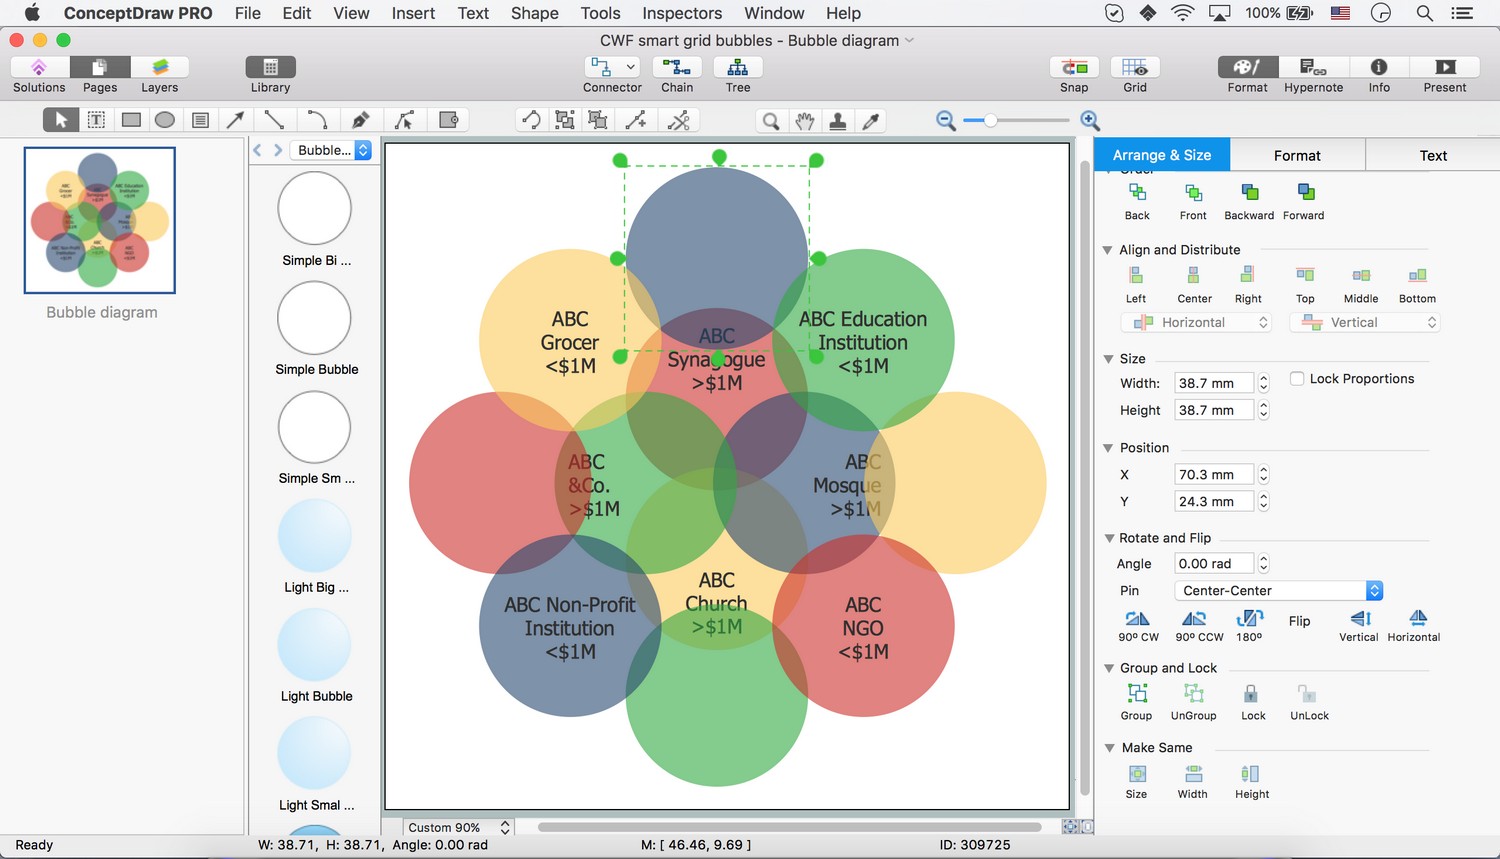
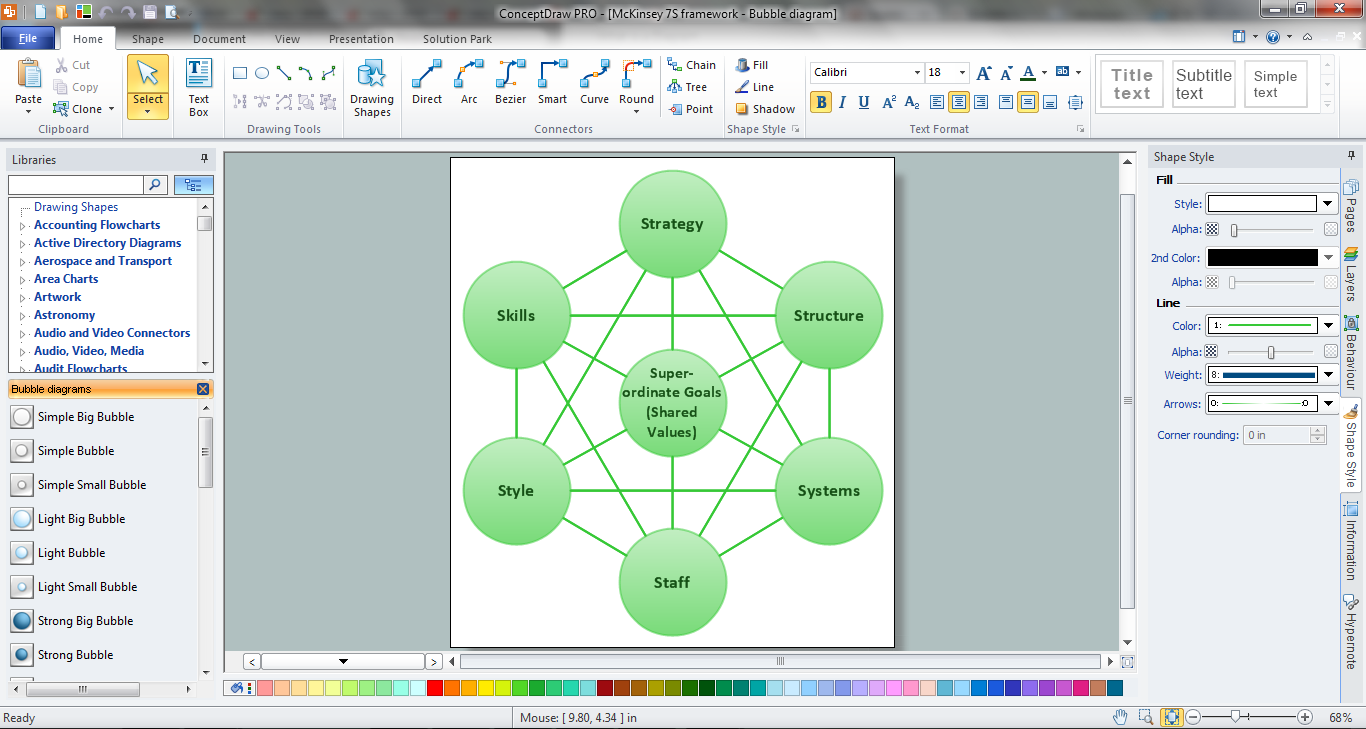
Bubble diagrams solution extends ConceptDraw PRO software with templates, Using ConceptDraw Connectors, you can create a bubble chart in moments. Using ConceptDraw you will be able to create a bubble chart from the ready ConceptDraw library objects or make your own objects. The created diagram can represent ideas organization, in brainstorming processes, by teachers for explaining difficult ideas or for presentations.Four Dimensions Bubble Plot
This sample was created in ConceptDraw PRO diagramming and vector drawing software using the Bubble Diagrams Solution from the "What is a Diagram" area of ConceptDraw Solution Park. This sample clearly shows the Four Dimensions Bubble Diagram of the distribution of chlorine contaminant in the water source. This Bubble Diagram is very useful in the chemistry, hydrology, and ecology.Bubble Chart
How to design a Bubble Chart? It’s very easy! All that you need is a powerful software. Never before creation of a Bubble Chart wasn’t so easy as now with tools of Bubble Diagrams Solution from the "What is a Diagram" Area for ConceptDraw Solution Park.Bubble Plot
This sample was created in ConceptDraw PRO diagramming and vector drawing software using the Bubble Diagrams Solution from the ConceptDraw Solution Park. This sample shows the BCG (Boston Consulting Group) matrix that is used in marketing and product management for strategic analysis and planning.How To Make a Bubble Chart
Bubble diagrams solution extends ConceptDraw PRO software with templates, Using ConceptDraw Connectors, you can make a bubble chart in moments. Using ConceptDraw you will be able to make a bubble chart from the ready ConceptDraw library objects or make your own objects. The created diagram can represent ideas organization, in brainstorming processes, by teachers for explaining difficult ideas or for presentations.Bubble Chart Maker
ConceptDraw PRO diagramming and vector drawing software extended with Bubble Diagrams Solution from the "What is a Diagram" Area is a powerful Bubble Chart Maker.Bubble Charts
Bubble Charts are convenient way to visualize ideas and concepts by organizing them in a hierarchy. To show the importance of ideas you can use different bubble sizes and colors. ConceptDraw PRO diagramming and vector drawing software extended with Bubble Diagrams Solution from the "What is a Diagram" Area affords you the easiest and fastest way for designing professional looking Bubble Charts.How to Draw a Bubble Chart
Video tutorials on ConceptDraw products. Try it today!Best Diagramming Software for macOS
ConceptDraw PRO creates drawings, flowcharts, block diagrams, bar charts, histograms, pie charts, divided bar diagrams, line graphs, area charts, scatter plots, circular arrows diagrams, Venn diagrams, bubble diagrams with great visual appeal on Mac OS X.
Bubble diagrams with ConceptDraw PRO
Using ConceptDraw you will be able to create bubble diagrams from the ready ConceptDraw library objects or make your own objects. The created diagram can be saved and edited, objects can be moved and links between them will be automatically repainted after object moving because of using the ConceptDraw connectors.Basic Diagramming
Create flowcharts, organizational charts, bar charts, line graphs, and more with ConceptDraw PRO.
Best Diagramming
Need to draw a diagram, process chart, flowchart, organizational chart, graphic design? ConceptDraw can help you to make professional graphic documents quickly.
Bubble Map Maker
The Bubble Map is a popular tool for visualization a data set which is widely used in economics, medicine, software engineering, architecture, and many other fields. Each bubble on the Bubble Map is characterized by coordinates, color and size. ConceptDraw PRO diagramming and vector drawing software extended with Bubble Diagrams Solution from the "What is a Diagram" Area is a powerful Bubble Map Maker.Best Multi-Platform Diagram Software
ConceptDraw PRO is a powerful tool for drawing business communication ideas and concepts, simple visual presentation of numerical data in the Mac environment.
 Bubble Diagrams
Bubble diagrams have enjoyed great success in software engineering, architecture, economics, medicine, landscape design, scientific and educational process, for ideas organization during brainstorming, for making business illustrations, presentations, planning, design, and strategy development. They are popular because of their simplicity and their powerful visual communication attributes.
- How To Create a Bubble Chart | Bubble Chart Maker | Best ...
- Bubble Chart | How To Create a Bubble Chart | Bubble Chart Maker ...
- Bubble Plot | Matrices | Marketing Area | Boston Matrix Bubble ...
- How To Create a Bubble Chart | Bubble diagrams in Landscape ...
- Bubble Chart Maker | How To Create a Bubble Chart | Flow Diagram ...
- Bubble Chart Example
- Bubble Chart
- Four Dimensions Bubble Plot | Scatter Plot | Blank Scatter Plot | Plot ...
- Best Diagramming | Scatter Chart Examples | Four Dimensions ...
- Scatter Chart Examples | Bubble Plot | Four Dimensions Bubble Plot ...
- Bubble Chart | How to Draw a Bubble Chart | Bubble Chart Maker ...
- How To Create a Visio Bubble Chart Using ConceptDraw PRO ...
- How To Create a Bubble Chart | How to Draw a Bubble Chart ...
- Bubble Chart Examples
- Bar Chart Software | Bubble Chart | Line Graph Charting Software ...
- Best Diagramming Software for Mac | How To Create a Bubble Chart ...
- Bubble Chart | Bubble Chart Maker | Bar Chart Software | Elements ...
- Bubble Plot | Matrices | Marketing Area | Sample Scatter Graph For ...
- Bubble Chart | Entity Relationship Software | How To Create a ...


