HelpDesk
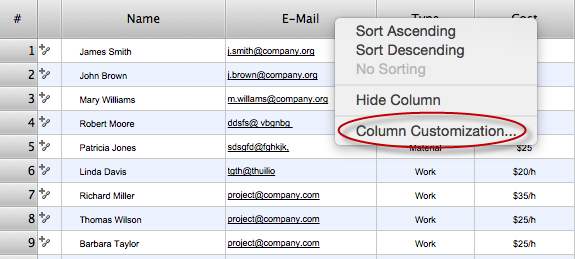
How to Determine what Information to be Displayed in the Project Resource List
After you create a project task list it is necessary move to resource planning. You need to determine and assign resources on each task. There are several types of resources defined in ConceptDraw PROJECT: work, material, cost and equipment. The columns of a project Resource List in ConceptDraw PROJECT displays the information you need to capture about each resource in your project.
HelpDesk
What Information to be Displayed in the ConceptDraw PROJECT Gantt Chart View
What information can can contain the project task list? Gantt Chart view is a graphical representation of a project outline that allows one to allocate tasks.You can customize a project’s tasks list view to include the columns you need to meet your information requirements. The columns of the ConceptDraw PROJECT Gantt view contain the information you want to capture about each task in your project. The following article details what information can be contained in the columns of a project outline:<
HelpDesk
How to Create an ERD Diagram
ERD (entity relationship diagram) is used to show the logical structure of databases. It represents the interrelationships between components of database (entities). Entity relationship diagrams are a widely used in software engineering. Using ERD software engineers can control the every aspect of database development. ER diagram can be used as guide for testing and communicating before the release of software product. ERD displays data as entities that are connected with connections that show the relationships between entities. There is some ERD notations used by data bases developers for representing the relationships between the data objects. ConceptDraw PRO and its ERD solution allow you to build ERD diagram of any notation.Product Overview
ConceptDraw PROJECT is a vigorous tool for managing single or multiple projects. It lets you determine all essential elements involved into project, control schedules, resources and finances, and monitor projects' progress in most effective yet simple manner.- Basic Business Column Of Any Product
- Any Products Business Diagram
- Budiness Pyramid Drawing
- Draw Your Own Pyramid Of Business
- Draw A Simple Skeletal Building Design Of Any Office
- Basic Flowchart Symbols and Meaning | Process Flowchart | Draw ...
- Draw The Diagram That Shows Important Elements In Business
- Competitive Analysis Relationship Diagram Of Any Product
- How to Draw a Gantt Chart Using ConceptDraw PRO | How to Draw ...
- Sales Growth. Bar Graphs Example | Sales KPIs and Metrics - Vector ...
- Support calls by products - Business dashboard | Business ...
- Pyramid Diagram and Pyramid Chart | Step Area Graph | Column ...
- Business Chart Example
- Competitive feature comparison matrix chart - Digital scouting ...
- ConceptDraw PRO The best Business Drawing Software | How to ...
- Download and Install ConceptDraw Office on Mac | Downloading ...
- ConceptDraw PRO The best Business Drawing Software
- Choose Any Product And Any Service
- ConceptDraw Software Full Versions Free Download | ConceptDraw ...


