HelpDesk
How to Create a Picture Graph in ConceptDraw PRO
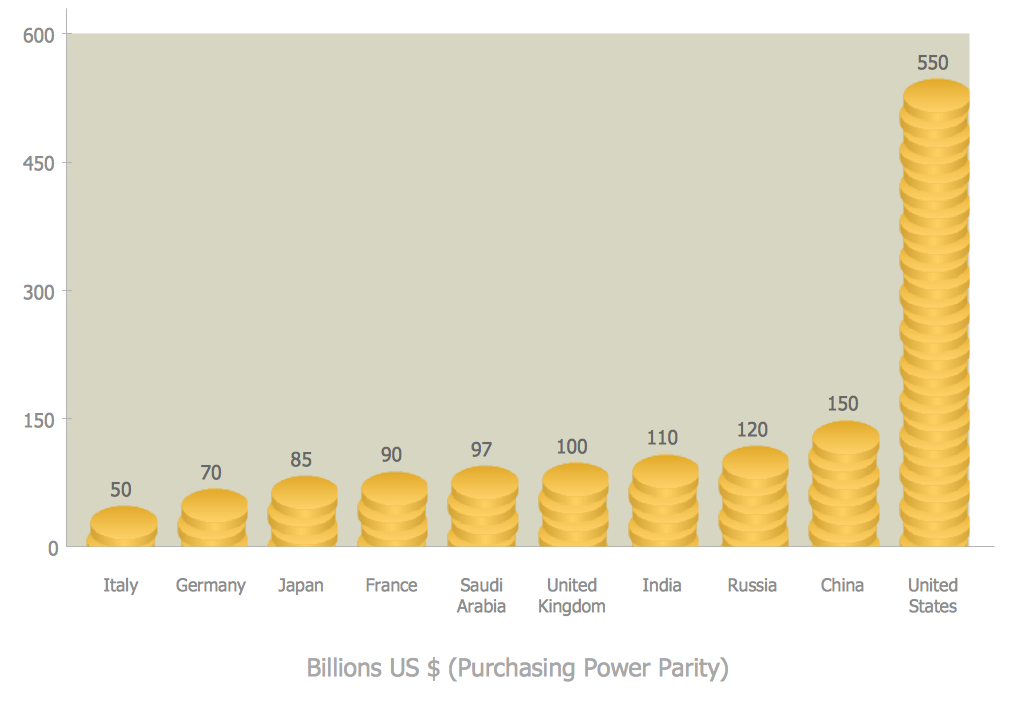
Picture Graphs are used commonly to represent non-complex data to a large audience. A Picture Graph is simple kind of marketing diagram used to show the relationship among various quantities. It include pictures or symbols to represent information visually. There are many cases when you have just some numbers to show and compare. This is not a reason to not use visual tools. You can produce a simple picture graph using memorable symbols to get the best visual presentation. Using specific symbols instead of regular colored bars makes picture graphs a much more descriptive tool. You can use tools from an existing library or find appropriate clipart in ConceptDraw’s collection. ConceptDraw PRO allows you to draw a simple and easy to understand Graph Charts using the special library.HelpDesk
How to Save a Drawing as a Graphic File in ConceptDraw PRO
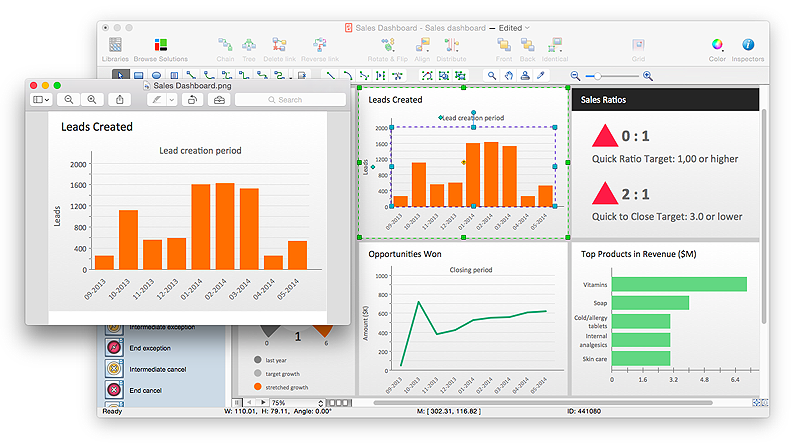
ConceptDraw PRO can save your drawings and diagrams in a number of highly useful formats, including graphic files. You can save your drawing as a .PNG, .JPG, or other graphic format file.
 ConceptDraw Solution Park
ConceptDraw Solution Park collects graphic extensions, examples and learning materials
 Value Stream Mapping
Value stream mapping solution extends ConceptDraw PRO software with templates, samples and vector stencils for drawing the Value Stream Maps (VSM) in lean manufacturing practice.
 Picture Graphs
Typically, a Picture Graph has very broad usage. They many times used successfully in marketing, management, and manufacturing. The Picture Graphs Solution extends the capabilities of ConceptDraw PRO v10 with templates, samples, and a library of professionally developed vector stencils for designing Picture Graphs.
 Computer Network Diagrams
Computer Network Diagrams solution extends ConceptDraw PRO software with samples, templates and libraries of vector stencils for drawing the computer network topology diagrams.
 Business Process Diagrams
Business Process Diagrams solution extends the ConceptDraw PRO BPM software with RapidDraw interface, templates, samples and numerous libraries based on the BPMN 1.2 and BPMN 2.0 standards, which give you the possibility to visualize equally easy simple and complex processes, to design business models, to quickly develop and document in details any business processes on the stages of project’s planning and implementation.
 Marketing Diagrams
This solution extends ConceptDraw PRO with samples, templates and library of design elements for drawing the marketing diagrams.
 Entity-Relationship Diagram (ERD)
An Entity-Relationship Diagram (ERD) is a visual presentation of entities and relationships. That type of diagrams is often used in the semi-structured or unstructured data in databases and information systems. At first glance ERD is similar to a flowch
- Workflow Diagrams | Business Processes | Types of Flowchart ...
- Diagram Images
- Fishbone Diagram | Business Productivity Diagramming | Business ...
- Business Process Diagram | Target and Circular Diagrams | Matrices
- Rapid UML | Cross-Functional Flowchart | Business Diagram ...
- Basic Flowchart Images . Flowchart Examples | Business and ...
- Images Of Fishbone Diagram
- Manufacturing Pictures Diagram
- PM Dashboards | Business Diagram Software | Project — Working ...
- Picture Showing Fishbone Diagram In Tqm
- How to Create a Picture Graph in ConceptDraw PRO | Process ...
- Picture Graphs | Types of Flowchart - Overview | Business and ...
- Business and Finance | Picture Graphs | How to Create a Picture ...
- Manufacturing and Maintenance | Picture Graphs | Types of ...
- Basic Flowchart Images . Flowchart Examples | Basic Audit Flowchart ...
- Entity-Relationship Diagram (ERD)
- How to Create a Picture Graph in ConceptDraw PRO | Picture ...
- UML Tool & UML Diagram Examples | UML Diagram | Entity ...
- Business and Finance | Business People Clipart | Advertising ...

