 ConceptDraw Solution Park
ConceptDraw Solution Park collects graphic extensions, examples and learning materials
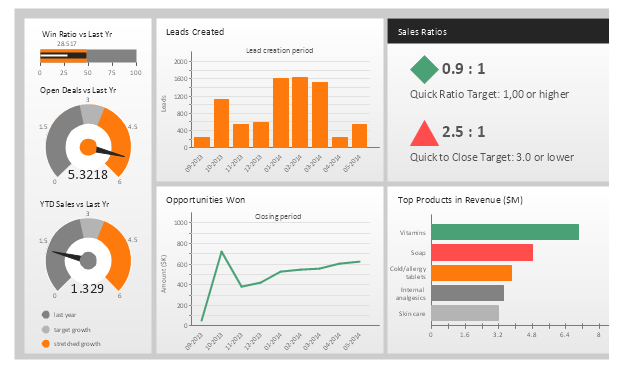
This sales performance dashboard example includes KPIs indicators and business metrics charts: bullet indicator - "Win Ratio vs. Last Year", gauge (speedometer) indicators - "Open Deals vs. Last Year" and "YTD Sales vs. Last Year", column chart - "Leads created", line chart - "Opportunities Won", alarm indicators - "Sales Ratios", horizontal bar chart - "Top Products in Revenue".
The example "Sales performance dashboard" was created using the ConceptDraw PRO diagramming and vector drawing software extended with the Sales Dashboard solution from the Marketing area of ConceptDraw Solution Park.
www.conceptdraw.com/ solution-park/ marketing-sales-dashboard
The example "Sales performance dashboard" was created using the ConceptDraw PRO diagramming and vector drawing software extended with the Sales Dashboard solution from the Marketing area of ConceptDraw Solution Park.
www.conceptdraw.com/ solution-park/ marketing-sales-dashboard
- Business Graphics Software | Data Visualization Software Solutions ...
- Sales Dashboard | Sales Dashboard - Access Anywhere | Business ...
- Cross-Functional Flowchart (Swim Lanes) | Swim Lane Diagrams ...
- Business Process Modeling Notation Template | Workflow Diagram ...
- KPIs and Metrics | Line Graph Charting Software | Correlation ...
- Electrical Drawing Software | How To use House Electrical Plan ...
- Activity Network (PERT) Chart | Affinity Diagram Software | Activity ...
- Cafe performance metrics vs. air temperature - Visual dashboard ...
- Competitive feature comparison matrix chart - Digital scouting ...
- SWOT Template | New business opportunity SWOT analysis matrix ...
- Performance Indicators | How to Create a Sales Dashboard | PM ...
- Performance Indicators | What is a KPI? | KPI Dashboard | Key ...
- What Is A Product Element Chart In Marketing
- Seven Management and Planning Tools | Design elements ...
- Sales KPIs and Metrics - Vector stencils library | Design elements ...
- Marketing Mix Software
- KPI Dashboard | What is a KPI? | Performance Indicators | Kpi ...
- Design elements - Composition charts and indicators | Pie Chart ...
- Performance Indicators | Constant improvement of key performance ...
- Performance Indicators | What is a KPI? | Enterprise dashboard ...
