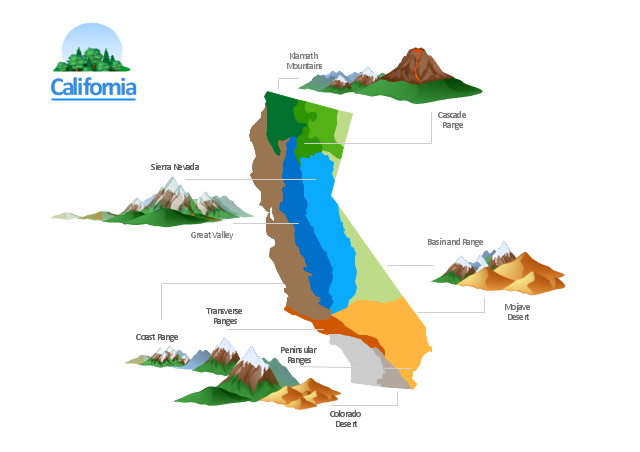
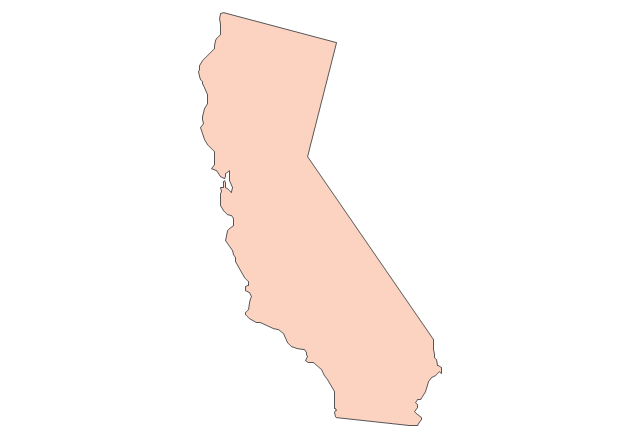
Geo Map - USA - California

Use the Geography vector clipart library for the ConceptDraw PRO diagramming and vector drawing software to add images of geographical features as landscape and body of water into your illustrations.
"Landscape comprises the visible features of an area of land, including the physical elements of landforms such as (ice-capped) mountains, hills, water bodies such as rivers, lakes, ponds and the sea, living elements of land cover including indigenous vegetation, human elements including different forms of land use, buildings and structures, and transitory elements such as lighting and weather conditions. ...
The Earth has a vast range of landscapes including the icy landscapes of polar regions, mountainous landscapes, vast arid desert landscapes, islands and coastal landscapes, densely forested or wooded landscapes including past boreal forests and tropical rainforests, and agricultural landscapes of temperate and tropical regions." [Landscape. Wikipedia]
The geographic illustration example California Relief is included in the Nature solution from the Illustration area of ConceptDraw Solution Park.
Infographics
Nature Drawings - How to Draw

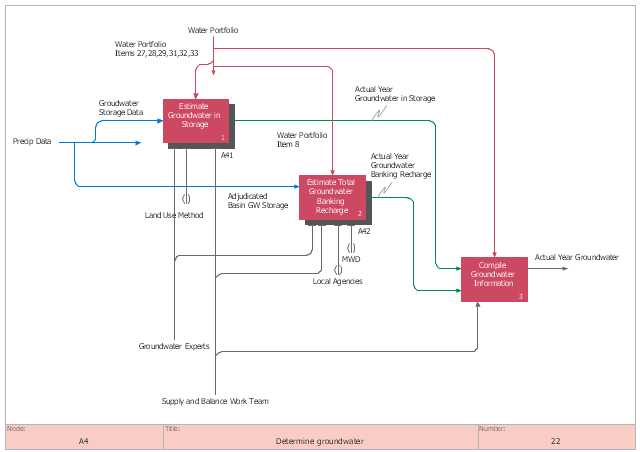
This IDEF0 diagram sample was created on the base of the figure from the California Water Plan website. [waterplan.water.ca.gov/ technical/ cwpu2009/ flowdiaghtml/ dgm18.htm]
"The California Water Plan provides a collaborative planning framework for elected officials, agencies, tribes, water and resource managers, businesses, academia, stakeholders, and the public to develop findings and recommendations and make informed decisions for California's water future. The plan, updated every five years, presents the status and trends of California's water-dependent natural resources; water supplies; and agricultural, urban, and environmental water demands for a range of plausible future scenarios. The California Water Plan also evaluates different combinations of regional and statewide resource management strategies to reduce water demand, increase water supply, reduce flood risk, improve water quality, and enhance environmental and resource stewardship. The evaluations and assessments performed for the plan help identify effective actions and policies for meeting California's resource management objectives in the near term and for several decades to come." [waterplan.water.ca.gov]
The IDEF0 diagram example "Determine groundwater" was created using the ConceptDraw PRO diagramming and vector drawing software extended with the IDEF0 Diagrams solution from the Software Development area of ConceptDraw Solution Park.
IDEF0 diagram
The vector stencils library "North America" contains 70 contours for drawing thematic maps of North America in spatial infographics.
Use it for visual representation of geospatial information, statistics and quantitative data in the ConceptDraw PRO diagramming and vector drawing software extended with the Spatial Infographics solution from the area "What is Infographics" of ConceptDraw Solution Park.
Use it for visual representation of geospatial information, statistics and quantitative data in the ConceptDraw PRO diagramming and vector drawing software extended with the Spatial Infographics solution from the area "What is Infographics" of ConceptDraw Solution Park.
North America
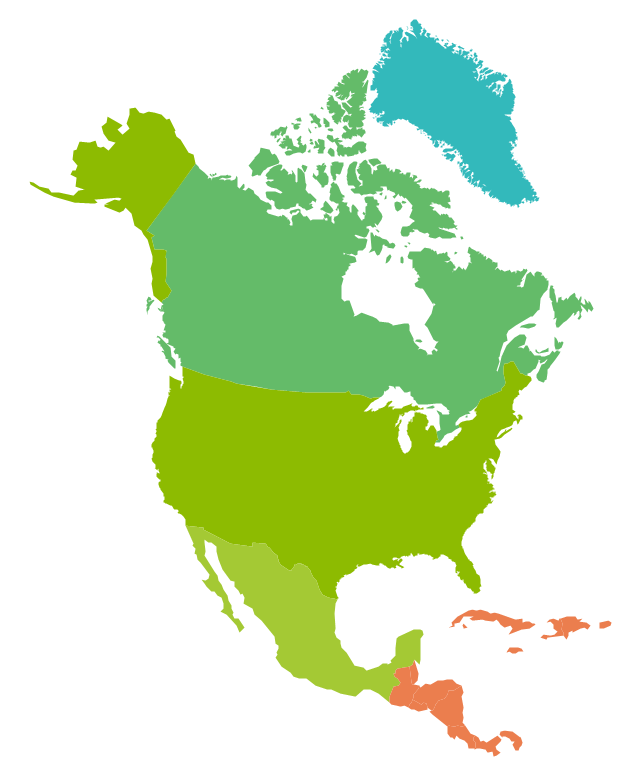
Greenland (Denmark)
-north-america---vector-stencils-library.png--diagram-flowchart-example.png)
Canada
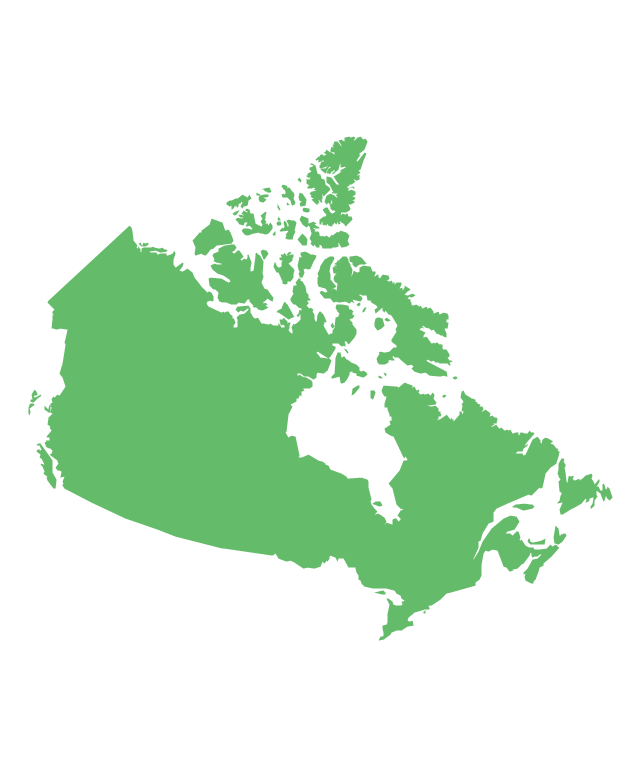
Canada (provinces and territories)
-north-america---vector-stencils-library.png--diagram-flowchart-example.png)
Alberta
British Columbia
Manitoba
New Brunswick
Newfoundland and Labrador
Northwest Territories
Nova Scotia
Nunavut
Ontario
Prince Edward Island

Quebec
Saskatchewan

Yukon

USA
US states

Alabama

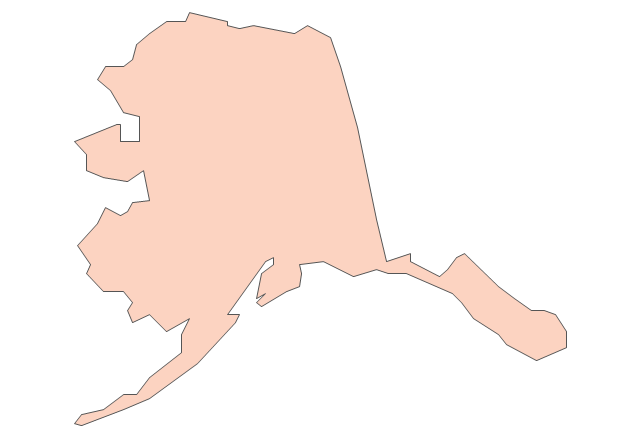
Alaska
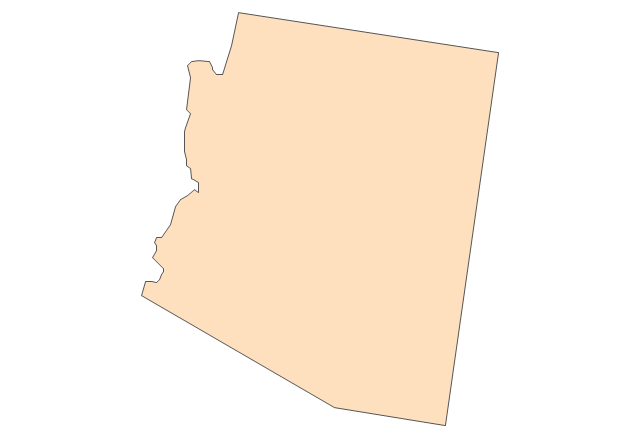
Arizona
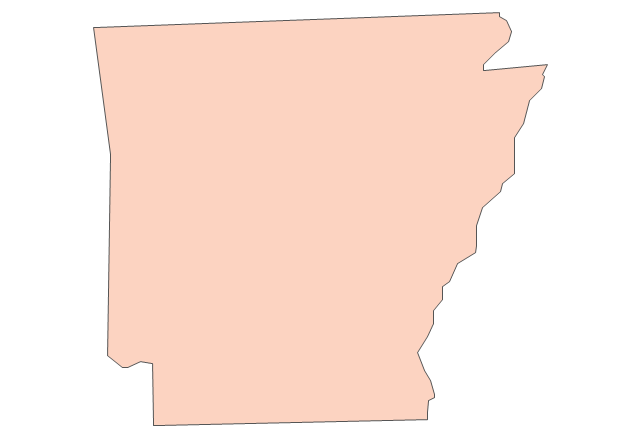
Arkansas

California
Colorado

Connecticut

Delaware

Florida
Georgia
Hawaii
Idaho

Illinois

Indiana

Iowa

Kansas

Kentucky

Louisiana
Maine
Maryland
Massachusetts

Michigan
Minnesota

Mississippi

Missouri

Montana
Nebraska

Nevada

New Hampshire

New Jersey

New Mexico

New York
North Carolina
North Dakota

Ohio
Oklahoma

Oregon
Pennsylvania

Rhode Island

South Carolina
South Dakota
Tennessee

Texas
Utah

Vermont

Virginia

Washington
West Virginia
Wisconsin
Wyoming

Mexico
Geo Map - USA - Arizona

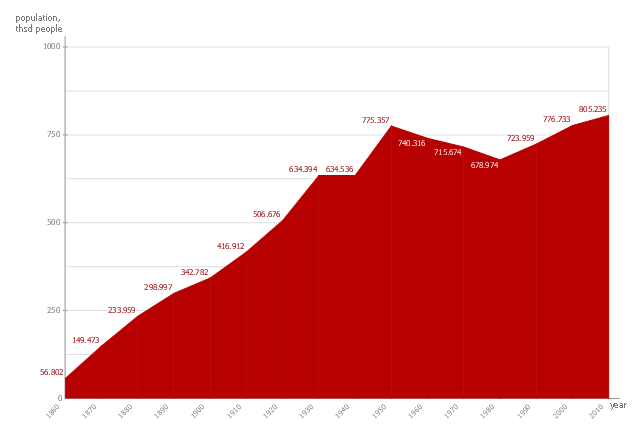
This area chart sample shows the San Francisco population changes from 1860 to 2010.
"San Francisco ..., officially the City and County of San Francisco, is the leading financial and cultural center of Northern California and the San Francisco Bay Area.
The only consolidated city-county in California, San Francisco encompasses a land area of about 46.9 square miles (121 km2) on the northern end of the San Francisco Peninsula, giving it a density of about 17,620 people per square mile (6,803 people per km2). It is the most densely settled large city (population greater than 200,000) in the state of California and the second-most densely populated major city in the United States after New York City. San Francisco is the fourth most populous city in California, after Los Angeles, San Diego and San Jose, and the 14th most populous city in the United States—with a Census-estimated 2012 population of 825,863. The city is also the financial and cultural hub of the larger San Jose-San Francisco-Oakland metropolitan area, with a population of 8.4 million." [San Francisco. Wikipedia]
The area graph example "San Francisco population history" was created using the ConceptDraw PRO diagramming and vector drawing software extended with the Area Charts solution from the Graphs and Charts area of ConceptDraw Solution Park.
Area chart
This area chart sample shows the population growth of San Francisco, California from 1850-2005. It was redesigned from the Wikimedia Commons file: San Francisco CA Population Growth.svg. [commons.wikimedia.org/ wiki/ File:San_ Francisco_ CA_ Population_ Growth.svg]
"The San Francisco Bay Area, commonly known as the Bay Area, is a populated region that surrounds the San Francisco and San Pablo estuaries in Northern California, United States. The region encompasses the major cities and metropolitan areas of San Francisco, Oakland, and San Jose, along with smaller urban and rural areas. The Bay Area's nine counties are Alameda, Contra Costa, Marin, Napa, San Francisco, San Mateo, Santa Clara, Solano, and Sonoma. Home to approximately 7.44 million people, the nine-county Bay Area contains many cities, towns, airports, and associated regional, state, and national parks, connected by a network of roads, highways, railroads, bridges, tunnels and commuter rail. The combined urban area of San Francisco and San Jose is the second largest in California (after the Greater Los Angeles area), the fifth largest in the United States, and the 56th largest urban area in the world." [San Francisco Bay Area. Wikipedia]
The area graph example "San Francisco CA Population Growth" was created using the ConceptDraw PRO diagramming and vector drawing software extended with the Area Charts solution from the Graphs and Charts area of ConceptDraw Solution Park.
Area chart

Geo Map - USA - Delaware

This divided bar chart sample shows the petroleum products yielded from 1 barrel of crude oil in California in 2004. It was drawn using data from the chart on the California Energy Almanac website. [energyalmanac.ca.gov/ gasoline/ whats_ in_ barrel_ oil.html]
"Petroleum products are useful materials derived from crude oil (petroleum) as it is processed in oil refineries. Unlike petrochemicals, which are a collection of well-defined usually pure chemical compounds, petroleum products are complex mixtures. The majority of petroleum is converted to petroleum products, which includes several classes of fuels.
According to the composition of the crude oil and depending on the demands of the market, refineries can produce different shares of petroleum products. The largest share of oil products is used as "energy carriers", i.e. various grades of fuel oil and gasoline. These fuels include or can be blended to give gasoline, jet fuel, diesel fuel, heating oil, and heavier fuel oils. Heavier (less volatile) fractions can also be used to produce asphalt, tar, paraffin wax, lubricating and other heavy oils. Refineries also produce other chemicals, some of which are used in chemical processes to produce plastics and other useful materials. Since petroleum often contains a few percent sulfur-containing molecules, elemental sulfur is also often produced as a petroleum product. Carbon, in the form of petroleum coke, and hydrogen may also be produced as petroleum products. The hydrogen produced is often used as an intermediate product for other oil refinery processes such as hydrocracking and hydrodesulfurization." [Petroleum product. Wikipedia]
The chart example "Petroleum products yielded from one barrel of crude oil" was created using the ConceptDraw PRO diagramming and vector drawing software extended with the Divided Bar Diagrams solution from the Graphs and Charts area of ConceptDraw Solution Park.
Divided bar chart

Geo Map - USA - New Mexico

The vector stencils library "North America" contains 70 contours for drawing thematic maps of North America in spatial infographics.
Use it for visual representation of geospatial information, statistics and quantitative data in the ConceptDraw PRO diagramming and vector drawing software extended with the Spatial Infographics solution from the area "What is Infographics" of ConceptDraw Solution Park.
Use it for visual representation of geospatial information, statistics and quantitative data in the ConceptDraw PRO diagramming and vector drawing software extended with the Spatial Infographics solution from the area "What is Infographics" of ConceptDraw Solution Park.
North America
Greenland (Denmark)
Canada
Canada (provinces and territories)
Alberta
British Columbia
Manitoba
New Brunswick
Newfoundland and Labrador
Northwest Territories
Nova Scotia
Nunavut
Ontario
Prince Edward Island
Quebec
Saskatchewan
Yukon
USA
US states
Alabama
Alaska
Arizona
Arkansas
California
Colorado
Connecticut
Delaware
Florida
Georgia
Hawaii
Idaho
Illinois
Indiana
Iowa
Kansas
Kentucky
Louisiana
Maine
Maryland
Massachusetts
Michigan
Minnesota
Mississippi
Missouri
Montana
Nebraska
Nevada
New Hampshire
New Jersey
New Mexico
New York
North Carolina
North Dakota
Ohio
Oklahoma
Oregon
Pennsylvania
Rhode Island
South Carolina
South Dakota
Tennessee
Texas
Utah
Vermont
Virginia
Washington
West Virginia
Wisconsin
Wyoming
Mexico
Geo Map - USA - Utah

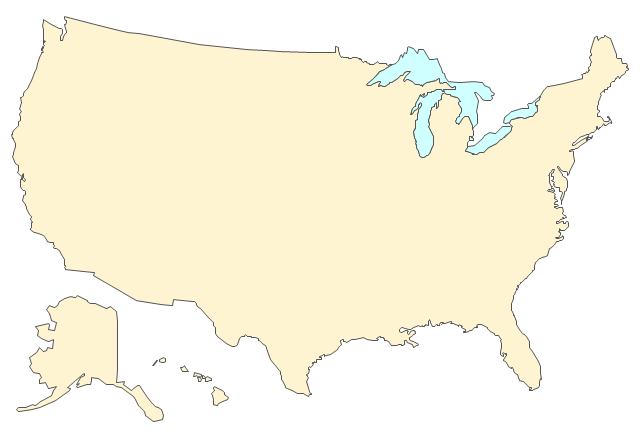
The vector stencils library "United States of America" contains 53 state map contours for drawing thematic maps of USA.
Use it for visual representation of geospatial information, statistics and quantitative data.
The state map contours example "United States of America - Vector stencils library" was created using the ConceptDraw PRO diagramming and vector drawing software extended with the Continent Maps solution from the Maps area of ConceptDraw Solution Park.
USA (color)
-united-states-of-america---vector-stencils-library.png--diagram-flowchart-example.png)
USA
Alabama
Alaska
Arizona
Arkansas
California
Colorado
Connecticut
Delaware
Florida
Georgia
Hawaii
Idaho
Illinois
Indiana
Iowa
Kansas
Kentucky
Louisiana
Maine
Maryland
Massachusetts
Michigan
Minnesota
Mississippi
Missouri
Montana
Nebraska
Nevada
New Hampshire
New Jersey
New York
New Mexico
North Dakota
North Carolina
Ohio
Oklahoma
Oregon
Pennsylvania
Rhode Island
South Carolina
South Dakota
Tennessee
Texas
Utah
Vermont
Virginia
Washington
West Virginia
Wisconsin
Wyoming
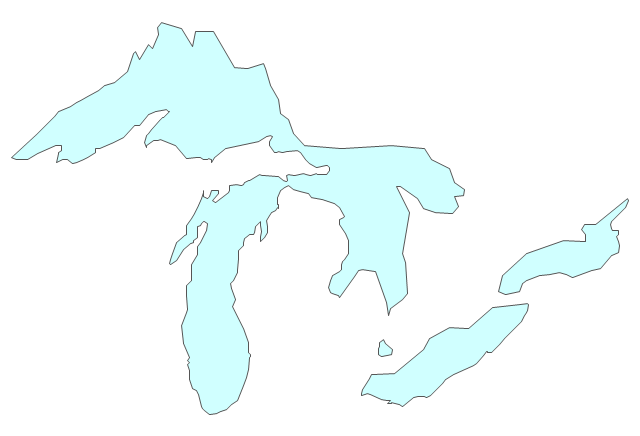
Great Lakes
This SWOT matrix diagram example was created on the base of article "An Easy Way To Jumpstart Your Strategic Plan: SWOT" by Leslie Wolf from the website of the California Digital Library, the University of California. "Strategic planning doesn’t have to be a daunting and lengthy process. The goal is really a simple one: to help you understand your world and build a road map to guide your efforts. ...
This analysis tool can help you focus your attention on the specific success factors that are right for your team.
The tool is called a SWOT analysis. SWOT stands for Strengths and Weaknesses, Opportunities and Threats. Here’s what it means:
(1) Strengths are those positive internal attributes that strengthen your business or team. You can develop plans to capitalize on those strengths.
(2) Weaknesses are those negative internal attributes that are working against your success. You can shore up those weaknesses so they don’t stop your success.
(3) Opportunities are those external conditions that can have a positive effect on your goals. These opportunities can point you in the right direction.
(4) Threats are those external conditions that can have a negative effect on your goals. These threats will affect you less if you can identify and minimize them. ...
We thought it would be helpful to show you a sample SWOT analysis for a business you can easily visualize: a small independent bookstore in a university town. The store owner brought the team together to think about how the bookstore could survive during the continuing financial downturn. After an hour of brainstorming, this is the SWOT analysis they developed." [cdlib.org/ cdlinfo/ 2010/ 09/ 29/ an-easy-way-to-jumpstart-your-strategic-plan-swot/ ]
The matrix diagram example "SWOT analysis for a small independent bookstore" was created using the ConceptDraw PRO diagramming and vector drawing software extended with the SWOT Analysis solution from the Management area of ConceptDraw Solution Park.
SWOT matrix

- Geo Map - USA - California | Nature Drawings - How to Draw | How ...
- California relief | California Landforms Map
- California relief | Nature Drawings - How to Draw | Nature ...
- California relief | Nature Drawings - How to Draw | Geo Map - USA ...
- California Map Landforms
- California relief | Important Landforms Of California
- Geo Map - USA - California | Nature Drawings - How to Draw | Map ...
- Geo Map - USA - California
- California relief | Geo Map - Europe - Russia | Geo Map - USA ...
- San Francisco population history - Area chart | Geo Map - USA ...
- California relief
- Geo Map - USA - Wisconsin | Geo Map - USA - California | Geo Map ...
- Geo Map - USA - Arizona | Geo Map - USA - California | Geo Map ...
- How To Draw Arizona Map
- USA Maps | Geo Map - USA - Virginia | Geo Map - USA - California ...
- Animals - Vector stencils library | USA Maps | California Bear
- Area Chart San Francisco Population History
- Geo Map - USA - California | Nature Drawings - How to Draw | Geo ...
- How To Draw Arizona