The vector stencils library "Mac OS X Lion user interface" contains 52 UI design elements.
Use it for designing Mac OS X Lion graphic user interface (GUI) of software for Apple computers in the ConceptDraw PRO diagramming and vector drawing software extended with the Graphic User Interface solution from the Software Development area of ConceptDraw Solution Park.
Use it for designing Mac OS X Lion graphic user interface (GUI) of software for Apple computers in the ConceptDraw PRO diagramming and vector drawing software extended with the Graphic User Interface solution from the Software Development area of ConceptDraw Solution Park.
Bar Chart Examples
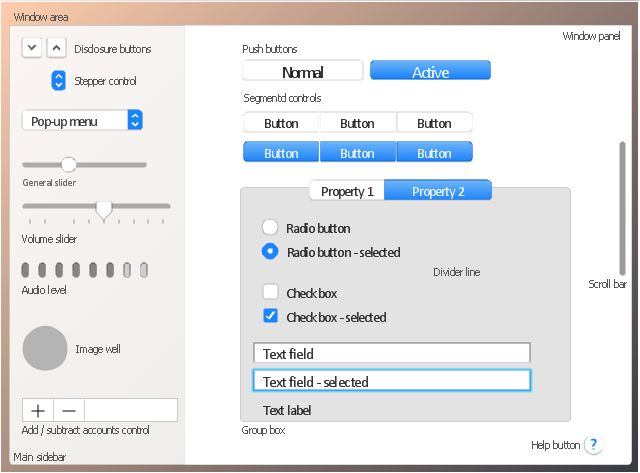
Complete set of bar chart examples is produced using ConceptDraw software. Surfing bar chart examples you can find an example that is the best for your case.The vector stencils library "General window elements" contains 31 window elements.
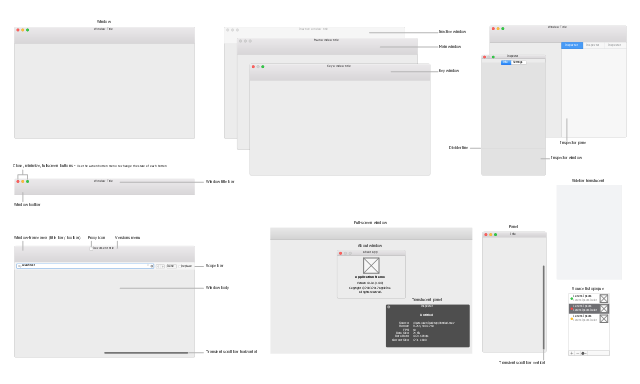
Use this window UI icon set to design graphic user interface (GUI) of your software application for OS X 10.10 Yosemite Apple Mac operating system.
"A window provides a frame for viewing and interacting with content in an app. ...
A window consists of window-frame areas and a window body. The window-frame areas are the title bar and toolbar, which are typically combined. ... The window body can extend from the top edge of the window (that is, underneath the combined title bar/ toolbar area) to the bottom edge of the window.
The window body represents the main content area of the window. ...
OS X defines appearances that can affect the look of controls and views in particular contexts, such as a window’s sidebar. ...
OS X specifies a set of control/ style combinations that are designed to look good on the toolbar, whether the toolbar is translucent or opaque. ...
Every document window, app window, and panel has, at a minimum:
- A title bar (or a combined title bar and toolbar), so that users can move the window.
- A close button, so that users have a consistent way to dismiss the window.
A standard document window may also have the following additional elements that an app window or panel might not have:
- Transient horizontal or vertical scroll bars, or both (if not all the window’s contents are visible).
- Minimize and fullscreen buttons (note that the fullscreen button changes to a zoom button if the window doesn’t support fullscreen mode or when users hold down the Option key).
- A proxy icon and a versions menu (after the user has given a document a name and save location for the first time).
- The title of the document (that functions as the title of the window).
- Transient resize controls." [https:/ / developer.apple.com/ library/ mac/ documentation/ UserExperience/ Conceptual/ OSXHIGuidelines/ WindowAppearanceBehavior.html#/ / apple_ ref/ doc/ uid/ 20000957-CH33-SW1]
The example "Design elements - General window elements" was created using the ConceptDraw PRO diagramming and vector drawing software extended with the Mac OS User Interface solution from the Software Development area of ConceptDraw Solution Park.
The vector stencils library "Mac OS X Lion user interface" contains 52 UI design elements.
Use it for designing Mac OS X Lion graphic user interface (GUI) of software for Apple computers in the ConceptDraw PRO diagramming and vector drawing software extended with the Graphic User Interface solution from the Software Development area of ConceptDraw Solution Park.
Use it for designing Mac OS X Lion graphic user interface (GUI) of software for Apple computers in the ConceptDraw PRO diagramming and vector drawing software extended with the Graphic User Interface solution from the Software Development area of ConceptDraw Solution Park.
How to Create a Bar Chart
The answer how to create a bar chart can be found in ConceptDraw software. The simple tips guide you through the software to quickly learn how to create a bar chart.HelpDesk
How to Create a Bar Chart in ConceptDraw PRO
Bar charts (bar graphs) are diagrams displaying data as horizontal or vertical bars of certain heights. Bar charts are widely used to show and compare the values of the same parameters for different data groups. The bar graph can be vertical or horizontal. This depends on the amount of categories. There are many methods in which bar graph can be built and this makes it a very often used chart type. Usually, a bar chart is created so that the bars are placed vertically. Such arrangement means that the bar's height value is proportional to the category value. Nevertheless, a bar chart can be also drawn horizontally. This means that the longer the bar, the bigger the category. Thus, a bar chart is a good way to present the relative values of different measured items. The ConceptDraw Bar Graphs solution allows you to draw a bar chart quickly using a vector library, containing the set of various bar charts objects.Bar Diagrams for Problem Solving. Create economics and financial bar charts with Bar Graphs Solution
Create bar graphs for visualizing economics problem solving and financial data comparison using the ConceptDraw PRO diagramming and vector drawing software extended with the Bar Graphs Solution from the Graphs and Charts area of ConceptDraw Solition Park.How to Create a Column Chart
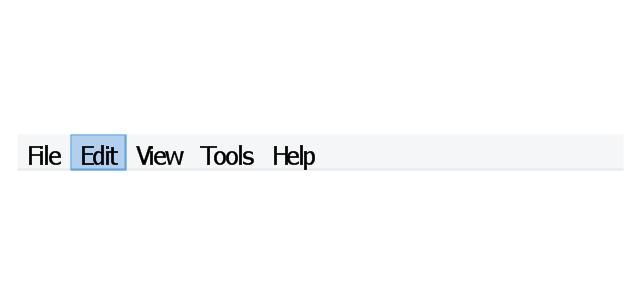
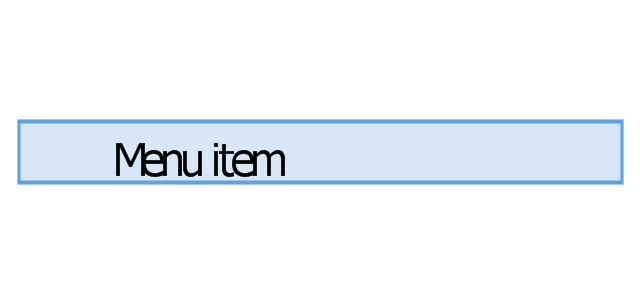
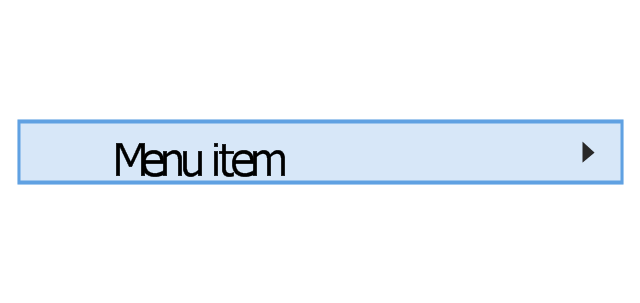
The question how to create a column chart have a simple answer. Use ConceptDraw tips to find out how to create a column chart depicts your data the best way.The vector stencils library "Menus" contains 14 icons of Windows 8 menus.
Use this menu UI icon set to design graphic user interface (GUI) prototypes of your software applications for Windows 8.
"A menu bar is a graphical control element which contains drop down menus. The menu bar's purpose is to supply a common housing for window- or application-specific menus which provide access to such functions as opening files, interacting with an application, or displaying help documentation or manuals. Menu bars are typically present in graphical user interfaces that display documents and representations of files in windows and windowing systems but menus can be used as well in command line interface programs like text editors or filemanagers where drop-down menu is activated with shortcut key or combination. ...
The menu bar in Microsoft Windows is usually anchored to the top of a window under the title bar; therefore, there can be many menu bars on screen at one time. Menus in the menu bar can be accessed through shortcuts involving the Alt key and the mnemonic letter that appears underlined in the menu title. Additionally, pressing Alt or F10 brings the focus on the first menu of the menu bar." [Menu bar. Wikipedia]
The menu elements example "Menus - Vector stencils library" was created using the ConceptDraw PRO diagramming and vector drawing software extended with the Windows 8 User Interface solution from the Software Development area of ConceptDraw Solution Park.
The vector stencils library "macOS Windows" contains 23 window elements.
Use it for user interface design of your macOS applications with ConceptDraw PRO software.
" A window provides a frame for viewing and interacting with content in an app. ...
A window consists of window-frame areas and a window body. The window-frame areas are the title bar and toolbar, which are typically combined. ...
The window body can extend from the top edge of the window (that is, underneath the combined title bar/ toolbar area) to the bottom edge of the window.
The window body represents the main content area of the window." [developer.apple.com/ library/ content/ documentation/ UserExperience/ Conceptual/ OSXHIGuidelines/ WindowAppearanceBehavior.html]
The window images example "Design elements - macOS Windows" is included in the macOS User Interface solution from the Software Development area of ConceptDraw Solution Park.
Bar Chart Software
The best bar chart software ever is ConceptDraw. ConceptDraw bar chart software provides an interactive bar charting tool and complete set of predesigned bar chart objects.Chart Templates
Easy charting software comes with beautiful chart templates and examples. This makes it easy to create professional charts without prior experience.Bar Graph
You need to draw the Bar Graph? The automated tool can be useful for you. ConceptDraw PRO diagramming and vector drawing software extended with Bar Graphs solution from Graphs and Charts area of ConceptDraw Solution Park will help you create any Bar Graph.
 iPhone User Interface
iPhone User Interface solution extends ConceptDraw PRO v10 software with templates, samples and libraries with large quantity of vector stencils of graphical user interface elements, Apps icons, UI patterns for designing and prototyping of the iOS applic
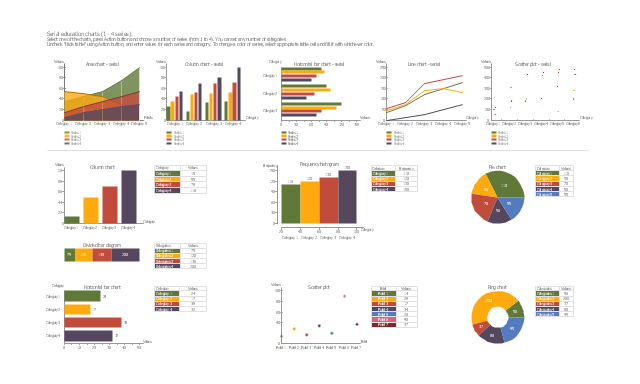
The vector stencils library "Education charts" contains 12 graphs and charts: area chart, column chart, divided bar diagram, histogram, horizontal bar graph, line graph, pie chart, ring chart, scatter plot.
Use it to create your educational infograms.
"A chart can take a large variety of forms, however there are common features that provide the chart with its ability to extract meaning from data.
Typically the data in a chart is represented graphically, since humans are generally able to infer meaning from pictures quicker than from text. Text is generally used only to annotate the data.
One of the more important uses of text in a graph is the title. A graph's title usually appears above the main graphic and provides a succinct description of what the data in the graph refers to.
Dimensions in the data are often displayed on axes. If a horizontal and a vertical axis are used, they are usually referred to as the x-axis and y-axis respectively. Each axis will have a scale, denoted by periodic graduations and usually accompanied by numerical or categorical indications. Each axis will typically also have a label displayed outside or beside it, briefly describing the dimension represented. If the scale is numerical, the label will often be suffixed with the unit of that scale in parentheses. ...
The data of a chart can appear in all manner of formats, and may include individual textual labels describing the datum associated with the indicated position in the chart. The data may appear as dots or shapes, connected or unconnected, and in any combination of colors and patterns. Inferences or points of interest can be overlaid directly on the graph to further aid information extraction.
When the data appearing in a chart contains multiple variables, the chart may include a legend (also known as a key). A legend contains a list of the variables appearing in the chart and an example of their appearance. This information allows the data from each variable to be identified in the chart." [Chart. Wikipedia]
The shapes example "Design elements - Education charts" was created using the ConceptDraw PRO diagramming and vector drawing software extended with the Education Infographics solition from the area "Business Infographics" in ConceptDraw Solution Park.
- iPhone User Interface | Health Food | USA Maps | News Title Bar Png
- Title Bar Chemistry Book Layout Png
- Scrolling Bar Vertical Png
- Title Bar Png Vector
- Check Boxes Png
- Scrollbalk Apple Png
- Png Title
- Red Line Bar Png
- Design For Title Png
- Window Scroll Png
- Scroll Bar Design Png
- Toolbar control elements - Vector stencils library | Mac OS X Lion ...
- ConceptDraw Solution Park | Black Transparent Bar Png
- Black Vertical Line Png
- Toolbar and Navigation Bar Buttons
- White Bar Png
- Scrollbar Up Down Png
- Arrow Menu Png
- Sliding Bar Png Icon
- Slider Bar Png Images


-mac-os-x-lion-user-interface---vector-stencils-library.png--diagram-flowchart-example.png)


-mac-os-x-lion-user-interface---vector-stencils-library.png--diagram-flowchart-example.png)
-mac-os-x-lion-user-interface---vector-stencils-library.png--diagram-flowchart-example.png)
-mac-os-x-lion-user-interface---vector-stencils-library.png--diagram-flowchart-example.png)
-(inactive)-mac-os-x-lion-user-interface---vector-stencils-library.png--diagram-flowchart-example.png)


-mac-os-x-lion-user-interface---vector-stencils-library.png--diagram-flowchart-example.png)
-mac-os-x-lion-user-interface---vector-stencils-library.png--diagram-flowchart-example.png)


-mac-os-x-lion-user-interface---vector-stencils-library.png--diagram-flowchart-example.png)
-mac-os-x-lion-user-interface---vector-stencils-library.png--diagram-flowchart-example.png)


