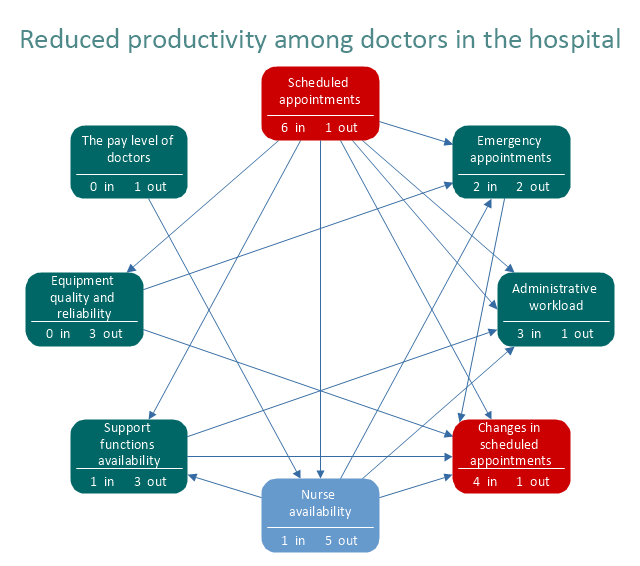
"Interrelationship Digraph (ID).
This tool displays all the interrelated cause-and-effect relationships and factors involved in a complex problem and describes desired outcomes. The process of creating an interrelationship digraph helps a group analyze the natural links between different aspects of a complex situation." [Seven Management and Planning Tools. Wikipedia]
"Causality (also referred to as causation) is the relation between an event (the cause) and a second event (the effect), where the second event is understood as a consequence of the first.
In common usage, causality is also the relation between a set of factors (causes) and a phenomenon (the effect). Anything that affects an effect is a factor of that effect. A direct factor is a factor that affects an effect directly, that is, without any intervening factors. (Intervening factors are sometimes called "intermediate factors".) The connection between a cause(s) and an effect in this way can also be referred to as a causal nexus.
Though the causes and effects are typically related to changes or events, candidates include objects, processes, properties, variables, facts, and states of affairs; characterizing the causal relation can be the subject of much debate." [Causality. Wikipedia]
The relations diagram example "Health care" was created using the ConceptDraw PRO diagramming and vector drawing software extended with the solution "Seven Management and Planning Tools" from the Management area of ConceptDraw Solution Park.
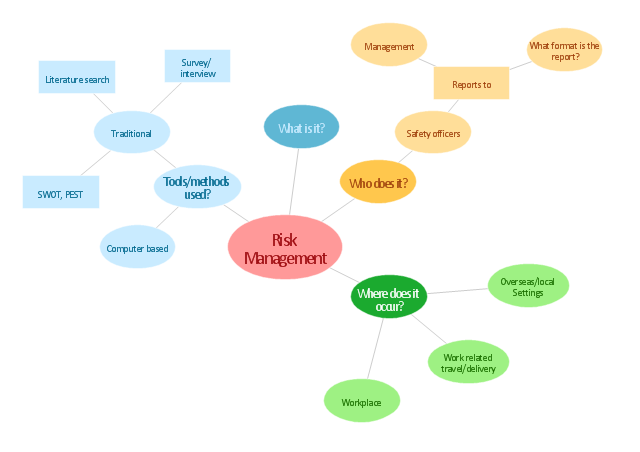
"Risk management is the identification, assessment, and prioritization of risks (defined in ISO 31000 as the effect of uncertainty on objectives, whether positive or negative) followed by coordinated and economical application of resources to minimize, monitor, and control the probability and/ or impact of unfortunate events or to maximize the realization of opportunities. Risks can come from uncertainty in financial markets, threats from project failures (at any phase in design, development, production, or sustainment life-cycles), legal liabilities, credit risk, accidents, natural causes and disasters as well as deliberate attack from an adversary, or events of uncertain or unpredictable root-cause. ... Methods, definitions and goals vary widely according to whether the risk management method is in the context of project management, security, engineering, industrial processes, financial portfolios, actuarial assessments, or public health and safety.
The strategies to manage threats (uncertainties with negative consequences) typically include transferring the threat to another party, avoiding the threat, reducing the negative effect or probability of the threat, or even accepting some or all of the potential or actual consequences of a particular threat, and the opposites for opportunities (uncertain future states with benefits)." [Risk management. Wikipedia]
The concept map example "Risk management" was created using the ConceptDraw PRO diagramming and vector drawing software extended with the Concept Maps solution from the area "What is a Diagram" of ConceptDraw Solution Park.
- PROBLEM ANALYSIS. Root Cause Analysis Tree Diagram | Root ...
- Root cause analysis tree diagram - Template | Fault Tree Analysis ...
- Cause and Effect Analysis (Fishbone Diagrams ) | Cause and Effect ...
- Cause and Effect Analysis (Fishbone Diagrams ) | Problem solving ...
- Problem solving | Cause and Effect Analysis (Fishbone Diagrams ...
- Tree Diagram Example Of Problem With Cause And Consequences
- Cause and Effect Analysis | Fishbone Diagram Software for Design ...
- Sample Of Cause And Effect Of A Problem Using Tree Diagram
- Root Cause Analysis Mac
- Cause And Effect Diagram Examples In Healthcare
- Cause and Effect Analysis (Fishbone Diagrams ) | Business ...
- Using Fishbone Diagrams for Problem Solving | Cause and Effect ...
- Fishbone Diagram | Cause and Effect Analysis (Fishbone Diagrams ...
- Design elements - Cause -and- effect diagram | Ishikawa fishbone ...
- Fishbone Diagram | How To Create a MS Visio Cause and Effect ...
- Fishbone Diagram | Business Productivity Diagramming | Cause ...
- Cause and Effect Analysis (Fishbone Diagrams ) | Fishbone Diagram ...
- Cause And Effect Diagram Execution
- Fishbone Diagram | Fishbone Diagrams | Cause and Effect Analysis ...
- Business Productivity Diagramming | Fishbone Diagram | Cause ...

