HelpDesk
How to Change Measurement Units in ConceptDraw Drawing
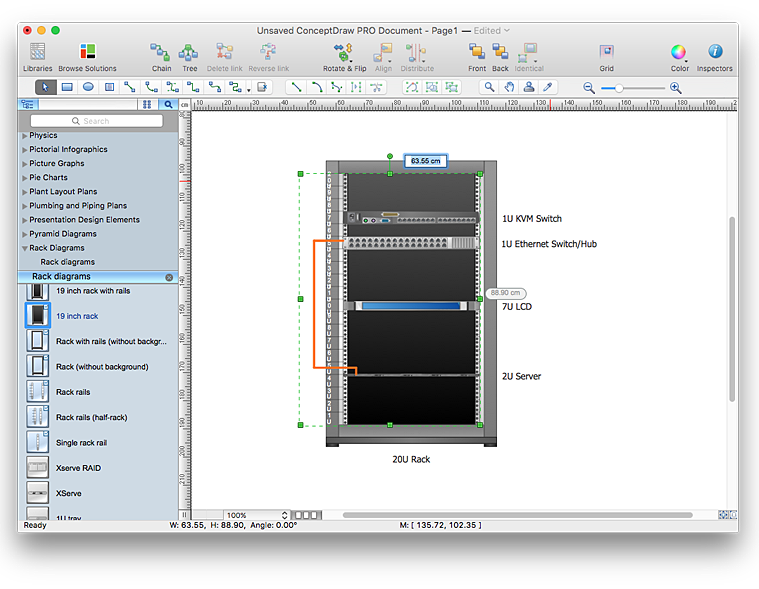
ConceptDraw PRO allows you to work with drawings with many different measurement units.HelpDesk
How to Create a Floor Plan Using ConceptDraw PRO
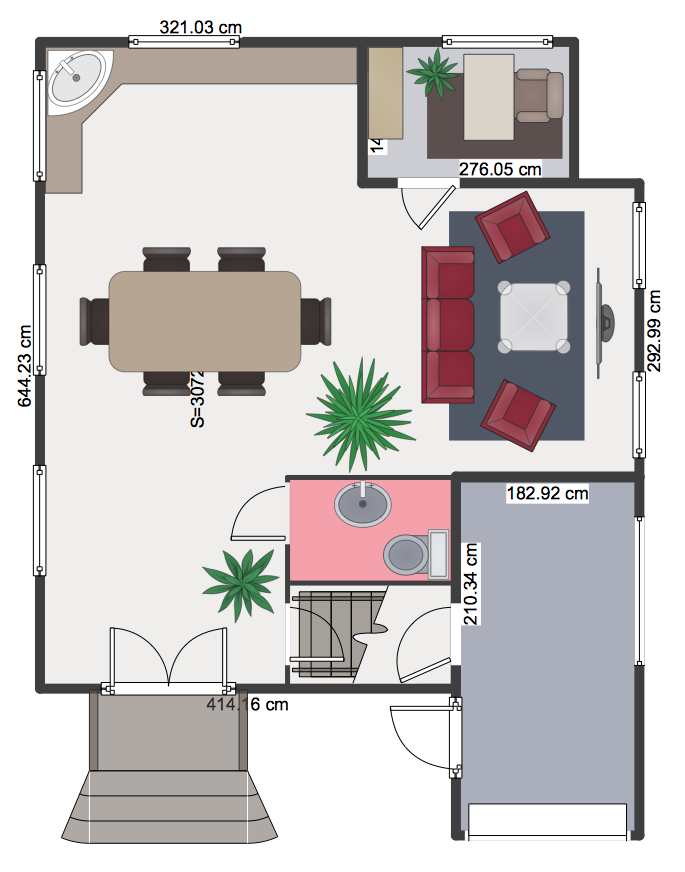
Making a floor plan is the best way to get a handle on how to organize your living space, and find out what could be changed. Creating a floor plan to scale is a challenge of the home and interior design process and can be noticeably helpful for visualizing things like furniture layout. You can use ConceptDraw PRO to produce layouts of real estate properties. ConceptDraw PRO contains the large quantity of pre-designed vector objects that you can use for quick and easy designing such floor plans. You can easily determine the size of the rooms and distances in you drawing. The ability to create a floor plan is delivered by the Floor Plans solution. This solution extends ConceptDraw PRO with libraries that contains over 500 objects of floor plan elements. There is a set of special objects that displays the sizes, corners, squares and other technical details using the current measurements of units.HelpDesk
How to Resize Objects in ConceptDraw PRO
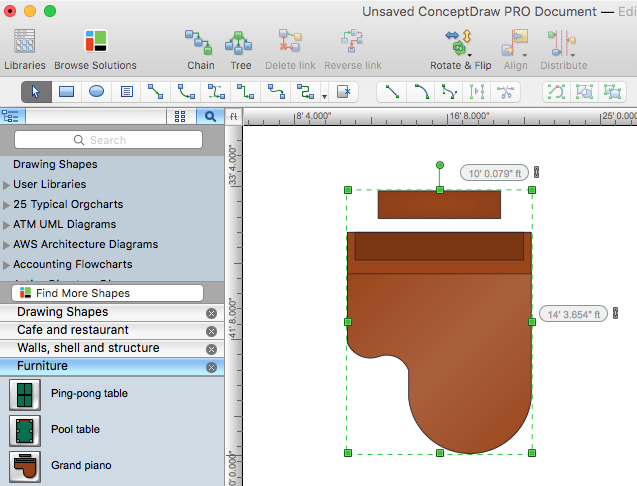
When creating diagram using ConceptDraw PRO, you can select, move, resize and rotate objects. After selecting an object (or objects) in a document, you can change it position, resize it or move an object to the desired position. The sizes of objects in ConceptDraw PRO can be changed by simple dragging, or you can set a particular size of any object. Using ConceptDraw PRO, you can re-size an object on the page using the absolute measurements instead of a mouse. You can make quick work of designing complex drawing using a combination of different-sized items.HelpDesk
How to Change the Timescale in a Gantt Chart View
Most views in ConceptDraw PLAN have a timescale that shows the units of project time measurement (hour, day, week, etc.) used to schedule project tasks. You can change the timescale to view smaller or bigger time units, from hours all the way up to years. For example, you may want to show time in quarterы of the yearб or you may want to show Gantt chart across months and days.HelpDesk
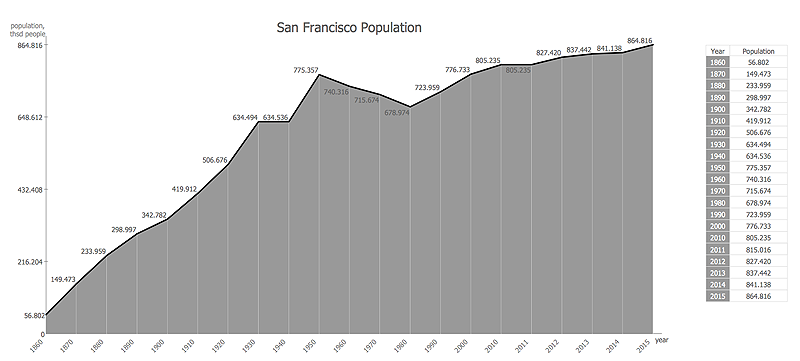
How to Draw an Area Chart in ConceptDraw PRO
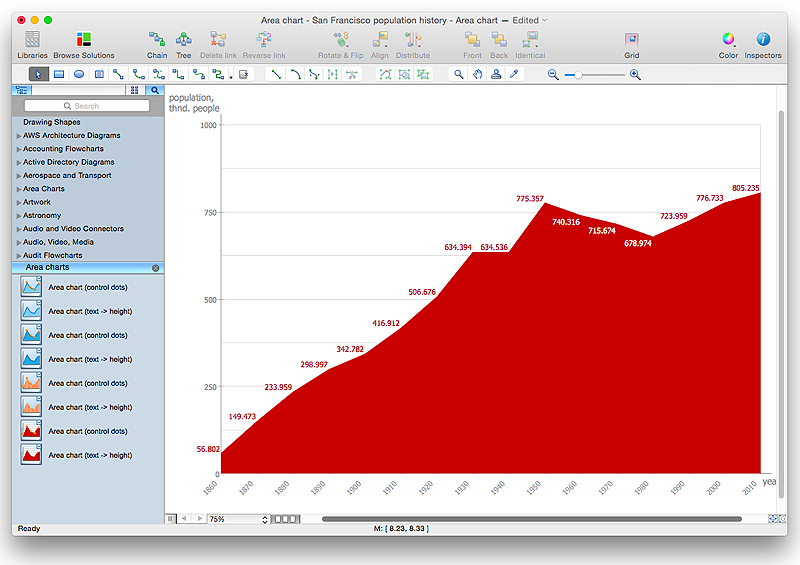
Area chart is similar to a line chart, but an area chart has an area, commonly filled with color below the line. The applying of Line charts and area charts are also very similar. They both show continuity across a data set. They are both can be used for displaying time series data and for depicting tendencies better than separate values, but they have some different characteristics. Using the proper one is good chance to show once again a professionalism of your graphic documents. An area chart depicts a colored area below the line. The sum on the vertical axis of an area chart represents the entire value, while the height of each separate piece shows its parts. Area charts are used to display multiple data series with proportion to a whole value , or for separate data series showing a set of countable values, or cumulative data.HelpDesk
How to Create a Timeline Diagram in ConceptDraw PRO
A Timeline is a chart which displays a project plan schedule in chronological order. A Timeline is used in project management to depict project milestones and visualize project phases, and show project progress. The graphic form of a timeline makes it easy to understand critical project milestones, such as the progress of a project schedule. Timelines are particularly useful for project scheduling or project management when accompanied with a Gantt chart. It captures the main of what the project will accomplish and how it will be done. making a project timeline is one of the most important skills a project manager needs have. Making comprehensive, accurate timelines allows you getting every project off in the best way. ConceptDraw PRO allows you to draw a timeline charts using special library.HelpDesk
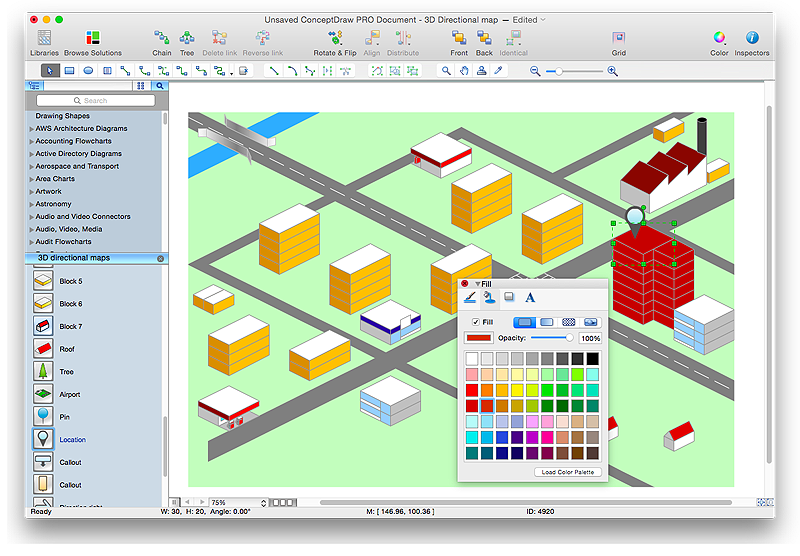
How to Create a Directional Map Using ConceptDraw PRO
Travelers often use directional maps to find directions for certain places. These maps are guide millions of tourists to explore towns and cities worldwide. Searching addresses on a map, view nearby businesses, get driving directions - this is only a little of what directional maps is needed. ConceptDraw PRO allows you to create various kinds of directional maps. You can easily visualize city maps or destinations with driving directions and traveler information using special vector stencils libraries.HelpDesk
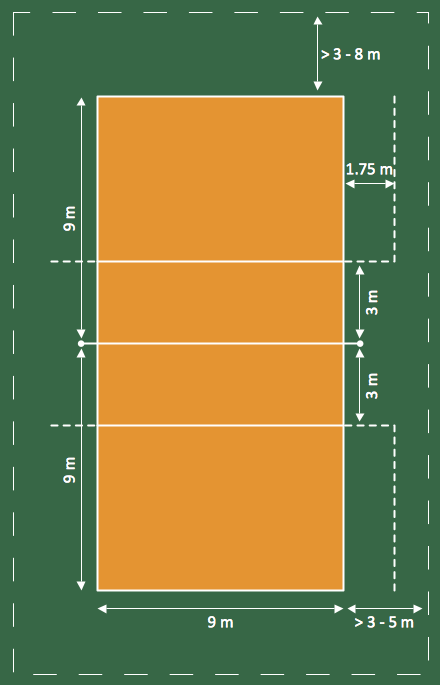
How to Create a Sport Field Plan Using ConceptDraw PRO
Sport fields and playgrounds fields are one of the most important resources for sport. They form the valuable area necessary to deliver possibilities for citizens to enjoy sports, games and other physical activities. Well planned fields for sport, playing and recreation help to maintain active and healthy society in urban and rural areas. ConceptDraw Sport Field Plans solution is time saving and handy professional tool. It provides the set of vector graphic objects that can be used for depicting of any of sport field or playground: football, basketball, volleyball, golf, etc. You can also add elements of the fields entourage: water pools, plants, parking and other objects.HelpDesk
How to Create a Basic Diagram with ConceptDraw PRO
Creation of graphs or charts is a most used way of presenting information and data. The Basic Charts solution for ConceptDraw PRO is designed to assist you in drawing the most widely used kinds of charts. This solution provides a library of vector objects, comprised from such common diagrams as Line Chart, Area Chart, Histogram, Scatter Diagram, Pie Chart, Donut Chart, Column Chart, Horizontal Bar Chart. It also offer a set of typical examples of each of these charts.- How to Create a Floor Plan Using ConceptDraw PRO | Planets to ...
- Concept Draw Measure To Scale
- How to Create a Floor Plan Using ConceptDraw PRO | How to ...
- DroidDia PRO unlocker | Pyramid Diagram | How to Change ...
- How to Resize Objects in ConceptDraw PRO | How to Start Drawing ...
- How to Create a Floor Plan Using ConceptDraw PRO | How to ...
- How to Draw an Area Chart in ConceptDraw PRO | How to Create a ...
- How to Create a Floor Plan Using ConceptDraw PRO | How To ...
- Landscape Architecture with ConceptDraw PRO | How To use ...
