Pyramid Diagram
Those triangles within any technical analysis are known to be the chart patterns that can be commonly found in the price charts of the financially traded assets, such as stocks, futures, bonds, etc. The pattern is known to be deriving its name from the fact that it is characterized by some contraction in a price range being the converged trend lines, giving it a triangular shape.Pyramid Diagram
The Project Management Triangle Diagram depicts three main constraints of any project: scope, time and cost. Projects have to comply with the specified scope, projects should be finished in time and projects need to consume the budget. Each of the constraints represents one side of the triangle, and any change in budget or timing or scope affects the entire diagram.Pyramid Diagram
The Time-Money-Quality Triangle illustrates an advertising truism, that you can't have all three.
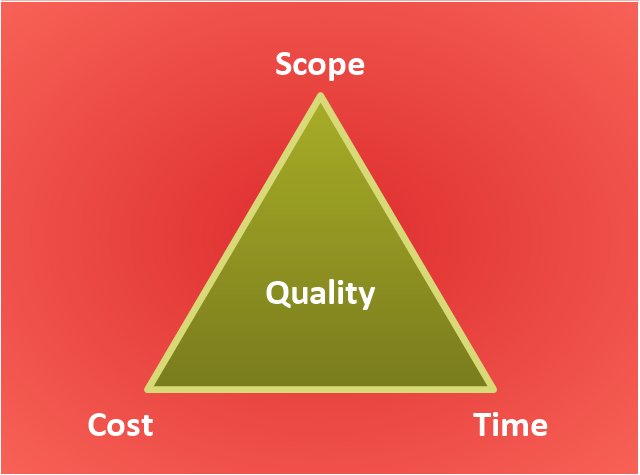
"The Project Management Triangle (called also Triple Constraint or the Iron Triangle) is a model of the constraints of project management. It is a graphic aid where the three attributes show on the corners of the triangle to show opposition. It is useful to help with intentionally choosing project biases, or analyzing the goals of a project. It is used to illustrate that project management success is measured by the project team's ability to manage the project, so that the expected results are produced while managing time and cost." [Project management triangle. Wikipedia]
The pyramid chart example "Project management triangle diagram" was redesigned using the ConceptDraw PRO diagramming and vector drawing software from Wikimedia Commons file Project-triangle-en.svg. [commons.wikimedia.org/ wiki/ File:Project-triangle-en.svg]
The project management triangle chart example is included in the Pyramid Diagrams solution from the Marketing area of ConceptDraw Solution Park.
Pyramid Diagram
Zooko's triangle is known to be a trilemma which is a concept in international economics which states that it is impossible to have a fixed foreign exchange rate, a free capital movement and an independent monetary policy at the same time.Pyramid Diagram
ConceptDraw Pyramid Diagram software allows drawing column charts using predesigned objects or drawing tools.Pyramid Diagram
Triangle diagram example of DIKW pyramid has 4 levels: data, information, knowledge and wisdom.Pyramid Diagram
At the base of the identity of an organisational is its organizational culture.Pyramid Diagram
Pyramid diagrams help you visualize information as a triangle divided into horizontal slices. Labelled slices represent a hierarchy. Pyramids are used in marketing presentations to show and analyze hierarchy levels.3D triangular diagram of DIKW pyramid has 6 levels: measurement, facts, data, information, knowledge, wisdom.
The data component include different scattered signs or symbols which are merely useless until these random objective facts are somehow processed. Data is a resource which has to be manipulated or rearranged to get useful. Information can be extracted from a pile of data, it also can be mined from different data storages.
Fundraising Pyramid
ConceptDraw Pyramid Diagram software allows drawing column charts using predesigned objects or drawing tool.Pyramid Charts
ConceptDraw DIAGRAM extended with Pyramid Diagrams Solution from the Marketing Area of ConceptDraw Solution Park is a powerful Pyramid Charts making software.A Pyramid Chart has the form of triangle and hierarchically structures, organizes and help to analyze the information, data or ideas. Triangle is divided on the sections that usually have different widths. The width indicates the level of hierarchy among the topics.
Pyramid Diagram
The purchase or purchasing funnel is a consumer focused marketing model which illustrates the theoretical customer journey towards the purchase of a product or service.Pyramid Diagram
A four level pyramid model of different types of Information Systems based on the different levels of hierarchy in an organization.Pyramid Diagram
Pyramid chart example is included in the Pyramid Diagrams solution from Marketing area of ConceptDraw Solution Park.Pyramid Diagram
A triangular graphic representing Graham's "hierarchy of disagreement", based on Paul Graham's March 2008 essay "How to Disagree".- Pyramid Diagram | Project triangle chart | Pyramid Charts | Building ...
- Pyramid Diagram | Project triangle chart | Triangular chart ...
- Triangle Chart
- Pyramid Diagram | Project triangle chart | Triangle chart - Template ...
- Chart Of Triangles With Diagram
- Triangle Venn Diagram Template
- Times Pyramid Chart Triangle
- Charts Related To Service Triangle
- Pyramid Diagram | Pyramid Diagram | Project management triangle ...
- Diagram Of Service Triangle
- Project management triangle diagram | Bar Diagrams for Problem ...
- Service Triangle Diagram
- Inverted Triangle Chart
- Organizational culture - Triangle diagram | Pyramid Diagram ...
- Pyramid Diagram | Pyramid Diagram | Marketing Charts | Marketing ...
- 3d Triangle Chart
- Pyramid Diagram | Pyramid Chart Examples | Pyramid Diagram ...
- Pyramid Diagram | Pyramid Charts | Pyramid Diagram | Triangle ...
- Triangle Graph Template
- ERD | Entity Relationship Diagrams, ERD Software for Mac and Win
- Flowchart | Basic Flowchart Symbols and Meaning
- Flowchart | Flowchart Design - Symbols, Shapes, Stencils and Icons
- Flowchart | Flow Chart Symbols
- Electrical | Electrical Drawing - Wiring and Circuits Schematics
- Flowchart | Common Flowchart Symbols