Business diagrams & Org Charts with ConceptDraw DIAGRAM
The business diagrams are in great demand, they describe the business processes, business tasks and activities which are executed to achieve specific organizational and business goals, increase productivity, reduce costs and errors. They let research and better understand the business processes. ConceptDraw DIAGRAM is a powerful professional cross-platform business graphics and business flowcharting tool which contains hundreds of built-in collections of task-specific vector stencils and templates. They will help you to visualize and structure information, create various Business flowcharts, maps and diagrams with minimal efforts, and add them to your documents and presentations to make them successful. Among them are Data flow diagrams, Organization charts, Business process workflow diagrams, Audit flowcharts, Cause and Effect diagrams, IDEF business process diagrams, Cross-functional flowcharts, PERT charts, Timeline diagrams, Calendars, Marketing diagrams, Pyramids, Target diagrams, Venn diagrams, Comparison charts, Analysis charts, Dashboards, and many more. Being a cross-platform application, ConceptDraw DIAGRAM is very secure, handy, free of bloatware and one of the best alternatives to Visio for Mac users.
HelpDesk
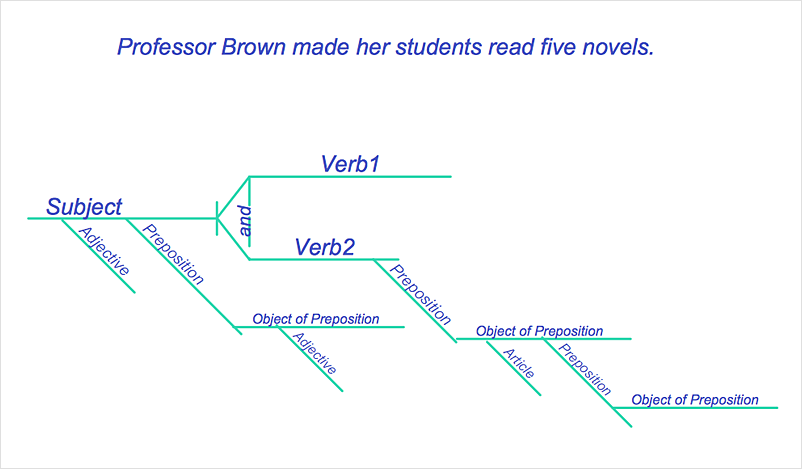
How to Diagram Sentences
Diagramming sentences is a playful, fun way to learning English Grammer. Sentences can be very complex, and can contain many different parts of speech which implicate many different grammatical rules. Diagramming sentences will help you to make sure every parts of your sentence are grammatically correct, and provides you with more comprehensive understanding of the English Language. A Sentence Diagram displays the parts of a sentence as a diagram in order to show the relationship of words and groups of words within the sentence. Sentence Diagram shows the relationship between the proposal of its parts. This is a good way to teach grammar! Sentence Diagram helps to make the writing more coherent as well as more interesting to read. ConceptDraw DIAGRAM allows you to create clear sentence diagrams using the special templates and vector stencils library.HelpDesk
How to Draw a Circular Arrows Diagram
The cyclic recurrence is a fundamental property of multiple systems. The cycle is a process which consists from elements (phases, stages, stages) following each other. Many processes in astronomy, biology, chemistry, physics, mathematics, etc. have a cycle properties. It is also widely used in information technologies and marketing analysis. Graphical representation of cyclic processes can have many forms. It can be a circle, parabola, hyperbola, ellipse and others. A Circular Arrows Diagram is used as one of the statistical charts in the business, mass media and marketing. ConceptDraw DIAGRAM provides its users tools for making easy drawing Circular Arrows Diagrams.- Marketing Chart And Diagrams
- Marketing Diagrams | Marketing Charts | Marketing Organization ...
- Business diagrams & Org Charts with ConceptDraw PRO
- Management Information System Charts And Diagrams
- Marketing Diagrams | Flowchart Marketing Process. Flowchart ...
- Flow chart Example. Warehouse Flowchart | Workflow Diagrams ...
- Business Diagram Software | Organization Chart Software | Basic ...
- Bubble diagrams with ConceptDraw PRO | Bubble Charts | Bubble ...
- Marketing Diagrams | Marketing Analysis Diagram | Marketing ...
- Bubble diagrams in Landscape Design with ConceptDraw PRO ...
- Pie Chart Examples and Templates | Process Flowchart | Lean Six ...
- How to Draw a Bubble Chart | How to Create a Bubble Diagram ...
- Examples of Flowcharts, Org Charts and More | Business Report Pie ...
- Bar Diagrams for Problem Solving. Create manufacturing and ...
- Bar Chart Examples | Bar Diagrams for Problem Solving. Create ...
- Quality Control Chart Software — ISO Flowcharting | Design ...
- Process Flowchart | Business diagrams & Org Charts with ...
- Divided bar diagram - Template | Chart Software for Better ...
- How to Add a Bubble Diagram to a PowerPoint Presentation Using ...
- Marketing | Six Markets Model Chart Template | Marketing Charts ...


