Pie Chart Word Template. Pie Chart Examples
The Pie Chart visualizes the data as the proportional parts of a whole and looks like a disk divided into sectors. The pie chart is type of graph, pie chart looks as circle devided into sectors. Pie Charts are widely used in the business, statistics, analytics, mass media. It’s very effective way of displaying relative sizes of parts, the proportion of the whole thing.Line Chart Template for Word
This sample was created in ConceptDraw DIAGRAM diagramming and vector drawing software using the Line Graphs Solution from Graphs and Charts area of ConceptDraw Solution Park. This sample shows the Line Chart of annual percentage change. The Line Chart allows you to clearly see the changes of data over the time.Spider Chart Template
This sample shows the Spider Chart that represents the budget and spending for one organization and allows to compare them. The multivariate data are represented on the Spider Chart as a two-dimensional chart with four or more variables displayed on the axes that start in one point. The Spider Charts are used in the management, business and sport.Donut Chart Templates
These donut chart templates was designed using ConceptDraw DIAGRAM diagramming and vector drawing software extended with Pie Charts solution from Graphs and Charts area of ConceptDraw Solution Park. All these donut chart templates are included in the Pie Charts solution. You can quickly rework these examples into your own charts by simply changing displayed data, title and legend texts.Chart Templates
Easy charting software comes with beautiful chart templates and examples. This makes it easy to create professional charts without prior experience.Pie Chart Examples and Templates
A pie chart or a circle graph is a circular chart divided into sectors, illustrating numerical proportion. In a pie chart, the arc length of each sector and consequently its central angle and area, is proportional to the quantity it represents. Pie chart examples and templates created using ConceptDraw DIAGRAM software helps you get closer with pie charts and find pie chart examples suite your needs.Bar Chart Template for Word
All these bar chart templates are included in the Bar Graphs solution. You can quickly rework these bar graph templates into your own charts by simply changing displayed data, title and legend texts.Organization Chart Templates
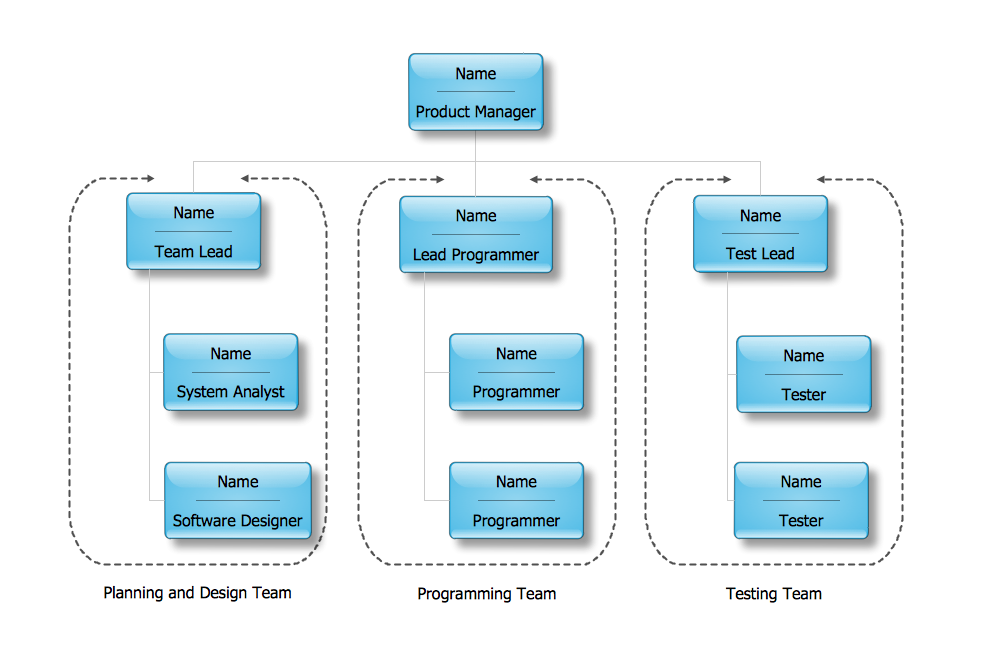
Organization Chart Templates - Organizational Charts Solution from the Management Area of ConceptDraw Solution Park provides a wide collection of predesigned templates and samples that will help you create the Organizational Charts of any complexity in one moment.Line Chart Templates
The Line Graphs solution from Graphs and Charts area of ConceptDraw Solution Park contains a set of examples, templates and design elements library of line and scatter charts. Use it to draw line and scatter graphs using ConceptDraw DIAGRAM diagramming and vector drawing software for illustrating your documents, presentations and websites.Venn Diagram Template for Word
This template shows the Venn Diagram. It was created in ConceptDraw DIAGRAM diagramming and vector drawing software using the ready-to-use objects from the Venn Diagrams Solution from the "Diagrams" area of ConceptDraw Solution Park.Organizational Chart Templates
ConceptDraw offers you a number of ready-made organizational chart templates which you can use in your drawing. They are grouped in topical sets as organizational chart template files. Use the Organizational Charts Solution for ConceptDraw DIAGRAM to create your own Organizational Charts of any complexity quick, easy and effective. The Organizational Charts designed with ConceptDraw DIAGRAM are vector graphic documents and are available for reviewing, modifying, converting to a variety of formats (image, HTML, PDF file, MS PowerPoint Presentation, Adobe Flash or MS Visio XML), printing and send via e-mail in one moment.
Flowchart Components
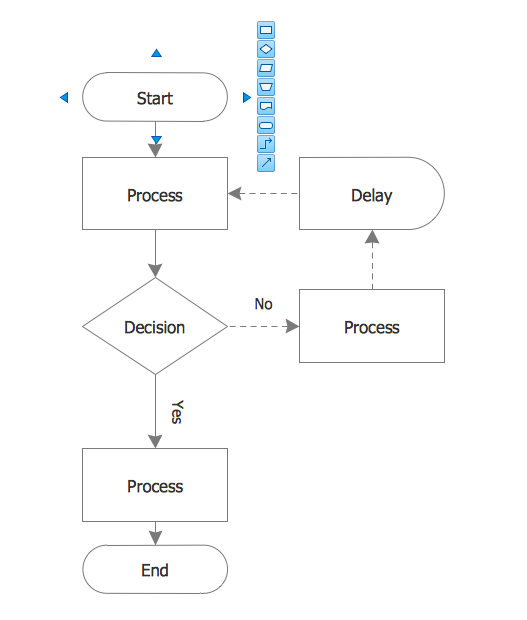
The ConceptDraw Flowchart component includes a set of samples and templates. This geathered as flowchart maker toolbox which focused on drawing flowcharts of any industry standards.Chart Maker for Presentations
Easy charting software comes with beautiful chart templates and examples. This makes it easy to create professional charts without prior experience.Circular Flow Diagram Template
You need to draw the Circular Arrows Diagram, Segmented Diagram or Circular Flow Diagram? Any of these diagrams can be fast and easy designed in ConceptDraw DIAGRAM.ConceptDraw DIAGRAM diagramming and vector drawing software offers the Circular Arrows Diagrams Solution from the "Diagrams" Area with extensive drawing tools, predesigned samples and circular flow diagram template. Use of ready template is the easiest way of drawing.Six Markets Model Chart Template
This template shows the Six Markets Model Chart and was included in Marketing Diagrams Solution. It is available from ConceptDraw STORE and can be used as the base for creating your own marketing diagrams.Create Graphs and Charts
Charting Software allows you to create diagrams, charts, graphs, flowcharts, and other business graphics. ConceptDraw DIAGRAM include simple shape drawing tools, examples, templates, and symbol libraries.Organizational Chart Template
Organizational Charts help to show the relationships of positions within an organization in terms of authority and responsibility. They typically give an actual and clear “snapshot” picture of an organization for both employees and individuals outside, they visually show divisions of work, levels of management, and reporting relationships. ConceptDraw DIAGRAM graphical software supplied with Organizational Charts Solution from the Management Area of ConceptDraw Solution Park offers a number of ready-made organizational chart samples, examples and templates, which you can use as a foundation in your drawing. All they are grouped in topical sets as organizational chart template files and allow easily depict a wide array of organizational structure types, and to represent any business organizational structure, matrix organization structure, or functional structure. Inside the Organizational Charts solution you will find also a set of vector shape libraries containing a lot of icons needed for effective illustration the Organizational Structure Charts of any complexity.Gantt Chart Templates
Gantt Chart Templates - PM Easy Solution from the Project Management Area extends ConceptDraw PROJECT with the ability to quickly start a project. It lists task dependencies and relationships making the terative planning easy. ConceptDraw PROJECT lets you the useful possibility to create visual project dashboards and diagrams, generate various kinds of reports with one click. It provides also extensive capabilities of importing and exporting in various formats: Microsoft Project, ConceptDraw MINDMAP , Mindjet MindManager, PDF file.Flow Chart Template
Templates are very useful and convenient tool for fast and easy drawing various diagrams, charts, and also flowcharts. It is the excellent news that ConceptDraw DIAGRAM diagramming and vector drawing software extended with Flowcharts Solution from the "Diagrams" Area offers wide collection of various predesigned flowchart samples and flow chart template.Circle Spoke Diagram Template
ConceptDraw DIAGRAM diagramming and vector drawing software offers the Circle Spoke Diagram Template included in the Circle-Spoke Diagrams Solution from the "Diagrams" Area. Use of ready template is the easiest way of drawing professional looking Circle-Spoke Diagrams.- Target Market Chart Template
- Cross-Functional Process Map Template | Cross-Functional ...
- Percentage Pie Chart . Pie Chart Examples | Sector diagram ...
- Business Report Pie. Pie Chart Examples | Example of ...
- Best Value — Total Quality Management | Pie Chart Examples and ...
- Pie Chart Examples and Templates | Swim Lanes | Examples of ...
- Organizational Chart Templates | Bar Chart Template for Word | Pie ...
- Pie Chart Software | Doughnut chart - Template | Donut Chart ...
- Visio Donut Chart
- Catering Organizational Chart Template
- Linear Responsibility Chart Template
- Organization Chart Templates | How To Create an Affinity Diagram ...
- Basic Pie Charts | Flowchart Components | Column Chart Template ...
- Chart Templates | Sales Growth. Bar Graphs Example | Pictures of ...
- Swim Lane Diagrams | Software Diagram Templates | Types of ...
- Schedule pie chart - Daily action plan | Chart Maker for ...
- Percentage Pie Chart . Pie Chart Examples | Atmosphere air ...
- Seating Chart Template Free
- Chart Template
- Chart Maker for Presentations | Pie Chart Examples and Templates ...


