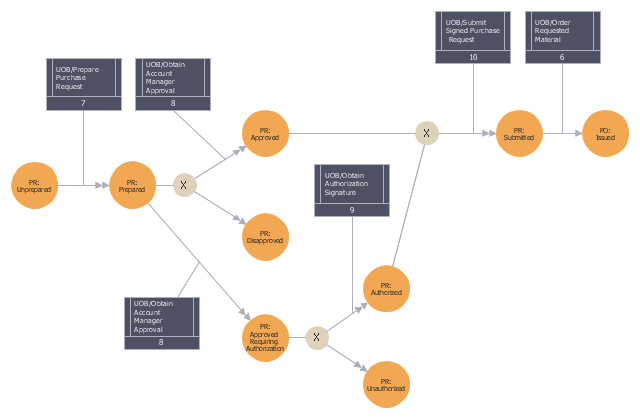
This IDEF3 diagram example was redesigned from the Wikimedia Commons file: 5-21 Completed Transition Schematic.jpg.
[commons.wikimedia.org/ wiki/ File:5-21_ Completed_ Transition_ Schematic.jpg]
"As with the Process Schematic, the correctness of the Object Schematic and
associated elaborations are confirmed through validation with the domain expert. After reviewing the Transition Schematic, the domain expert observes that the allowable state transitions displayed in the schematic do not include those representative of a failed request. ...
The domain expert also identified transitions through which the identity of the object was preserved and transitions where the object was actually transformed into an entirely different object. The domain expert’s comments to the analyst yield the schematic
depicted in Figure 5-21." [IDEF3 Process Description Capture Method Report AL-TR-1995-XXXX. idef.com/ pdf/ Idef3_ fn.pdf]
The sample "Completed transition schematic - IDEF3 diagram" was created using the ConceptDraw PRO diagramming and vector drawing software extended with the solution "IDEF Business Process Diagrams" from the area "Business Processes" of ConceptDraw Solution Park.
IDEF3 business process diagram
HelpDesk
What Information to be Displayed in the ConceptDraw PROJECT Gantt Chart View


This is a schematic process flow diagram of the processes used in a typical oil refinery.
This process flow diagram (PFD) example was redesigned from the Wikimedia Commons file: RefineryFlow.png. [commons.wikimedia.org/ wiki/ File:RefineryFlow.png]
This file is licensed under the Creative Commons Attribution-Share Alike 3.0 Unported license. [creativecommons.org/ licenses/ by-sa/ 3.0/ deed.en]
"An oil refinery or petroleum refinery is an industrial process plant where crude oil is processed and refined into more useful products such as petroleum naphtha, gasoline, diesel fuel, asphalt base, heating oil, kerosene and liquefied petroleum gas. Oil refineries are typically large, sprawling industrial complexes with extensive piping running throughout, carrying streams of fluids between large chemical processing units. In many ways, oil refineries use much of the technology of, and can be thought of, as types of chemical plants. The crude oil feedstock has typically been processed by an oil production plant. There is usually an oil depot (tank farm) at or near an oil refinery for the storage of incoming crude oil feedstock as well as bulk liquid products.
An oil refinery is considered an essential part of the downstream side of the petroleum industry." [Oil refinery. Wikipedia]
The PFD example "Process flow diagram - Typical oil refinery" was created using the ConceptDraw PRO diagramming and vector drawing software extended with the Chemical and Process Engineering solution from the Chemical and Process Engineering area of ConceptDraw Solution Park.
Process Flow Diagram (PFD)
-process-flow-diagram---typical-oil-refinery.png--diagram-flowchart-example.png)
HelpDesk
How to Draw a Gantt Chart Using ConceptDraw PRO

HelpDesk
How to Purchase and Install ConceptDraw Solution Pack

Product Overview

HelpDesk
How to Set a Project Baseline Using ConceptDraw PROJECT

- Project Completed Icon Png
- Process Flowchart | Projects Completed Symbol Png
- Project Manager Gantt Png
- Project Information Icon Png
- Program Management Vectors Png
- Analyst Vector Png
- Timetable Vector Png
- Project Png Vector
- Punched Tape Icon Png
- Incoming Or Outgoing Circle Arrow Png
- Portfolio Icon Png
- Dining Tablewith Cloth Top View Png
- Timetable Icon Png
- Basketball Outline Png
- Task Timer Icon Png White
- Start Png Vector
- Coffee Draw Png
- Travels Background Png
- Ellipse Vector Png
- Checklist Png