- Electric and Telecom Plans Free
- Fire and Emergency Plans Free
- Floor Plans Free
- Plant Layout Plans Free
- School and Training Plans Free
- Seating Plans Free
- Security and Access Plans Free
- Site Plans Free
- Sport Field Plans Free
- Business Process Diagrams Free
- Business Process Mapping Free
- Classic Business Process Modeling Free
- Cross-Functional Flowcharts Free
- Event-driven Process Chain Diagrams Free
- IDEF Business Process Diagrams Free
- Logistics Flow Charts Free
- Workflow Diagrams Free
- ConceptDraw Dashboard for Facebook Free
- Mind Map Exchange Free
- MindTweet Free
- Note Exchange Free
- Project Exchange Free
- Social Media Response Free
- Active Directory Diagrams Free
- AWS Architecture Diagrams Free
- Azure Architecture Free
- Cisco Network Diagrams Free
- Cisco Networking Free
- Cloud Computing Diagrams Free
- Computer Network Diagrams Free
- Google Cloud Platform Free
- Interactive Voice Response Diagrams Free
- Network Layout Floor Plans Free
- Network Security Diagrams Free
- Rack Diagrams Free
- Telecommunication Network Diagrams Free
- Vehicular Networking Free
- Wireless Networks Free
- Comparison Dashboard Free
- Composition Dashboard Free
- Correlation Dashboard Free
- Frequency Distribution Dashboard Free
- Meter Dashboard Free
- Spatial Dashboard Free
- Status Dashboard Free
- Time Series Dashboard Free
- Basic Circle-Spoke Diagrams Free
- Basic Circular Arrows Diagrams Free
- Basic Venn Diagrams Free
- Block Diagrams Free
- Concept Maps Free
- Family Tree Free
- Flowcharts Free
- Basic Area Charts Free
- Basic Bar Graphs Free
- Basic Divided Bar Diagrams Free
- Basic Histograms Free
- Basic Line Graphs Free
- Basic Picture Graphs Free
- Basic Pie Charts Free
- Basic Scatter Diagrams Free
- Aerospace and Transport Free
- Artwork Free
- Audio, Video, Media Free
- Business and Finance Free
- Computers and Communications Free
- Holiday Free
- Manufacturing and Maintenance Free
- Nature Free
- People Free
- Presentation Clipart Free
- Safety and Security Free
- Analog Electronics Free
- Audio and Video Connectors Free
- Basic Circuit Diagrams Free
- Chemical and Process Engineering Free
- Digital Electronics Free
- Electrical Engineering Free
- Electron Tube Circuits Free
- Electronic Block Diagrams Free
- Fault Tree Analysis Diagrams Free
- GHS Hazard Pictograms Free
- Home Automation and Wiring Free
- Mechanical Engineering Free
- One-line Diagrams Free
- Power Сircuits Free
- Specification and Description Language (SDL) Free
- Telecom and AV Circuits Free
- Transport Hazard Pictograms Free
- Data-driven Infographics Free
- Pictorial Infographics Free
- Spatial Infographics Free
- Typography Infographics Free
- Calendars Free
- Decision Making Free
- Enterprise Architecture Diagrams Free
- Fishbone Diagrams Free
- Organizational Charts Free
- Plan-Do-Check-Act (PDCA) Free
- Seven Management and Planning Tools Free
- SWOT and TOWS Matrix Diagrams Free
- Timeline Diagrams Free
- Australia Map Free
- Continent Maps Free
- Directional Maps Free
- Germany Map Free
- Metro Map Free
- UK Map Free
- USA Maps Free
- Customer Journey Mapping Free
- Marketing Diagrams Free
- Matrices Free
- Pyramid Diagrams Free
- Sales Dashboard Free
- Sales Flowcharts Free
- Target and Circular Diagrams Free
- Cash Flow Reports Free
- Current Activities Reports Free
- Custom Excel Report Free
- Knowledge Reports Free
- MINDMAP Reports Free
- Overview Reports Free
- PM Agile Free
- PM Dashboards Free
- PM Docs Free
- PM Easy Free
- PM Meetings Free
- PM Planning Free
- PM Presentations Free
- PM Response Free
- Resource Usage Reports Free
- Visual Reports Free
- House of Quality Free
- Quality Mind Map Free
- Total Quality Management TQM Diagrams Free
- Value Stream Mapping Free
- Astronomy Free
- Biology Free
- Chemistry Free
- Language Learning Free
- Mathematics Free
- Physics Free
- Piano Sheet Music Free
- Android User Interface Free
- Class Hierarchy Tree Free
- Data Flow Diagrams (DFD) Free
- DOM Tree Free
- Entity-Relationship Diagram (ERD) Free
- EXPRESS-G data Modeling Diagram Free
- IDEF0 Diagrams Free
- iPhone User Interface Free
- Jackson Structured Programming (JSP) Diagrams Free
- macOS User Interface Free
- Object-Role Modeling (ORM) Diagrams Free
- Rapid UML Free
- SYSML Free
- Website Wireframe Free
- Windows 10 User Interface Free
IDEF Business Process Diagrams
IDEF abbreviation was renamed in 1999 to become an “Integration DEFinition”. It is referred to a family of modeling languages that are widely used by both systems engineers and software engineers. Covering a wide range of uses from functional modeling to simulation, object-oriented analysis and design, data and knowledge acquisition, the most widely recognized components of the IDEF family are IDEF0 and IDEF1X.
Being referred to a family of modeling languages that cover a wide range of uses, IDEF can be used depending on its variation: IDEF14 — for network design, IDEF13 — for three schema mapping design, IDEF12 — for organization modeling, IDEF11 — for information artifact modeling, IDEF10 — for implementation architecture modeling, IDEF9 — for business constraint discovery, IDEF8 — for user interface modeling, IDEF7 — for information system auditing, IDEF6 — for design rationale capture, IDEF5 — for ontology description capture, IDEF4 — for object-oriented design, IDEF3 — for process description capture, IDEF2 — for simulation model design, IDEF1X — for data modeling, IDEF1 — for Information modeling and IDEF0 — for function modeling.
The IDEF Business Process Diagrams solution can help the ConceptDraw DIAGRAM users create the needed IDEF business process diagrams by providing them with useful drawing tools, the stencils meaning the design symbols including the connectors, IDEF design elements. These tools help users to create the great looking business process diagrams based on the IDEF methodology. Use the IDEF Business Process Diagrams solution to create effective database designs and object-oriented designs, following the integration definition methodology.
Being suitable for any user who needs to capture or to record different business processes and the system architecture, IDEF Business Process Diagrams solution is useful for many IT specialists, computer specialists, network and telecommunication engineers, IT managers, software engineers, system administrators, webmasters, system architects, and system engineers, etc.
-
Install this solution Free -
What I need to get started -
Solution Requirements - This solution requires the following products to be installed:
ConceptDraw DIAGRAM v18 - This solution requires the following products to be installed:
-
Compatibility - Sonoma (14), Sonoma (15)
MS Windows 10, 11 - Sonoma (14), Sonoma (15)
-
Support for this Solution -
Helpdesk
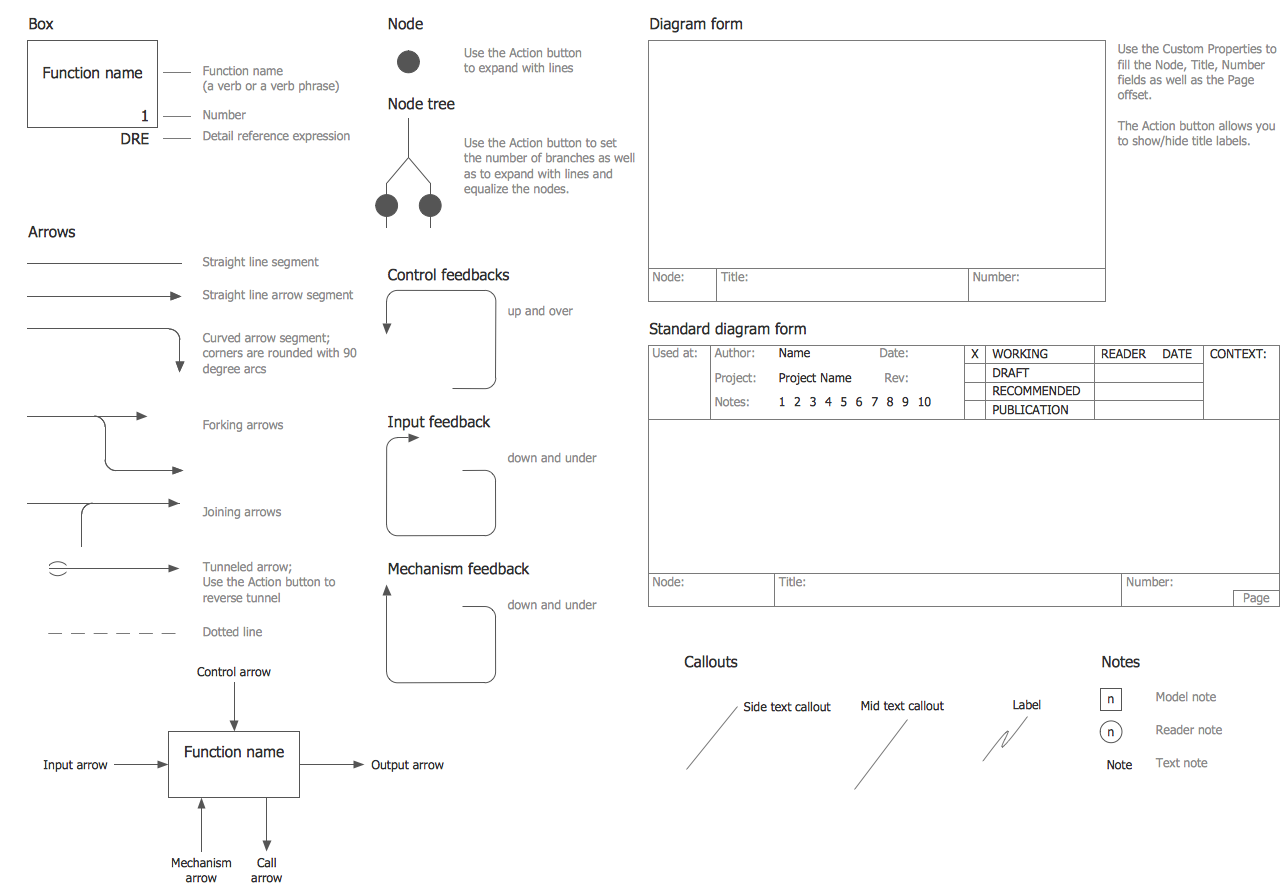
Design Elements — IDEF0
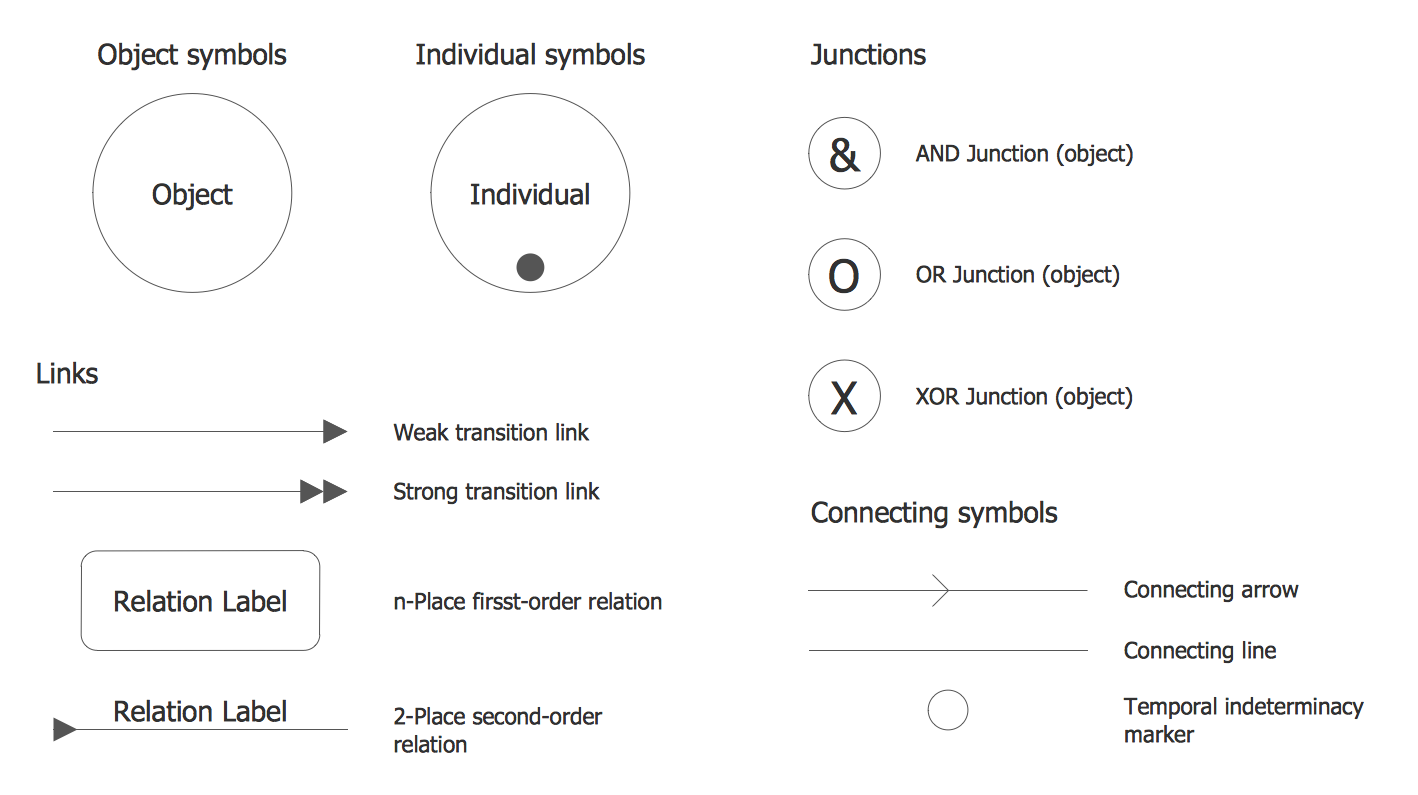
Design Elements — IDEF3 Object Schematic Symbols
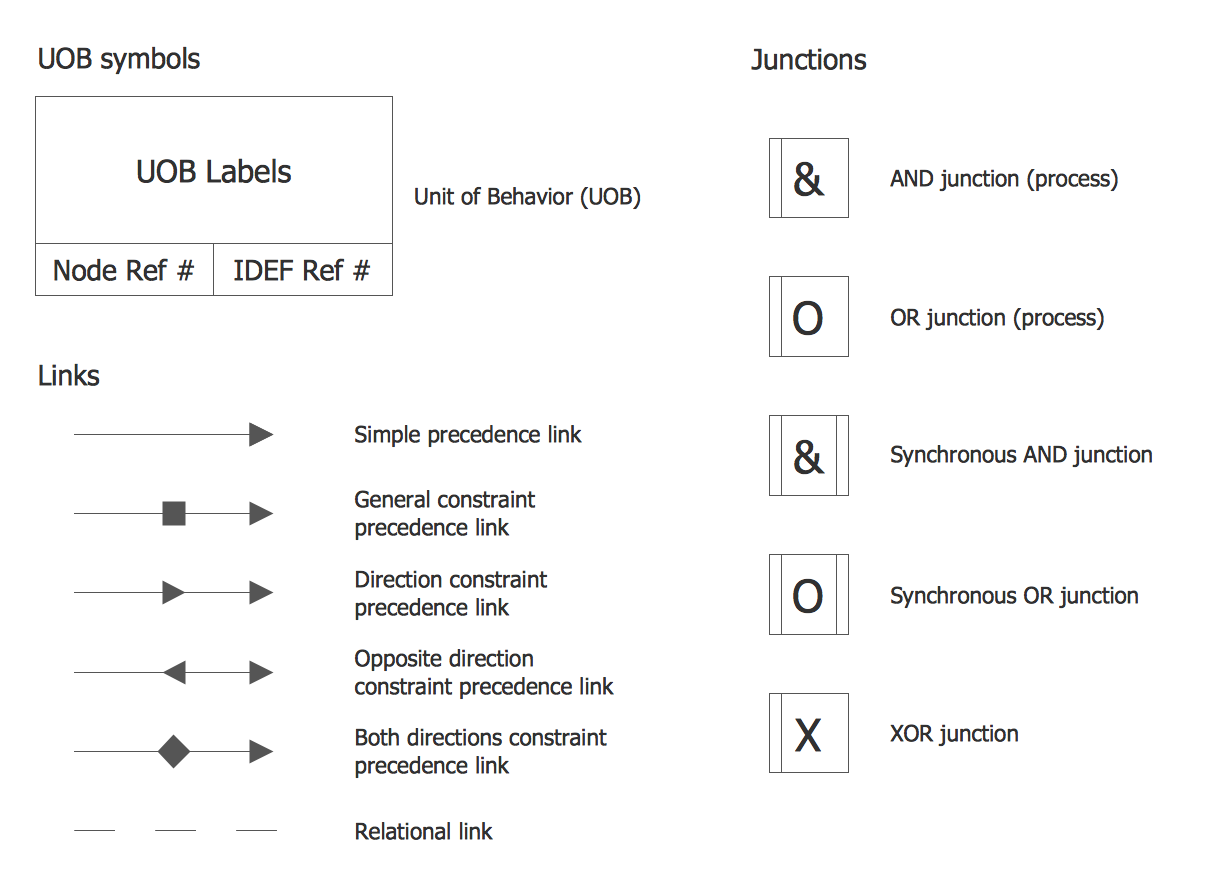
Design Elements — IDEF3 Process Schematic Symbols
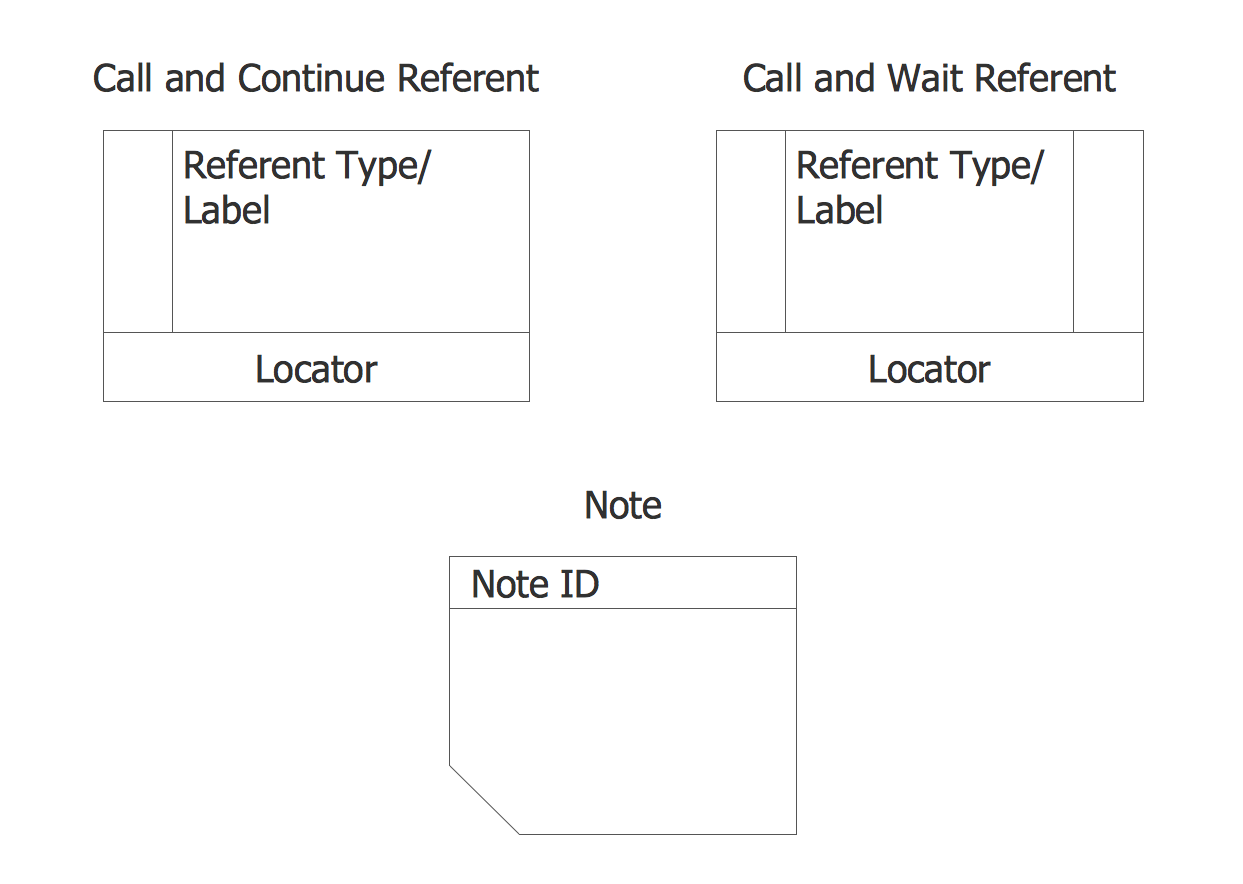
Design Elements — IDEF3 Referents and Notes
IDEF Business Process Diagrams Examples
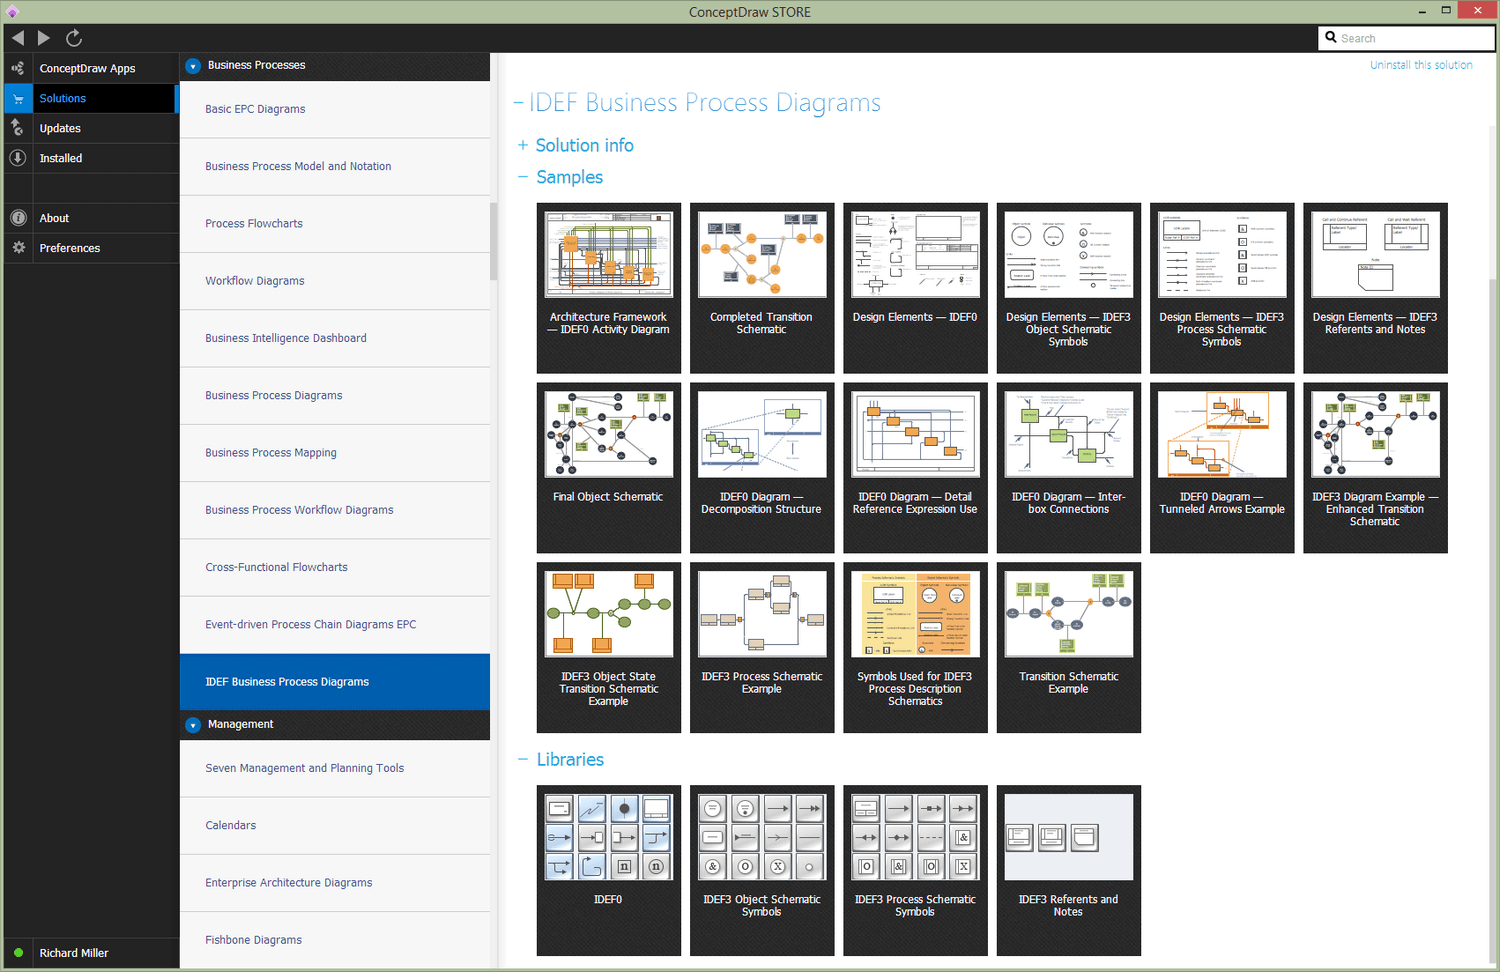
There are a few samples that you see on this page which were created in the ConceptDraw DIAGRAM application by using the IDEF Business Process Diagrams solution. Some of the solution's capabilities as well as the professional results which you can achieve are all demonstrated here on this page.
All source documents are vector graphic documents which are always available for modifying, reviewing and/or converting to many different formats, such as MS PowerPoint, PDF file, MS Visio, and many other graphic ones from the ConceptDraw Solution Park or ConceptDraw STORE. The IDEF Business Process Diagrams solution is available to all ConceptDraw DIAGRAM users to get installed and used while working in the ConceptDraw DIAGRAM diagramming and drawing software.
Example 1: Architecture Framework — IDEF0 Activity Diagram
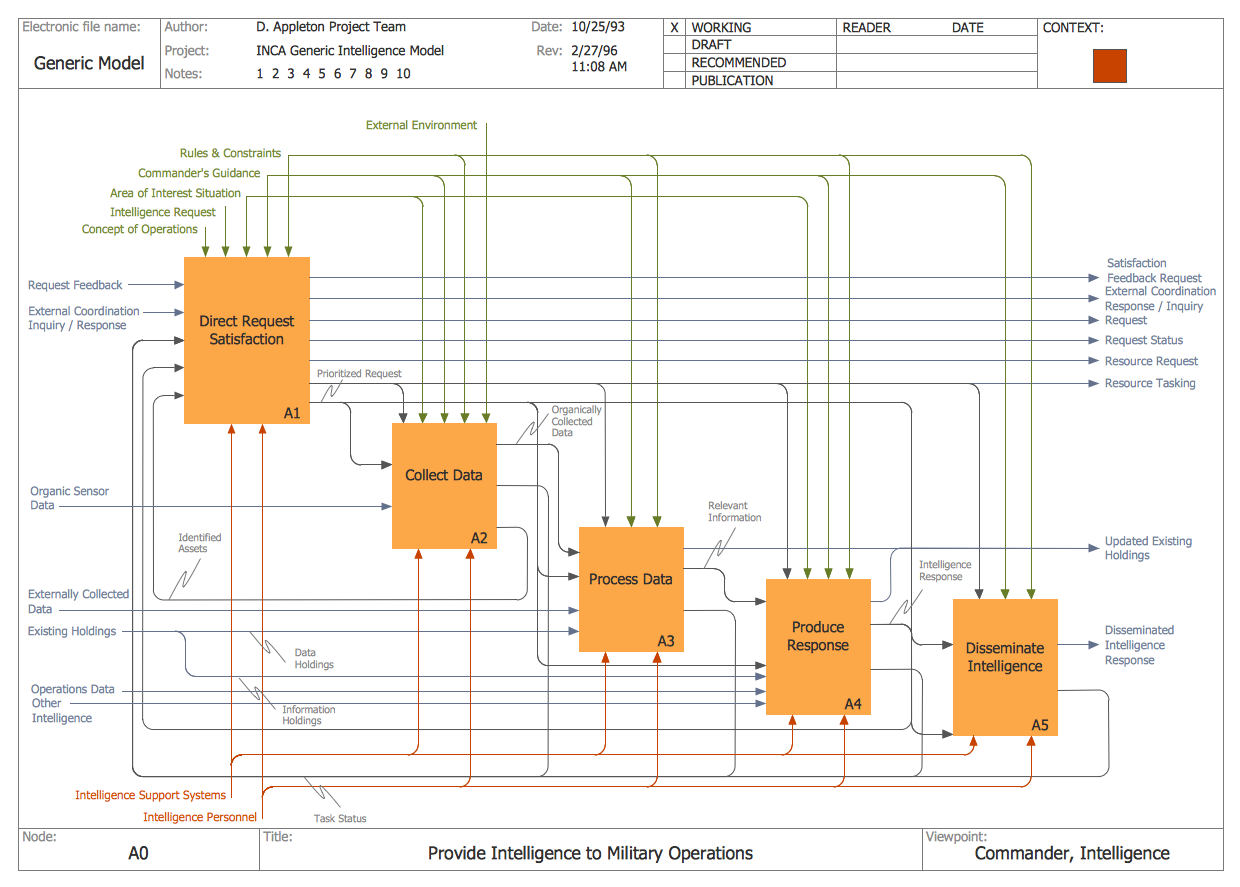
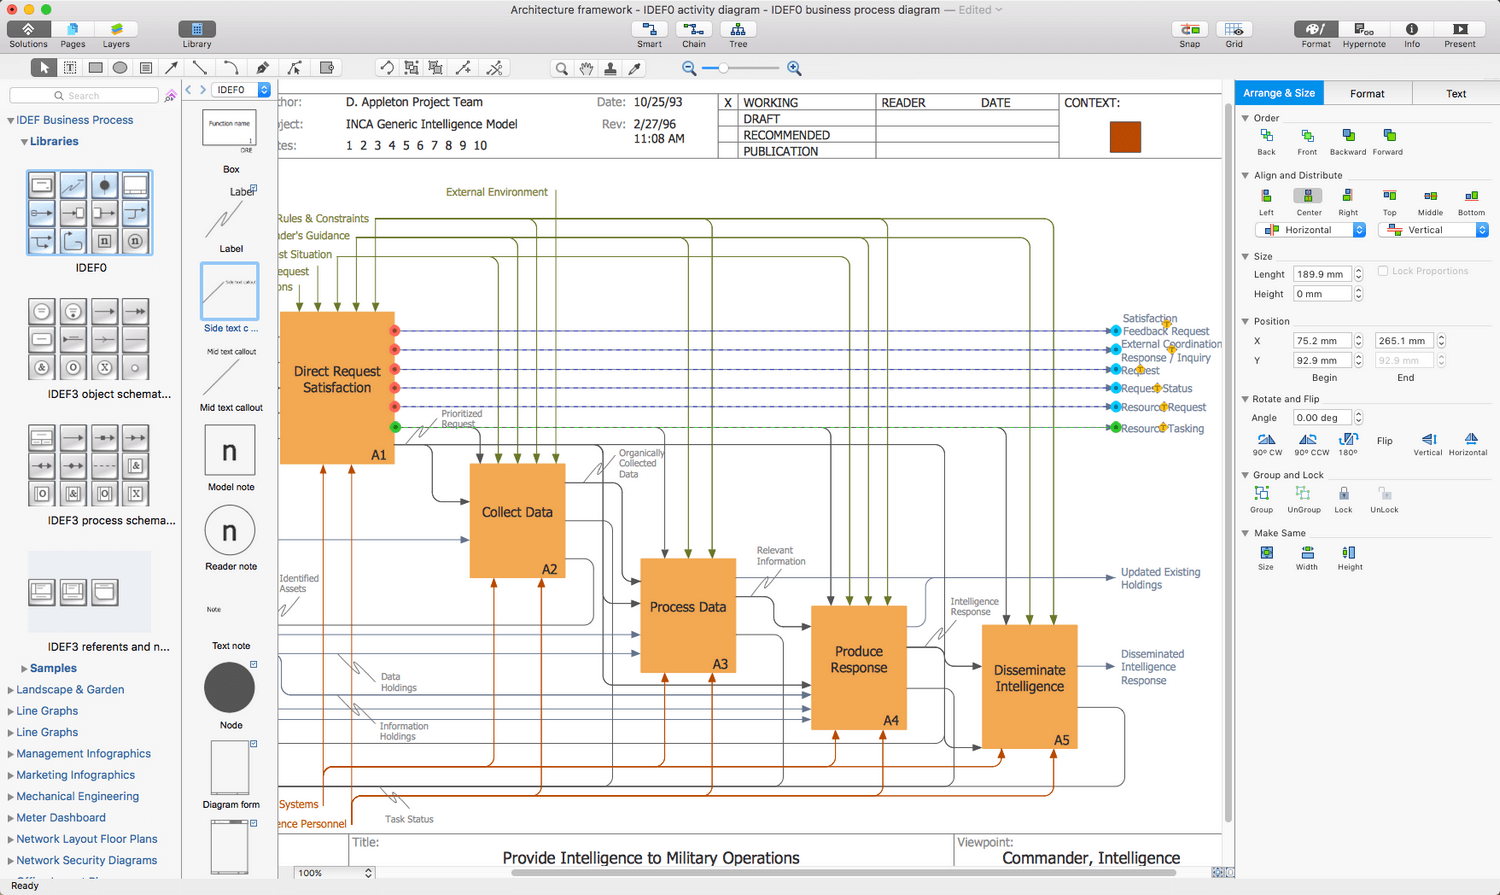
This diagram was created in ConceptDraw DIAGRAM using the IDEF0 library from the IDEF Business Process Diagrams solution. An experienced user spent 20 minutes creating this sample.
This IDEF0 Activity diagram is based on the "C4ISR Architecture Framework, Example Activity Diagram in IDEF0 Format.jpg" file from the Wikimedia Commons. The C4ISR Architectural Framework (C4ISR AF), also named as the Department of Defense Architecture Framework (DoDAF) was developed by the US Department of Defense in the 1990s. This framework or model helps the US Department of Defense facilitate governance at all levels and make the key decisions more effective. The main stages of the description and construction of the enterprise's architecture according to the DoDAF include direct request satisfaction, data collecting, processing data, producing response and dissemination intelligence. Besides that, the diagram includes the general information about the project’s name, its author, date of creation, node, title, viewpoints, etc. Despite all the complexity, this IDEF0 system architecture diagram communicates information in detail, moreover, it makes this effectively and professionally thanks to the common symbols and powerful drawing tools available from ConceptDraw's IDEF Business Process Diagrams solution.
Example 2: Completed Transition Schematic
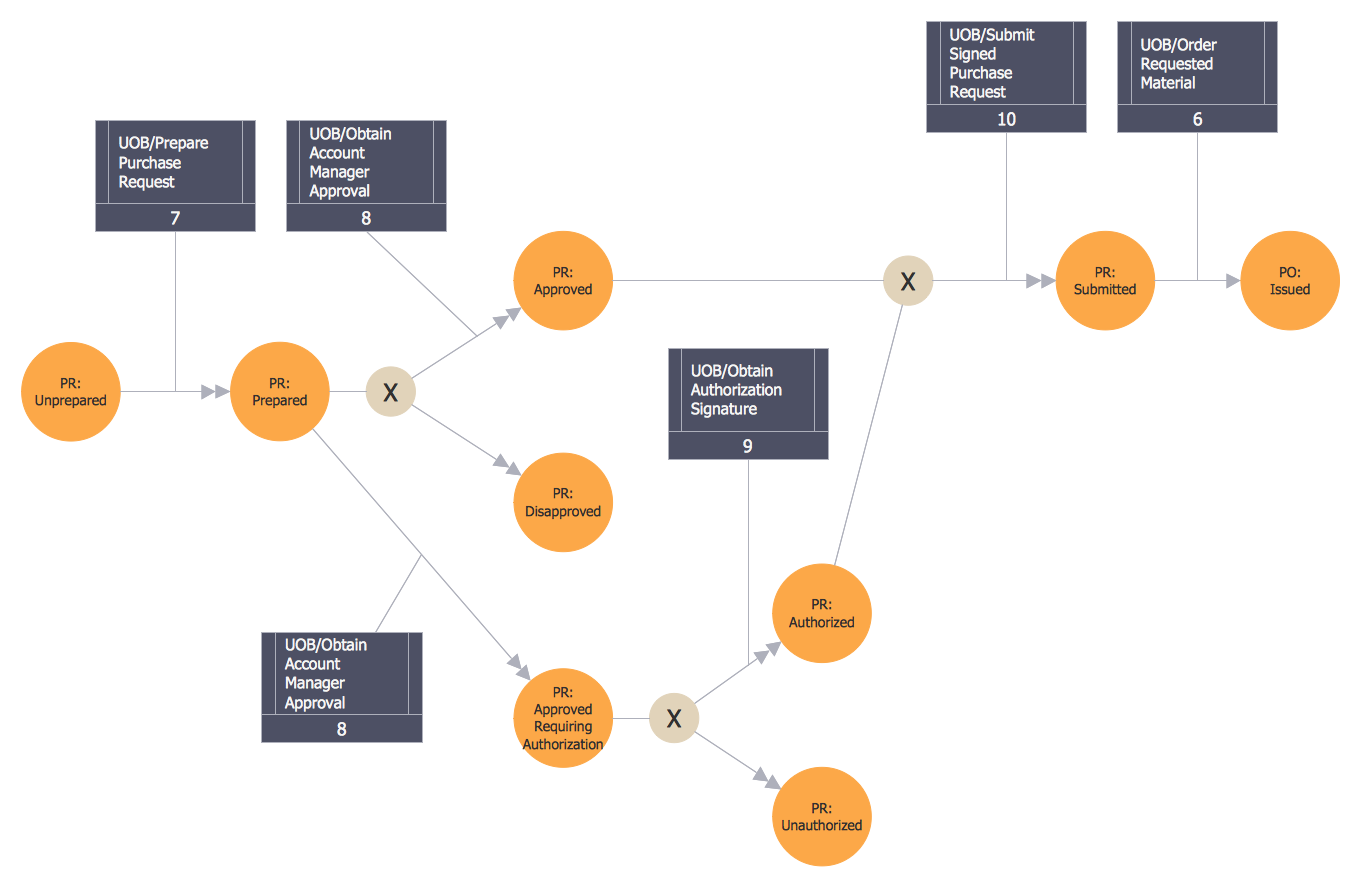
This diagram was created in ConceptDraw DIAGRAM using the IDEF3 Object Schematic Symbols and IDEF3 Referents and Notes libraries from the IDEF Business Process Diagrams solution. An experienced user spent 10 minutes creating this sample.
This sample demonstrates the IDEF3 Diagram showing a completed transition of a specific object through a business process. It was constructed on the base of the Wikimedia Commons file "5-21 Completed Transition Schematic.jpg". The Purchase Request (PR) form is a key document in a given process that is finally transformed into a Purchase Order (PO). The circles represent the objects, each circle includes the object's name along with its state, thus the prepared Purchase Request is indicated by the label "PR: Prepared", not prepared PR is represented as "PR: Unprepared", the approved PR is indicated by the label "PR: approved", the authorized PR is "PR: authorized" correspondingly, etc. The arrows with triangular filled-in heads connecting the circles describe the transition from one state to another. The IDEF Business Process Diagrams solution allows you to prepare the Process charts — diagrams that can represent a process at any level, from just a small component to a wide overview of the entire structure.
Example 3: Final Object Schematic
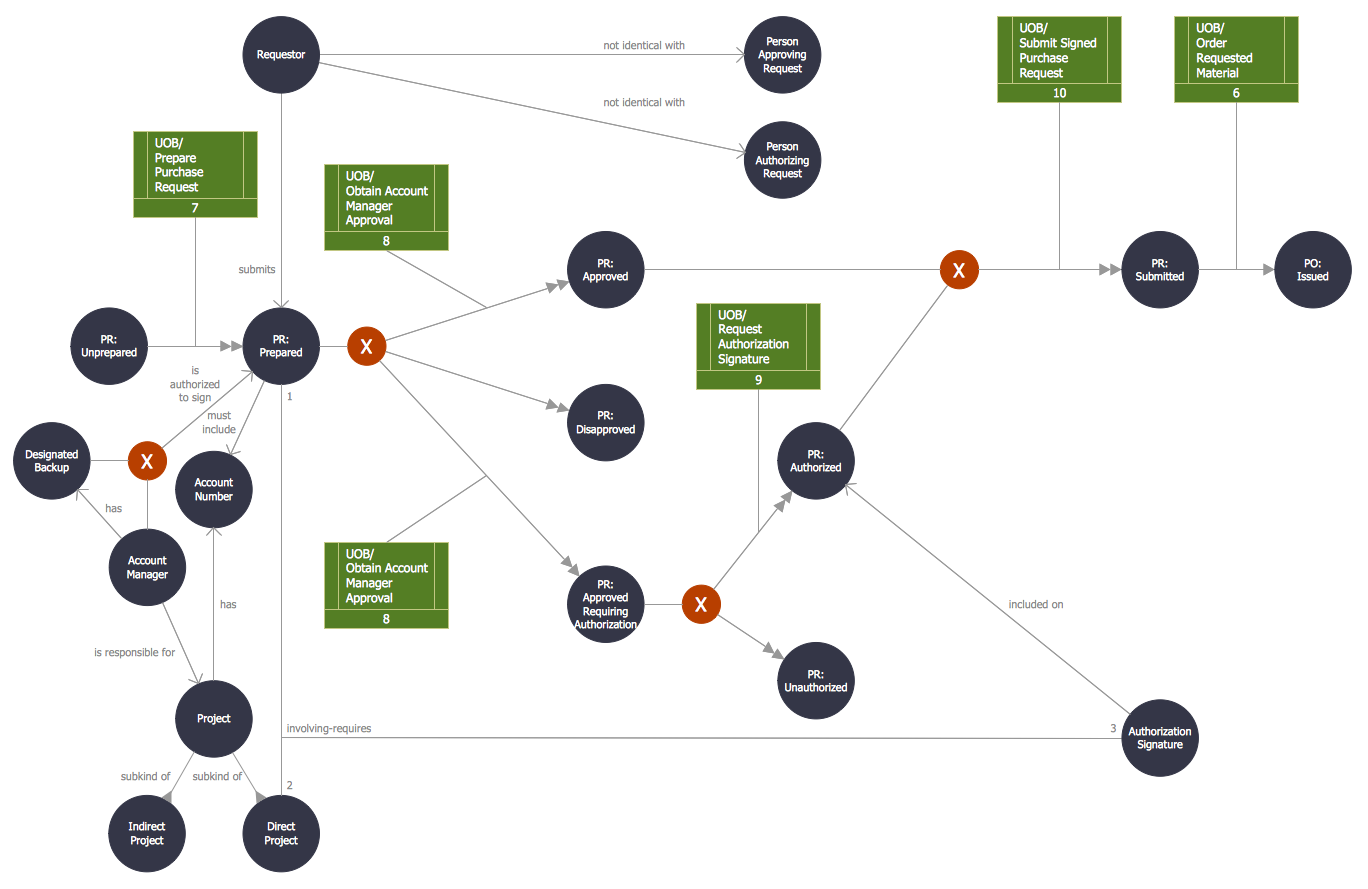
This diagram was created in ConceptDraw DIAGRAM using the IDEF3 Object Schematic Symbols and IDEF3 Referents and Notes libraries from the IDEF Business Process Diagrams solution. An experienced user spent 15 minutes creating this sample.
This sample illustrates the final object schematic and is designed on the base of “5-22 Final Object Schematic.jpg” illustration from the Wikimedia Commons. Expanding on the previous design of the Completed Transition schematic, now more functions of the process have been added to present a more complete view of the overall system. The context-setting information was added. Thus, you can see that the domain expert’s description points that the purchase requests related to the direct projects assume an authorization signature, the account managers and their designated backups need obligatory approval of all requests involving their projects. It is the most complete description of the process flow and object state transitions, the comments make it more detailed and comprehensive. The complete set of IDEF3 schematic symbols is available from the IDEF Business Process Diagrams solution and lets you represent accurately the principles of work of a certain system or organization in a form of IDEF3 Process Diagram, illustrate the integration definition.
Example 4: IDEF0 Diagram — Decomposition Structure
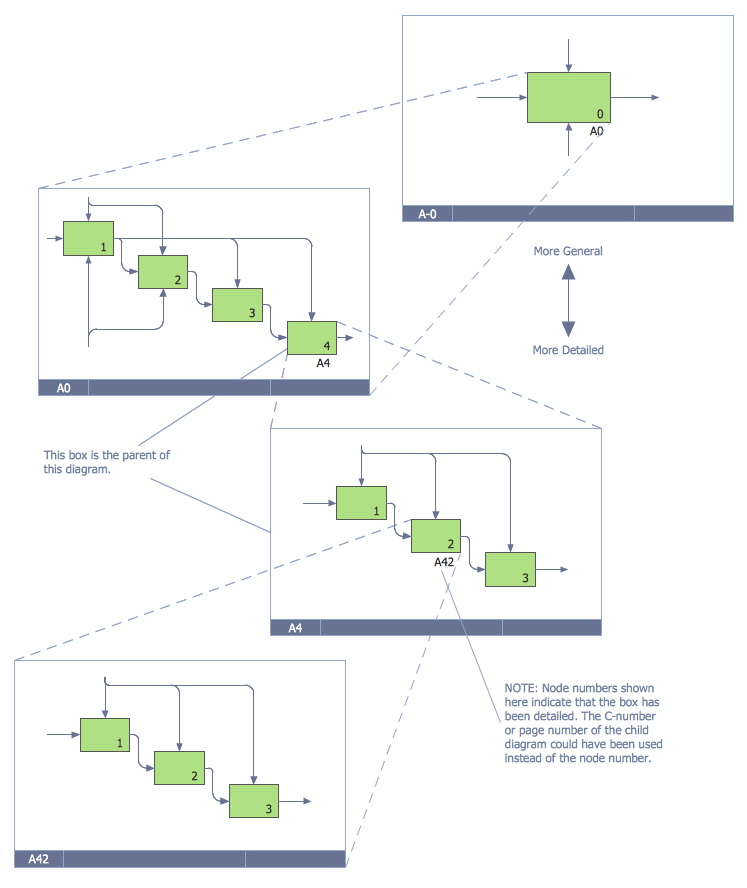
This diagram was created in ConceptDraw DIAGRAM using the IDEF0 library from the IDEF Business Process Diagrams solution. An experienced user spent 15 minutes creating this sample.
This IDEF0 diagram presents an example of a simple decomposition structure that can be used to represent the system architecture. It is designed in ConceptDraw DIAGRAM process modeling software and based on the “6 Decomposition Structure.svg” illustration from the Wikimedia Commons and. The decomposition structure is an effective method of splitting a process or function into its constituent components that reflect the individual physical processes of interest and lets them be easily analyzed. It is a process allowing representing the model of the system in the form of a hierarchical structure of individual diagrams. The process of decomposition can be also made with a goal to get the compressed representation of the global function. The level of the process detailing is determined directly by the developer of a model, but in any case, this method makes the model's representation less overloaded and easy perceived, makes the interactions between the components easily observed because some of them may be critical for the process.
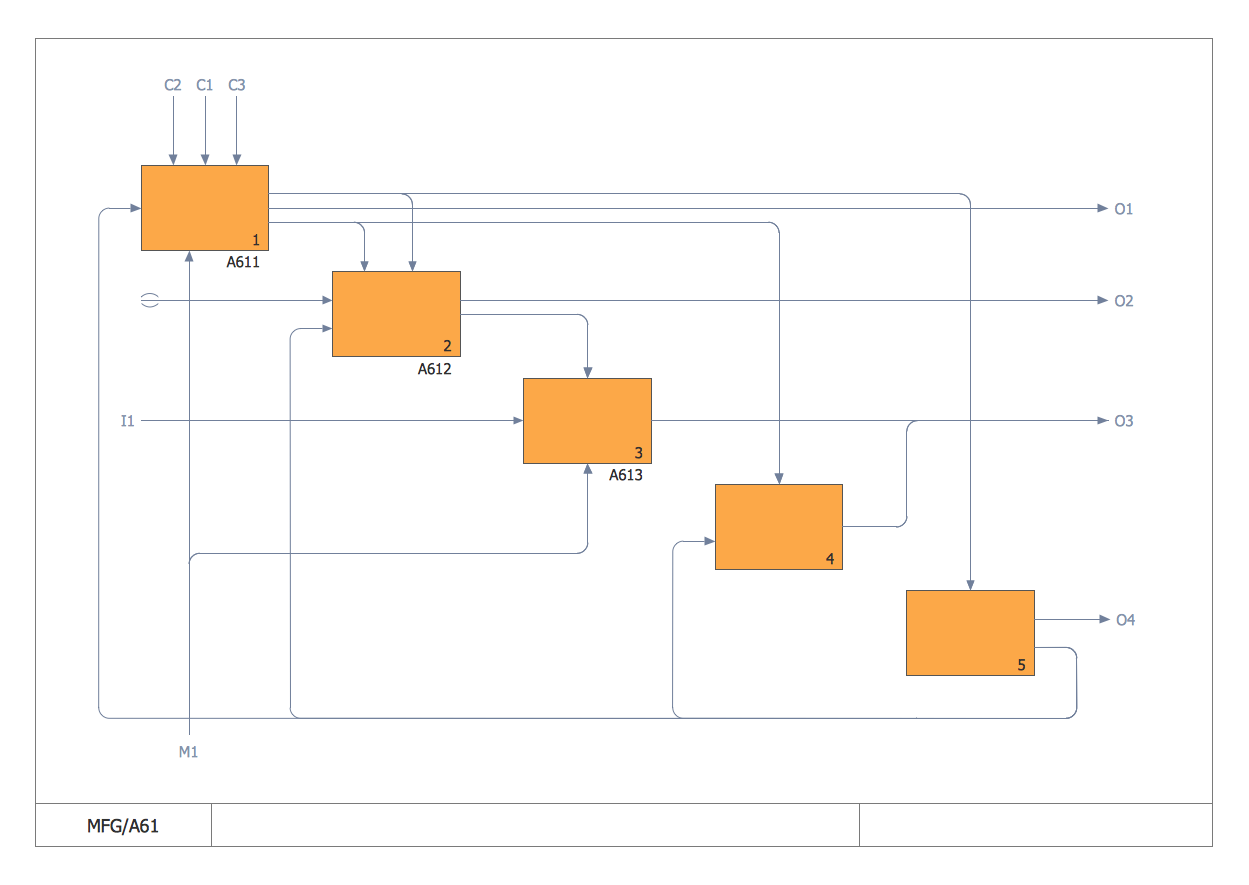
Example 5: IDEF0 Diagram — Detail Reference Expression Use
This diagram was created in ConceptDraw DIAGRAM using the IDEF0 library from the IDEF Business Process Diagrams solution. An experienced user spent 10 minutes creating this sample.
This sample diagram demonstrates the detailed reference expression use and was designed on the base of the Wikimedia Commons file "7 Detail Reference Expression Use.svg". It is a sample of decomposition or partitioning the complex modeled function into the simple component functions composing it. This model uses a simple common IDEF0 syntax — five diagram's functions are represented by boxes, all data interrelated with these functions like the inputs, outputs, controls, and mechanisms are depicted by arrows. The inputs are shown by arrows entering the box on the left side, the outputs enter on the right one. The arrows entering the top display the controls and the bottom ones show the mechanisms. One can use the high-functional IDEF Business Process Diagrams solution in database design, object-oriented design, to show how differently components of a system interact with each other. The use of ConceptDraw DIAGRAM and the mentioned solution makes the communication functional and productive system architecture designs easy.
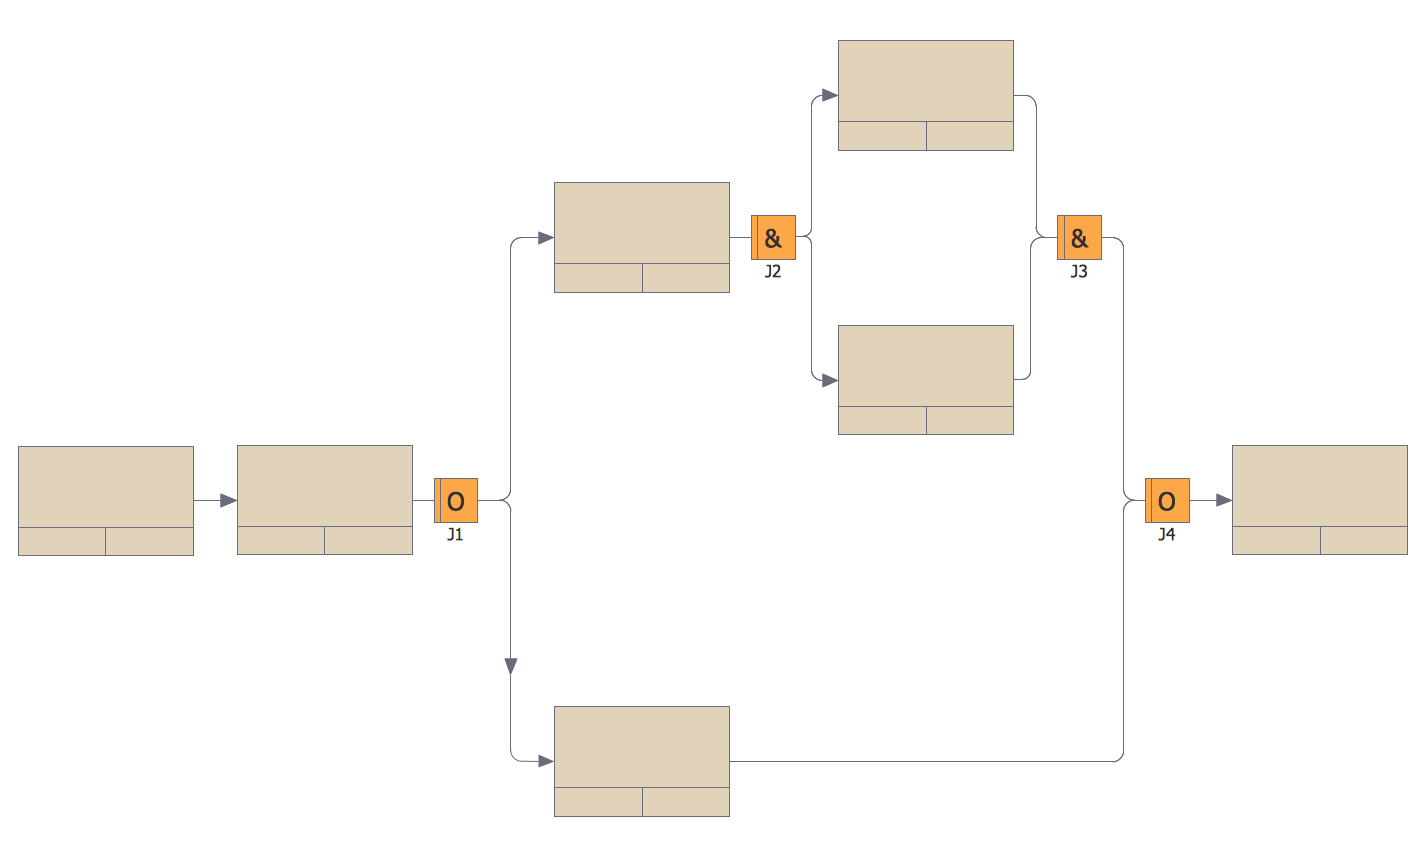
Example 6: IDEF3 Diagram — Object State Transition Schematic
This diagram was created in ConceptDraw DIAGRAM using the IDEF0 library from the IDEF Business Process Diagrams solution. An experienced user spent 10 minutes creating this sample.
This IDEF3 diagram sample id based on the "6-4 Example IDEF3 Object State Transition Schematic.jpg" Wikimedia Commons file. It is an example of the process decomposition, the sequence of actions is consistently represented. Each action is depicted as a box, you can type in their specific names according to the modeled business process. The arrows connections depict the essential relationships between the actions, all links in IDEF3 are unidirectional. There are two different types of links in this diagram, with one arrow (Temporal precedence) or two arrows (Object flow) and one can type in their names. The first type of link means that the previous action needs to be completed before the next action can begin, the second one means that the output of the previous action is the input of the next one. Each link is strict and precise, so the reason for its appearance is easily observed and understandable. You can see that in many cases the completion of one action initiates the start of another one.
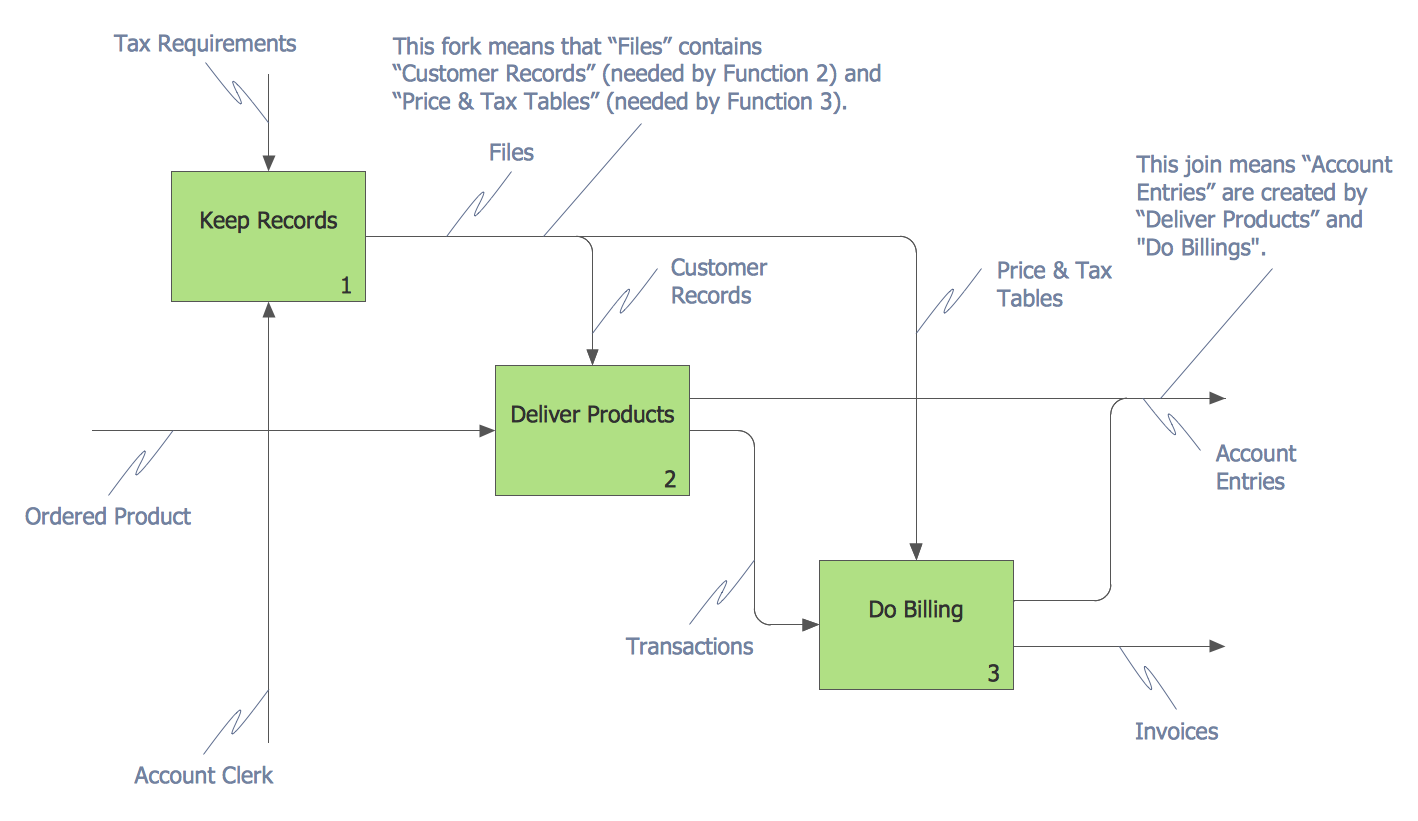
Example 7: IDEF0 Diagram — Inter-box Connections
This diagram was created in ConceptDraw DIAGRAM using the IDEF0 library from the IDEF Business Process Diagrams solution. An experienced user spent 10 minutes creating this sample.
This IDEF0 diagram sample was made on the base of the Wikimedia Commons file "12 Connections Between Boxes.svg". There are three functions depicted by boxes in this diagram – Keep Records, Deliver Products, and Do Billing. Each function has entered and outgoing arrows, the entered data are processed and the result is passed further. The tax requirements are the controls entering from the top to the Keep Records box. The Account Clerk is a mechanism providing the supporting means for performing the function connection and is pointed up from the bottom to the same box. The Files outgoing from the Keep Records contain the Customer Records and Price&Tax Tables, that are passed to the Deliver Products and Do Billing functions correspondingly. The Transactions are also passed from the Deliver Products function to the Do Billing function. The Ordered Products are the inputs entering the Deliver Products box from the left. The Account Entries and Invoices are the outputs that leave the boxes from the right side.
Example 8: IDEF3 Process Schematic
This diagram was created in ConceptDraw DIAGRAM using the IDEF0 library from the IDEF Business Process Diagrams solution. An experienced user spent 10 minutes creating this sample.
This sample represents the IDEF3 diagram example and was made on the base of the Wikimedia Commons file “6-1 Example IDEF3 Process Schematic.jpg”. It is a typical simple example of an IDEF3 schematic that is modeled and read from the left to right, from the most left side element. All elements and all steps of the described scenario, and the precedence relationships are well observed. IDEF3 is a popular methodology that allows modeling and documenting the processes occurring in the system based on all known information about these processes. It allows showing the cause-and-effect relationships between the situations and events in a clear visual form. As for the application, the IDEF3 methodology is equally useful and widely used in the development of information systems and business process modeling. Design clear and informative IDEF0 and IDEF3 diagrams fast and easily using the IDEF notation and business process modeling notation objects offered by the ConceptDraw's IDEF Business Process Diagrams solution libraries.
Example 9: IDEF0 Diagram — Tunneled Arrows
This diagram was created in ConceptDraw DIAGRAM using the IDEF0 library from the IDEF Business Process Diagrams solution. An experienced user spent 10 minutes creating this sample.
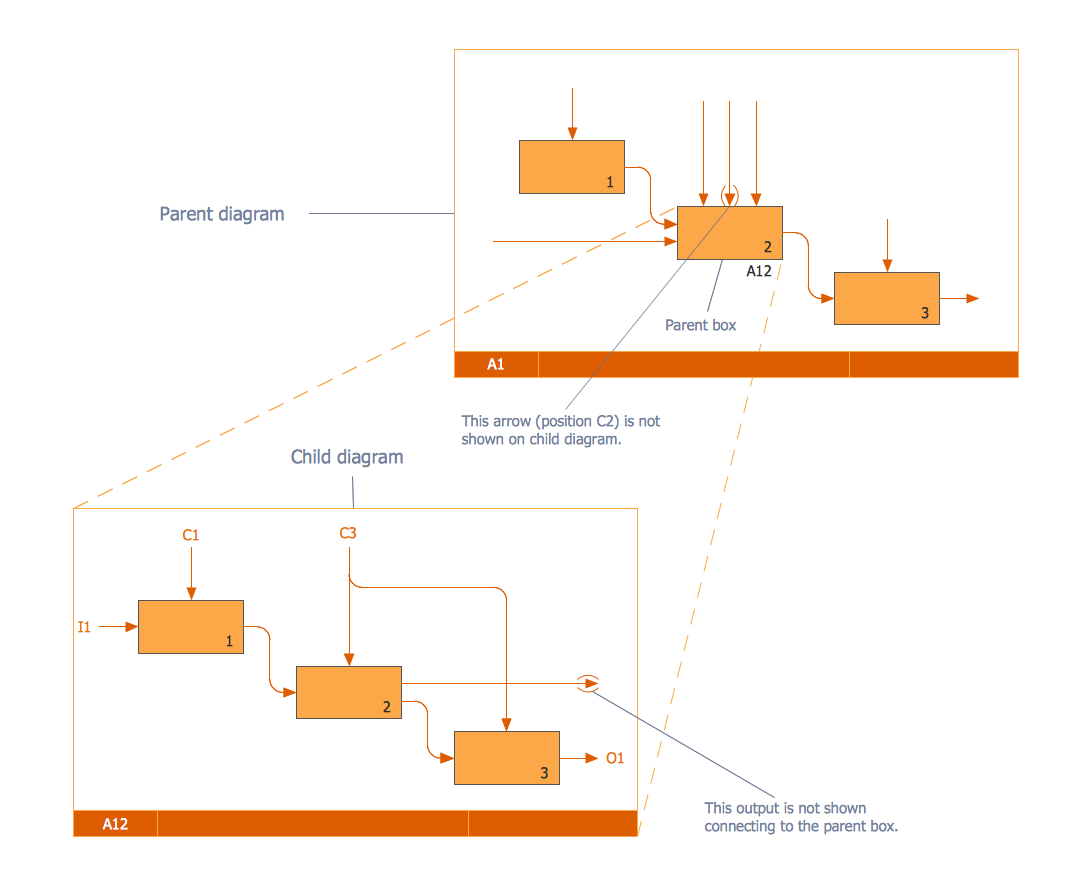
This sample represents the tunneled arrows on the IDEF0 diagram based on the Wikimedia Commons file "18 Example of Tunneled Arrows.svg". The main components of any IDEF0 diagram are functions and data that interrelate these functions. All connections between the boxes are visually marked with arrows. This diagram includes two parts – the parent diagram and the child diagram. Each of them contains three functions, the main functions are depicted at the left bottom corners of each diagram, each subsequent function is located on the right and below the previous one. The child diagram is composed for the second function of the top diagram. The tunneled arrows are the special type of arrows, which provide information at one level of decomposition and aren't needed at another one, parent or child level. One can see that the middle (C2) arrow entering the parent's second function isn’t shown on the child diagram and one of the arrows outgoing from the child’s second function isn’t also shown connecting to the parent box, so they are both tunneled arrows.
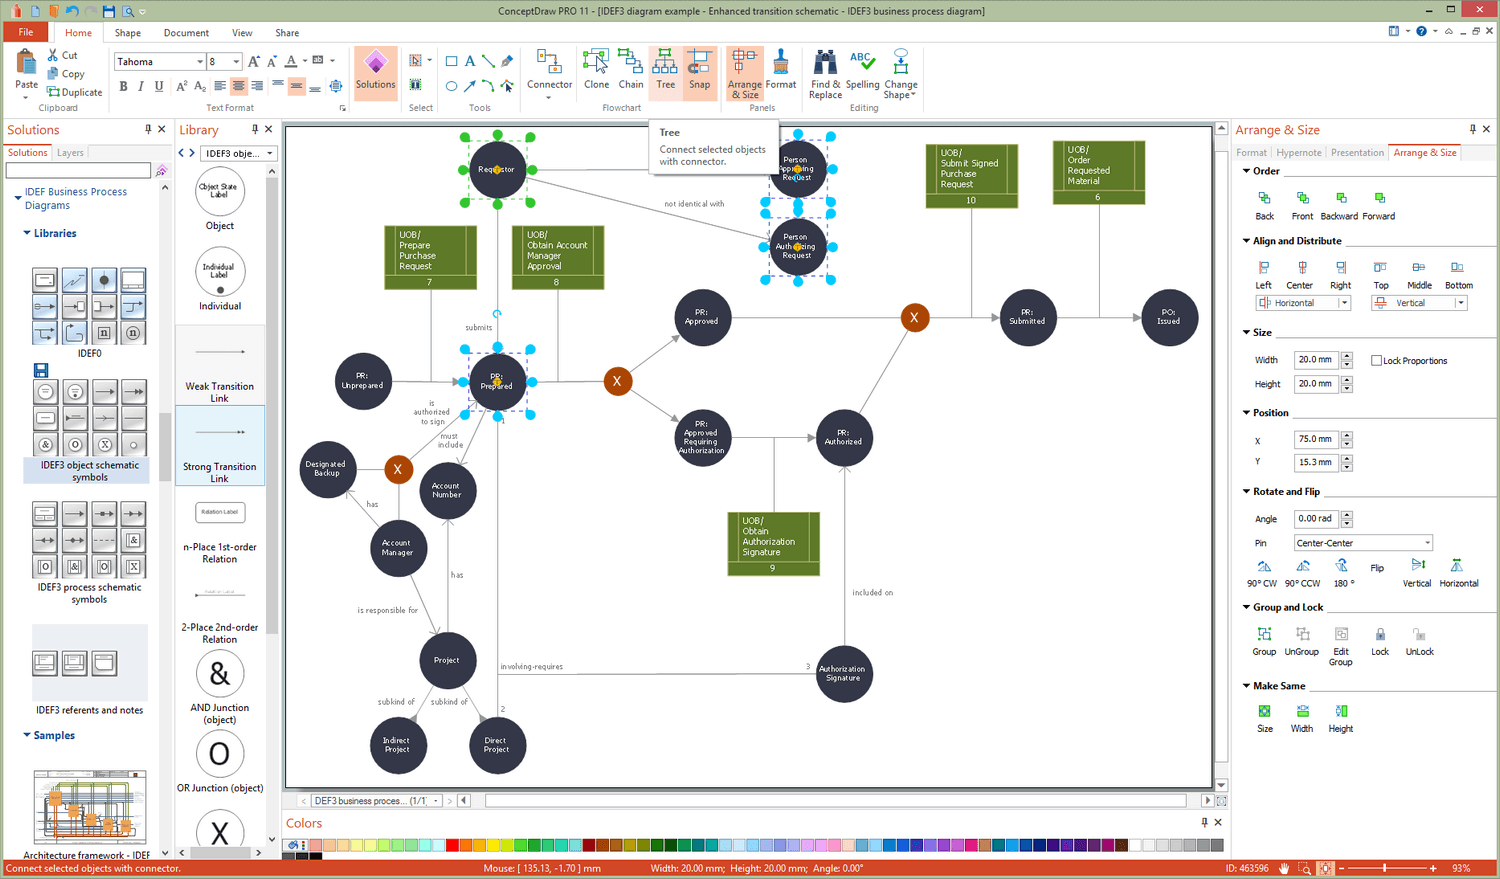
Example 10: IDEF3 Diagram — Enhanced Transition Schematic
This diagram was created in ConceptDraw DIAGRAM using the IDEF0 library from the IDEF Business Process Diagrams solution. An experienced user spent 15 minutes creating this sample.
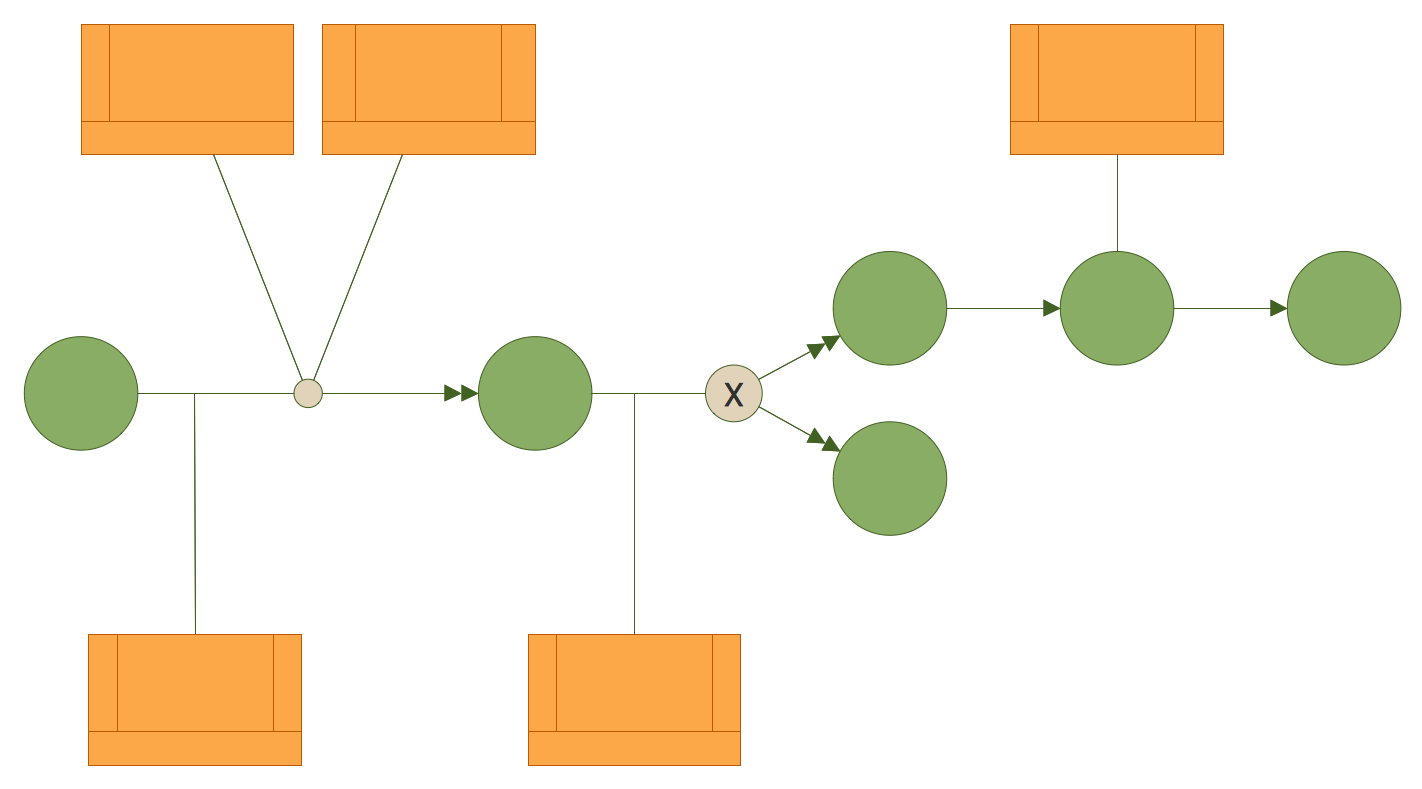
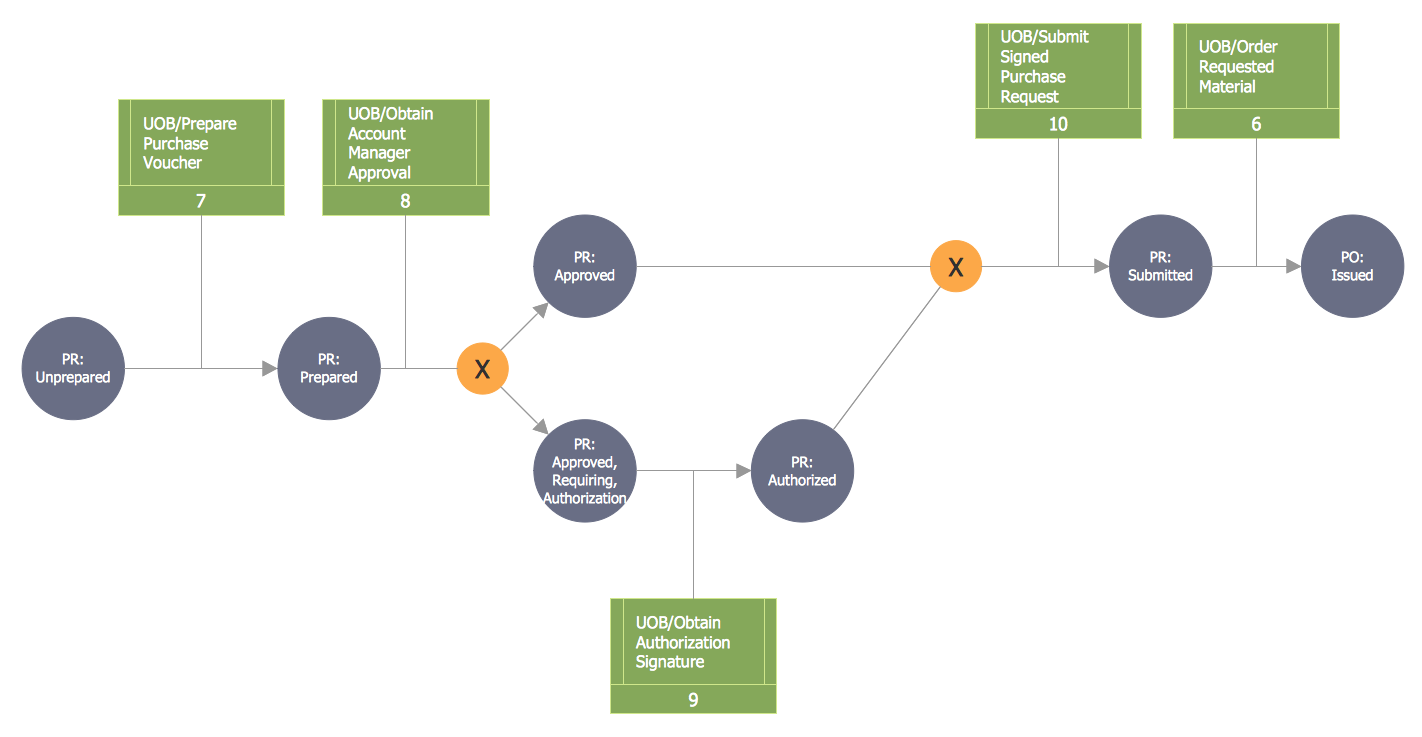
This IDEF3 diagram sample demonstrates an enhanced transition schematic. Being based on the Wikimedia Commons file “2-03 Example of an Enhanced Transition Schematic.jpg” this sample is made fully by means of ConceptDraw DIAGRAM business process modeling software and IDEF Business Process Diagrams solution tools. The IDEF3 diagram lets visually decompose the actions for detailed analysis, moreover, the actions can be decomposed as many times as needed. The actions are depicted by boxes, the diagram's circles denote states and the directed arrows indicate all possible logical transitions between these states. The "X" symbol in a circle denotes XOR operation and means that only one of the connected actions can be executed, only one previous process is completed and only one of the following processes is running. For additional clearness, each type of notation symbol is colored with its own color in the diagram. All IDEF3 notation symbols are available for use from the solution's IDEF3 Object Schematic Symbols, IDEF3 Process Schematic Symbols, and IDEF3 Referents and Notes libraries.

Example 11: Symbols Used for IDEF3 Process Description Schematics
This diagram was created in ConceptDraw DIAGRAM using the IDEF0 library from the IDEF Business Process Diagrams solution. An experienced user spent 15 minutes creating this sample.
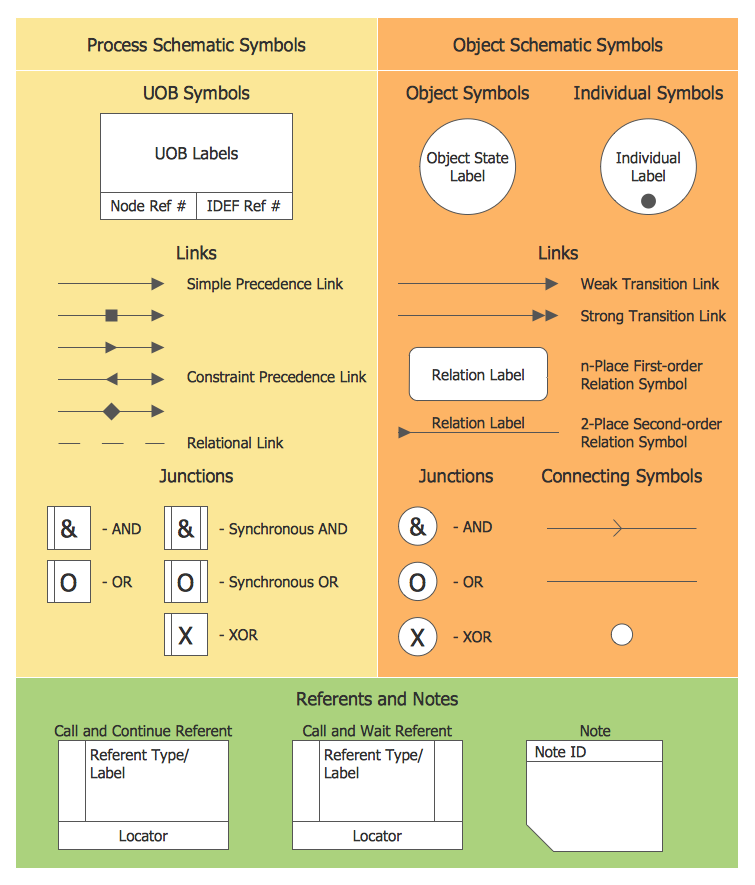
This sample demonstrates a set of symbols used for the IDEF3 Process description schematics. It was made on the base of common IDEF notation and the Wikimedia Commons file "3-01a Symbols Used for IDEF3 Process Description Schematics.jpg". There are specified two groups - the process schematic symbols (UOB symbols, links and junction symbols) and object schematic symbols (object symbols and individual symbols, links, junctions and connecting symbols) because the IDEF3 descriptions can be developed from two different perspectives: process-centered and object-centered. Apart from them, the reference and notes symbols are included in the solution's libraries and represented in this diagram. They are common for the across processes and object schematics, and are used to depict the complex process descriptions and to show the cross-referencing between these approaches. The links symbols serve to connect the UOB boxes illustrating the dynamic processes. The junctions symbols depict the logic of the process branching.
Example 12: IDEF3 Diagram — Transition Schematic
This diagram was created in ConceptDraw DIAGRAM using the IDEF0 library from the IDEF Business Process Diagrams solution. An experienced user spent 10 minutes creating this sample.
This IDEF3 diagram sample was designed based on the Wikimedia Commons file "2-02 Example of a Transition Schematic.jpg". It is a simple Object schematic representing the scenario of materials order that is based on the business owner’s description. This sample can be considered as a Transition Schematic, it illustrates the nature and structure of object state transitions for occurrences of the order material scenario. The Purchase Request form is a key document in this process that is finally transformed into a Purchase Order (PO) by passing through the Order Material process. The objects of certain kinds in certain states are represented at the circles with indication of their types or classes and their states within a given process. The full set of possible states typical for a considered domain needs to be defined before modeling is initiated. The arrows connecting the circles depict transitions from one state to another.
Inside
What I Need to Get Started
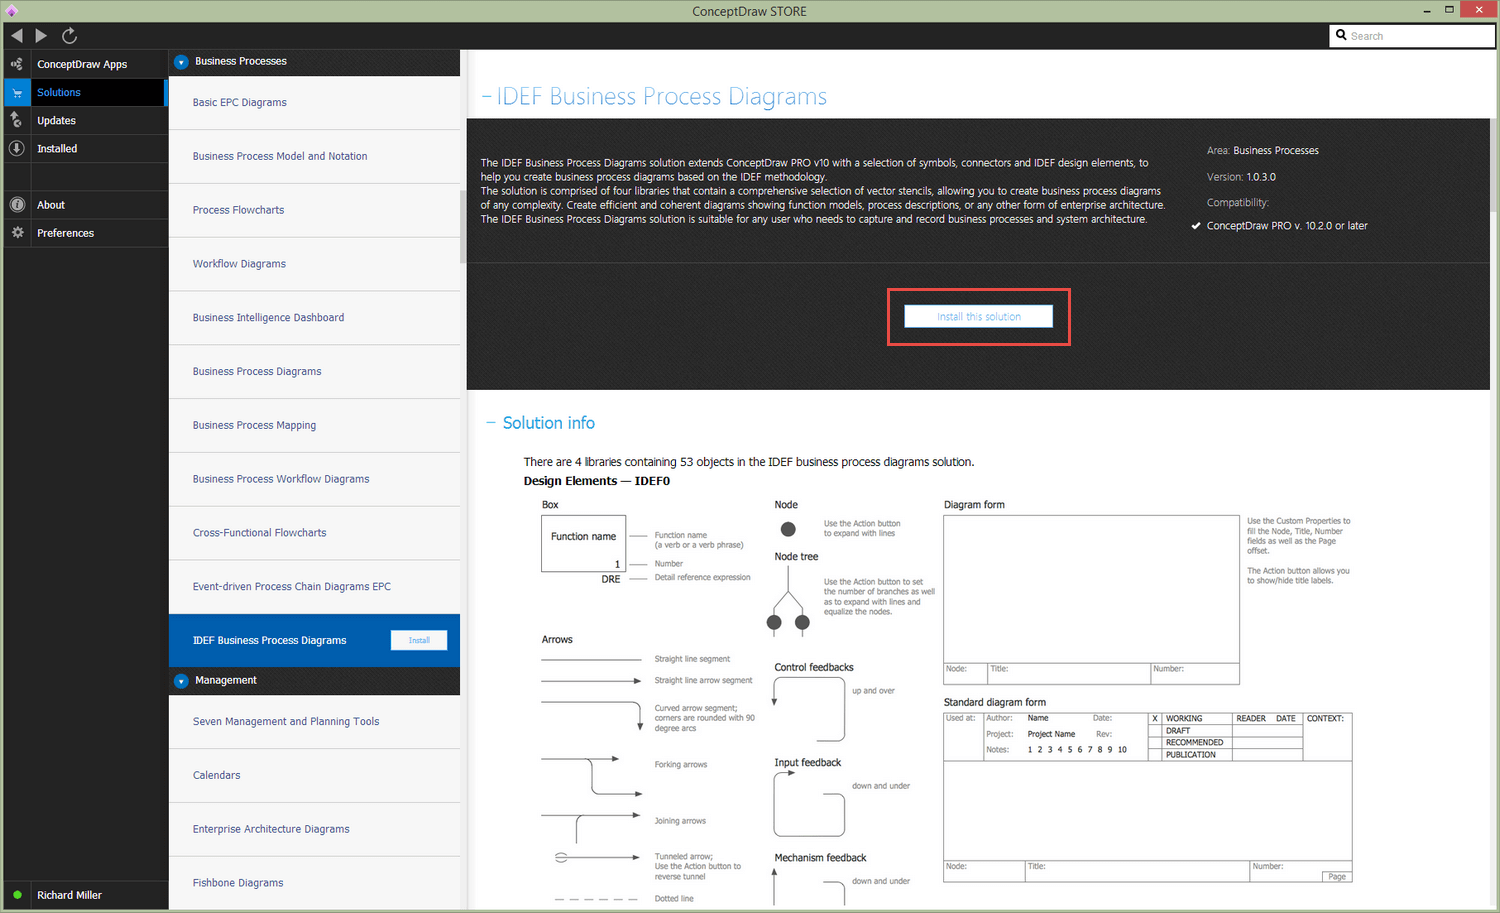
Both ConceptDraw DIAGRAM diagramming and drawing software and the IDEF Business Process Diagrams solution can help creating the business processes diagrams you need. The IDEF Business Process Diagrams solution can be found in the Business Processes area of ConceptDraw STORE application that can be downloaded from this site. Make sure that both ConceptDraw DIAGRAM and ConceptDraw STORE applications are installed on your computer before you get started.
How to install
After ConceptDraw STORE and ConceptDraw DIAGRAM are downloaded and installed, you can install the IDEF Business Process Diagrams solution from the ConceptDraw STORE.
Start using
To make sure that you are doing it all right, use the pre-designed symbols from the stencil libraries from the solution to make your drawings look smart and professional. Also, the pre-made examples from this solution can be used as drafts so your own drawings can be based on them. Using the samples, you can always change their structures, colors and data.
Business process modelling using IDEF0 and IDEF3 diagrams
Originally developed and research funded by the US Air Force, Integration Definition, or IDEF, refers to a family of modelling languages that are used in the fields of system and software engineering. The key aim of IDEF was to devise a method for modelling data subsystems in a generic fashion; a way of sharing information and defining business processes between associated agencies and suppliers. The first language of this form, IDEF1, was initially concerned with data storage systems, and the ability to represent data regardless of how it is physically stored and used. Other IDEF languages were soon developed - 0, 1X, 2, 3 and 4 are considered developed in full (a further 10 exist no more than beyond initial definition), and focus on applying the same methodology to all aspects of business process modelling (BPM), such as business operations, functional modelling, and process flow descriptions.
Since the late 1960's, Douglas T. Ross had been developing a systems engineering and software engineering methodology called the Structured Analysis and Design Technique (SADT), with its intention being to describe a system as a hierarchy of functions. With backing from the US Air Force, this would eventually be formalised as IDEF0, a function modelling language capable of analyzing and communicating the functional perspective of system.
The methodology identifies the prime function, and displays it on the 'Top Level Context Diagram' using a standardized set of symbols. From this diagram, diagrams for lower level processes can be produced. The language is now established enough to be used by a wide variety of businesses and organisations to show dataflow and business process using precise and strictly defined diagrams and graphical notations.

Fig. 1. IDEF0 Diagram Example
According to IDEF.com, these are the communicative concepts to be followed when creating an IDEF0 diagram:
- Diagrams based on simple box and arrow graphics.
- English text labels to describe boxes and arrows and glossary and text to define the precise meanings of diagram elements.
- The gradual exposition of detail featuring a hierarchical structure, with the major functions at the top and with successive levels of sub functions revealing well-bounded detail breakout.
- A "node chart" that provides a quick index for locating details within the hierarchic structure of diagrams.
- The limitation of detail to no more than six sub functions on each successive function.
Acting as a complement to IDEF0, the IDEF3 process description method records specific knowledge of behavioural aspects of a system or process. There are two modes in which it can do so, as described by Wikipedia:
- Process Flow Descriptions, to capture the relationships between actions within the context of a specific scenario.
- Object State Transition, to capture the description of the allowable states and conditions.
Whereas IDEF0 describes an idealized model of a system or process, an IDEF3 diagram provides a description of actual process flow within an organization or business, or the changes that occur to an object within that system. This method of knowledge capture is recorded in two different perspectives - users are able to create both process schematics and object schematics using the IDEF3 schematic symbols.

Fig. 2. IDEF3 Diagram Example
ConceptDraw has created a solution that collects all symbols necessary to create professional IDEF0 and IDEF3 diagrams, as well as templates and step-by-step lessons that help create your own process diagram from the ground up. The IDEF Business Process Diagrams solution for ConceptDraw DIAGRAM contains extensive libraries of vector stencils that allow users to create professional looking diagrams of any complexity. The power of ConceptDraw DIAGRAM means that recording a business process is a quick and painless task - smart connectors allow you to map your diagram on the screen almost as quickly as it comes to mind.
IDEF methodology is suitable for almost any form of business, and for anyone who needs to record enterprise architecture in a process driven manner. The IDEF Business Process Diagram solution and ConceptDraw DIAGRAM cater for these needs, giving both beginner and experienced users the tools they need to create effective business process diagrams.