Modelling Complex Events with Event-Driven Process chain
Event-Driven Process Chain Diagrams for improvement throughout an organisation. ConceptDraw DIAGRAM - software that reduces the time needed to create a business process model.HelpDesk
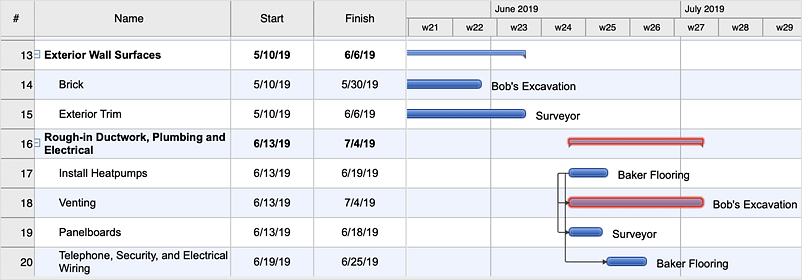
How to Use Critical Path Analysis for Scheduling Complex Projects
Critical Path Analysis helps you to identify the minimum length of time needed to complete a project. Where you need to run an accelerated project, it helps you to identify which project steps you should accelerate to complete the project within the available time.Use a Fishbone Diagram to Attack Complex Problems
Any project is a complex system which rarely goes without some problems, even the most minor. But the success of the project mostly depends from the ability effectively solve appearing problems. There are many methods for problem solving, one of the most effective is the use a Fishbone diagram to attack complex problems. Use ConceptDraw DIAGRAM diagramming software with Fishbone Diagrams Solution to attack any complex problems with fishbone diagrams graphic method. Construct Fishbone diagram to help users brainstorm and break down a complex problem.The vector stencils library "Expanded objects BPMN 1.2" contains 15 symbols of expanded objects.
Use these shapes for drawing business process diagrams (BPMN 1.2) in the ConceptDraw PRO diagramming and vector drawing software extended with the Business Process Diagram solution from the Business Processes area of ConceptDraw Solution Park.
www.conceptdraw.com/ solution-park/ business-process-diagram
The vector stencils library "Expanded objects BPMN 1.2" contains 15 symbols of expanded objects.
Use these shapes for drawing business process diagrams (BPMN 1.2) in the ConceptDraw PRO diagramming and vector drawing software extended with the Business Process Diagram solution from the Business Processes area of ConceptDraw Solution Park.
www.conceptdraw.com/ solution-park/ business-process-diagram
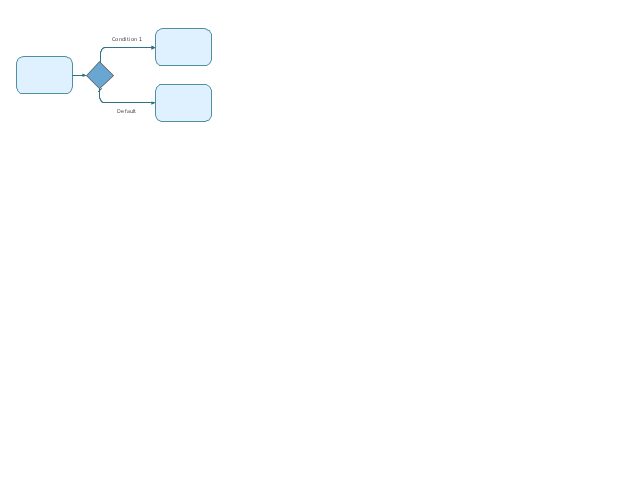
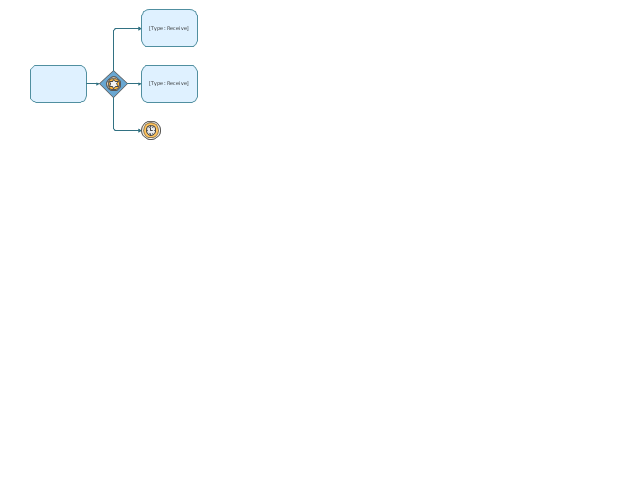
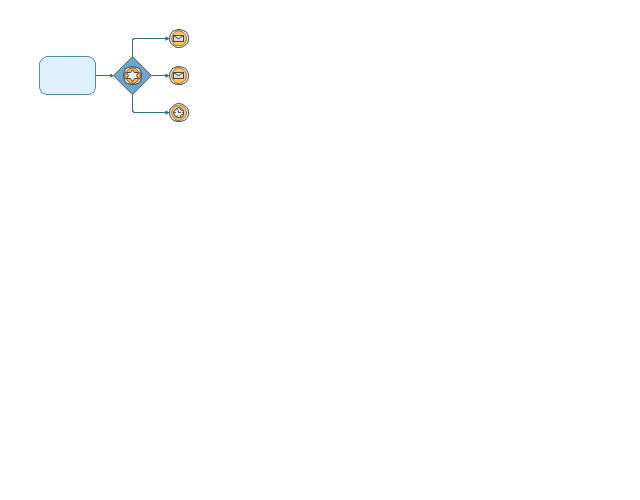
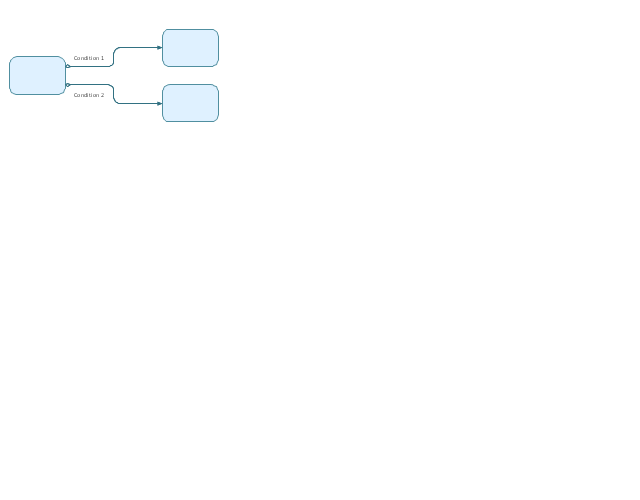
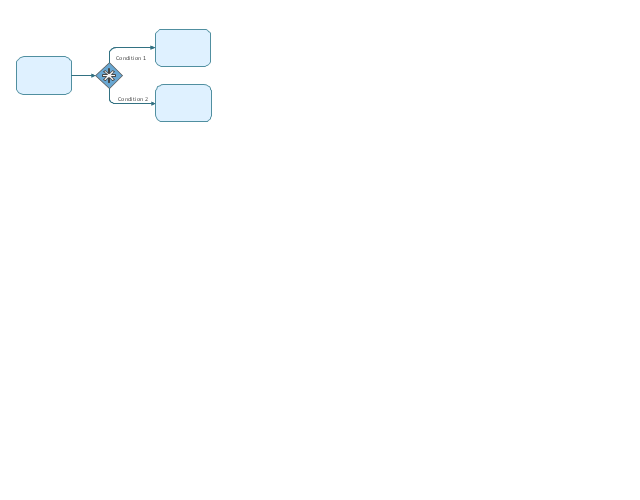
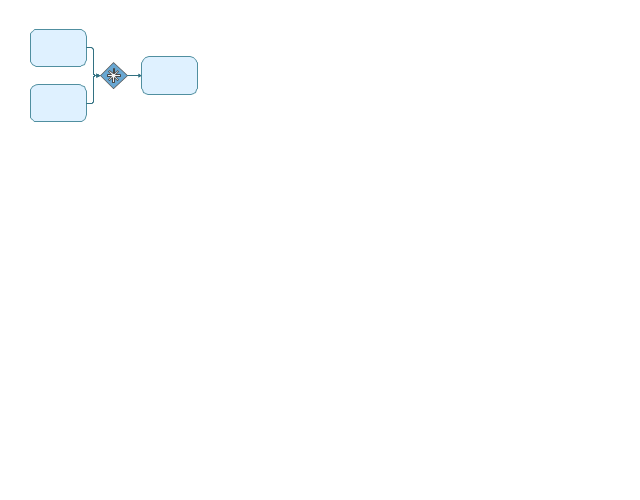
The vector stencils library "Gateways" contains 8 gateway symbols.
A Gateway is used to control the devergence and convergence of multiply Sequence Flow. In BPMN 2.0 diagrams the gateway shapes depict branching, forking, merging and joining of paths.
Use this library to draw BPMN 2.0 diagrams in the ConceptDraw PRO diagramming and vector drawing software extended with the Business Process Diagram solution from the Business Processes area of ConceptDraw Solution Park.
www.conceptdraw.com/ solution-park/ business-process-diagram
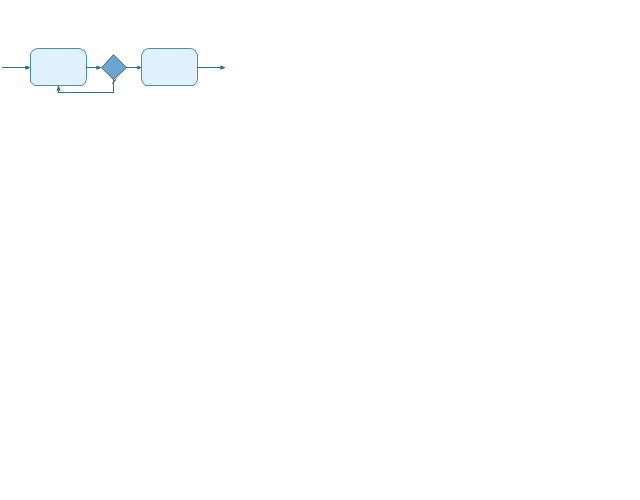
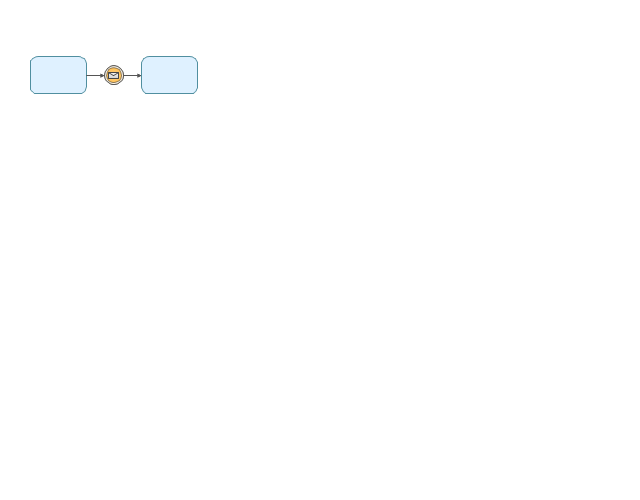
The vector stencils library "Gateways BPMN 1.2" contains 5 gateway symbols.
A Gateway is used to control the devergence and convergence of multiply Sequence Flow. Thus, it will determine branching, forking, merging and joining of paths.
Use this library for drawing the business process diagrams (BPMN 1.2) in the ConceptDraw PRO diagramming and vector drawing software extended with the Business Process Diagram solution from the Business Processes area of ConceptDraw Solution Park.
www.conceptdraw.com/ solution-park/ business-process-diagram
The vector stencils library "Gateways" contains 8 gateway symbols.
A Gateway is used to control the devergence and convergence of multiply Sequence Flow. In BPMN 2.0 diagrams the gateway shapes depict branching, forking, merging and joining of paths.
Use this library to draw BPMN 2.0 diagrams in the ConceptDraw PRO diagramming and vector drawing software extended with the Business Process Diagram solution from the Business Processes area of ConceptDraw Solution Park.
www.conceptdraw.com/ solution-park/ business-process-diagram
A Gateway is used to control the devergence and convergence of multiply Sequence Flow. In BPMN 2.0 diagrams the gateway shapes depict branching, forking, merging and joining of paths.
Use this library to draw BPMN 2.0 diagrams in the ConceptDraw PRO diagramming and vector drawing software extended with the Business Process Diagram solution from the Business Processes area of ConceptDraw Solution Park.
www.conceptdraw.com/ solution-park/ business-process-diagram
HelpDesk
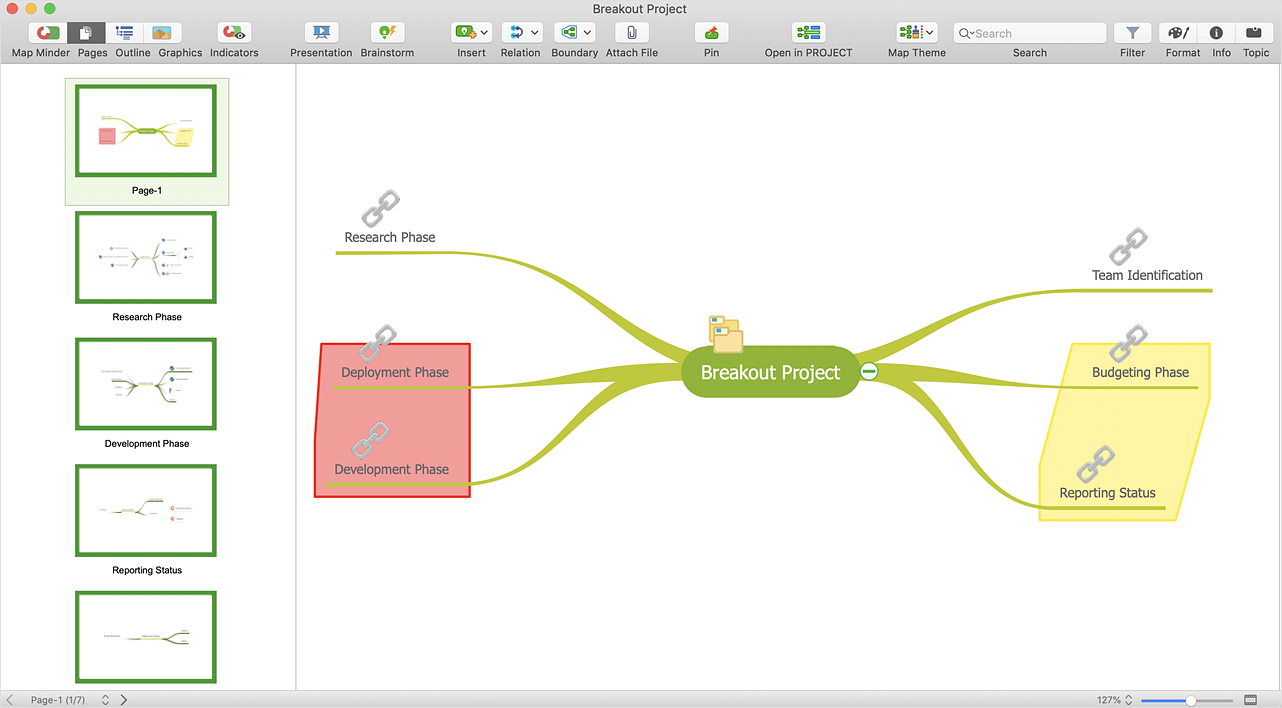
How to Split a Complex Map to a Few Simple Maps
When using ConceptDraw MINDMAP, you can move each main topic of a large complex mind map to a separate page. Here are the instructions on how to create a multiple page mind map from a solid map.Flow Diagram Software
The diagram is a convenient way of representing complex information and data in a simple, visual and comprehensive form. There are used many types of diagrams, each of them has its own fields of application. Flow diagram is a diagram that illustrates the flow or set of dynamic relationships in a system, visually depicts the structure of the elements in a complex system and their interactions. The term Flow diagram is also synonym for a Flowchart. Flow Diagrams are the perfect way to visually represent the structural data. ConceptDraw DIAGRAM extended with Flowcharts solution from the Diagrams area is a professional flow diagram software. The basic set of vector stencils libraries offered by Flowcharts solution, variety of samples and templates developed by specialists, and also advanced RapidDraw technology open before ConceptDraw users wide opportunities in representing the flow processes, in drawing Flow Diagrams and Flowcharts of any type and complexity. Easy tools of exporting to different graphical formats give the possibility of further successful use the diagrams.Pie Chart Software
A pie chart is a circular diagram showing a set of data divided into proportional slices. There are several variations of this chart such as donut chart, exploded pie chart, multi-level pie charts. Although it is not very informative when a ring chart or circle chart has many sections, so choosing a low number of data points is quite important for a useful pie chart. ConceptDraw DIAGRAM software with Pie Charts solution helps to create pie and donut charts for effective displaying proportions in statistics, business and mass media for composition comparison, i.e. for visualization of part percentage inside one total.Flowcharting Software
A flowchart is a useful type of diagram quite popular in many areas of science and business, which represents some algorithm, workflow or process. ConceptDraw DIAGRAM diagramming and vector graphic software extended with Flowcharts solution from the "Diagrams" area of ConceptDraw Solution Park is also ideal flowcharting software with powerful tools that assist in easily making the Flowcharts of different types and directions, in representing the flowchart steps and describing the flowchart processes, in realizing the flowchart constructions, creating the process flow models, designing the data flow diagrams, and many other flowcharting related diagrams. ConceptDraw DIAGRAM software maximally facilitates the drawing process by means of included predesigned vector objects, which only need to be dragged to your ConceptDraw document from the corresponding library and connected with smart connectors. This way lets equally easy make the simple flowcharts, as well as flowcharts of complex processes and procedures.Concept Maps
As concept map consists from conception-blocks and links between them, you can use ConceptDraw library objects and add to a document as much objects as you need. ConceptDraw tools let you to edit, group, move objects, change their appearance and add text signs and raster or vector pictures. ConceptDraw DIAGRAM diagramming and vector drawing software extended with Concept Maps Solution from the "Diagrams" Area is effective tool for creating professional looking Concept Maps.Pyramid Diagram and Pyramid Chart
Pyramid Diagram, Triangle Chart or Triangular Diagram is a convenient and useful type of diagrams, which lets represent the data hierarchical structure and to illustrate the foundation-based relationships between the hierarchy levels. Pyramid Diagrams are used to visualize effectively the hierarchical, as well as proportional and foundation-based relationships, the process steps, the interconnections of organizational layers or topics. ConceptDraw DIAGRAM software enhanced with Pyramid Diagrams solution from Marketing area of ConceptDraw Solution Park is a powerful business charting software, that includes all required tools for designing the multilevel Pyramid Diagrams as quickly as possible. The build-in vector stencils and templates are the great aid for designers, a variety of examples and samples is a good base and source of inspiration. Use attractive and vivid 2D and 3D Pyramid Diagrams and Triangle Charts designed in ConceptDraw DIAGRAM to illustrate your documents, presentations, infographics, articles, reports, websites, etc.Process Flow app for macOS
Use ConceptDraw DIAGRAM diagramming and business graphics software to draw your own flowcharts of computer algorithms.Chart Software for Better Presentations
Easy charting software comes with beautiful chart templates and examples. This makes it easy to create professional charts without prior experience. Graphs and Charts Area provide a wide collection of professional looking predesigned templates, samples and ready-to-use vector stencils that will help you to draw the charts and diagrams of various types: Pie Charts, Donut Charts, Line Charts, Column Charts, Bar Charts, Pyramids, Scatter Charts, Venn Diagrams, Spider Charts, Area Charts, Divided Bar Graphs.Polar Graph
This sample shows the Polar Graph. The Polar Graph is a graph in the polar coordinate system in which the each point on the plane is defined by two values - the polar angle and the polar radius. The certain equations have very complex graphs in the Cartesian coordinates, but the application of the polar coordinate system allows usually produce the simple Polar Graphs for these equations.Steps in the Accounting Process
Steps in the Accounting Process - The Accounting Process is a sequence of organization activities that is used for gaining quantitative information about the finances. This complex process consists of a set of sequential steps. 9 steps in the accounting process: Analysis of Business Transactions, Make Journal Entries, Post to Ledger Accounts, Prepare Trial Balance, Make Adjusting Entries, Adjusted Trial Balance, Prepare Financial Statements, Close Accounts, Post-Closing Trial Balance.Flowchart Components
The ConceptDraw Flowchart component includes a set of samples and templates. This geathered as flowchart maker toolbox which focused on drawing flowcharts of any industry standards.Easy Flowchart Software
ConceptDraw the best professional flowchart software that gives users the ability to simply draw any type of flowcharts.- Modelling Complex Events with Event-Driven Process chain | Flow ...
- Use a Fishbone Diagram to Attack Complex Problems | Modelling ...
- Seven Management and Planning Tools | Modelling Complex ...
- Use a Fishbone Diagram to Attack Complex Problems | Seven ...
- The Best Tool for Business Process Modeling | Modelling Complex ...
- Business Productivity Diagramming | Uses Of Fishbone Diagram
- Use a Fishbone Diagram to Attack Complex Problems | Business ...
- Event-driven Process Chain Diagrams EPC | Modelling Complex ...
- Fishbone Diagram | Business Productivity Diagramming | Use a ...
- Use a Fishbone Diagram to Attack Complex Problems | Fishbone ...
- Business Productivity Diagramming | Use a Fishbone Diagram to ...
- Complex decision - Conceptdraw.com
- Complex merge
- EPC for Configuring an Enterprise Resource Planning | Modelling ...
- Complex Gateway - Conceptdraw.com
- Complex
- How to Use Critical Path Analysis for Scheduling Complex Projects ...
- Cisco Network Diagrams | Sport Field Plans | Universal ...
- Modelling Complex Events with Event-Driven Process chain ...
- Complex Critical Path Method


---multiple-outgoing-sequence-flow-expanded-objects-bpmn-1.2---vector-stencils-library.png--diagram-flowchart-example.png)
---parallel-gateway-expanded-objects-bpmn-1.2---vector-stencils-library.png--diagram-flowchart-example.png)
-expanded-objects-bpmn-1.2---vector-stencils-library.png--diagram-flowchart-example.png)

-expanded-objects-bpmn-1.2---vector-stencils-library.png--diagram-flowchart-example.png)





,-data-based-gateways-bpmn-1.2---vector-stencils-library.png--diagram-flowchart-example.png)
,-event-based-gateways-bpmn-1.2---vector-stencils-library.png--diagram-flowchart-example.png)
-gateways-bpmn-1.2---vector-stencils-library.png--diagram-flowchart-example.png)

-gateways-bpmn-1.2---vector-stencils-library.png--diagram-flowchart-example.png)
