UML Deployment Diagram. Design Elements
UML Deployment diagram describes the hardware used in system implementations and the execution environments and artifacts deployed on the hardware. ConceptDraw has 393 vector stencils in the 13 libraries that helps you to start using software for designing your own UML Diagrams. You can use the appropriate stencils of UML notation from UML Deployment library.UML Timing Diagram, Design Elements
UML Timing Diagram as special form of a sequence diagram are used to explore the behaviors of objects throughout a given period of time. ConceptDraw has 393 vector stencils in the 13 libraries that helps you to start using software for designing your own UML Diagrams. You can use the appropriate stencils of UML notation from UML Timing library.The vector stencils library "Bank UML deployment diagram" contains 10 shapes for drawing UML deployment diagrams.
Use it for object-oriented modeling of your bank information system.
"A deployment diagram in the Unified Modeling Language models the physical deployment of artifacts on nodes. To describe a web site, for example, a deployment diagram would show what hardware components ("nodes") exist (e.g., a web server, an application server, and a database server), what software components ("artifacts") run on each node (e.g., web application, database), and how the different pieces are connected (e.g. JDBC, REST, RMI).
The nodes appear as boxes, and the artifacts allocated to each node appear as rectangles within the boxes. Nodes may have subnodes, which appear as nested boxes. A single node in a deployment diagram may conceptually represent multiple physical nodes, such as a cluster of database servers.
There are two types of Nodes:
1. Device Node.
2. Execution Environment Node.
Device nodes are physical computing resources with processing memory and services to execute software, such as typical computers or mobile phones. An execution environment node (EEN) is a software computing resource that runs within an outer node and which itself provides a service to host and execute other executable software elements." [Deployment diagram. Wikipedia]
This example of UML deployment diagram symbols for the ConceptDraw PRO diagramming and vector drawing software is included in the ATM UML Diagrams solution from the Software Development area of ConceptDraw Solution Park.
Campus Area Networks (CAN). Computer and Network Examples
Campus Area Network (CAN) is a computer network which provides wireless access to the Internet or LAN for the users located in two or more buildings on the limited geographical area, or in the open space surrounding these buildings. Campus Area Network is usually set in campus of a university or college, but the same kind of planning and design can be applied for other purposes, for enterprises, office buildings, military bases, industrial complexes, public places like supermarkets, entertainment centers, etc. Another form of temporary CAN can exist during some special events such as rallies, music festivals. The elementary Campus Area Network can also arise spontaneously, due to the distance of spread the radio signals from the access points that are not limited by buildings walls. It is also sensible to have additional access points for the larger and more complex CANs, located at specially places chosen for serving clients. Design easy diagrams and schemes for the Campus Area Networks with Computer Network Diagrams solution for ConceptDraw DIAGRAM.Cloud Computing Architecture Diagrams
For documenting the Cloud Computing Architecture with a goal to facilitate the communication between stakeholders are successfully used the Cloud Computing Architecture diagrams. It is convenient and easy to draw various Cloud Computing Architecture diagrams in ConceptDraw DIAGRAM software with help of tools of the Cloud Computing Diagrams Solution from the Computer and Networks Area of ConceptDraw Solution Park.
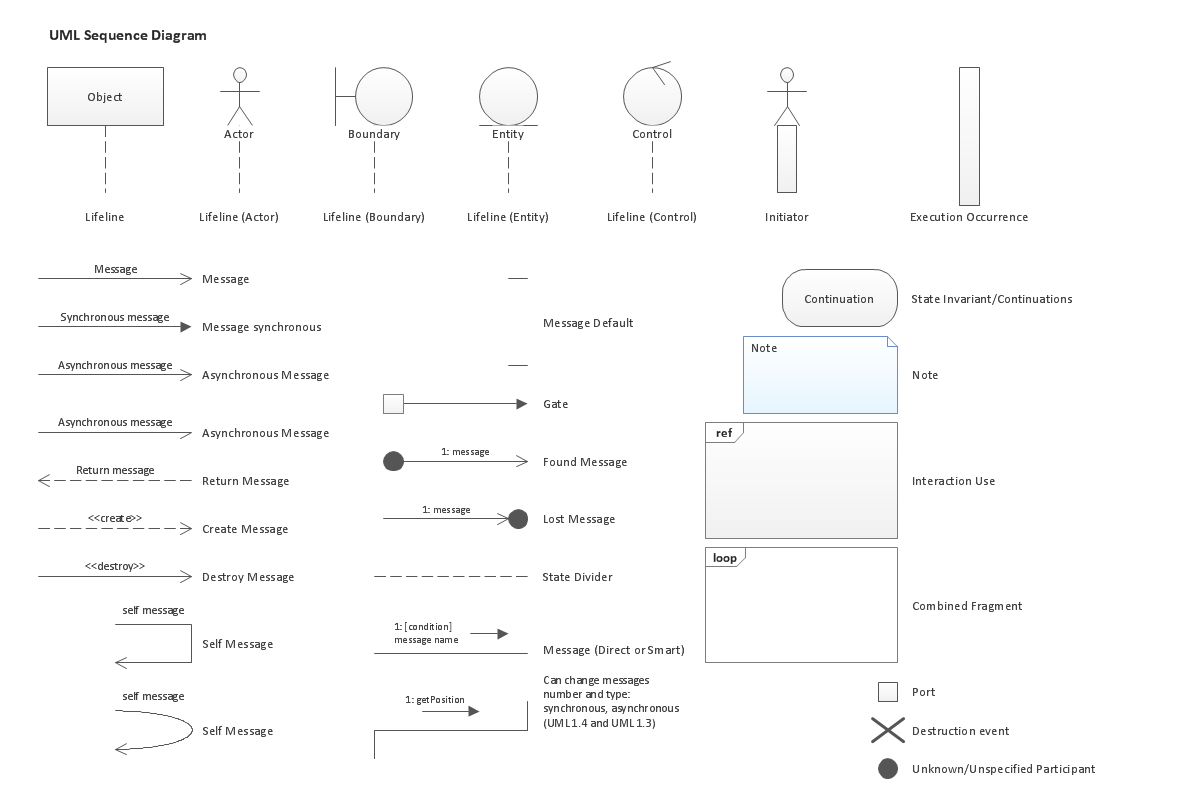
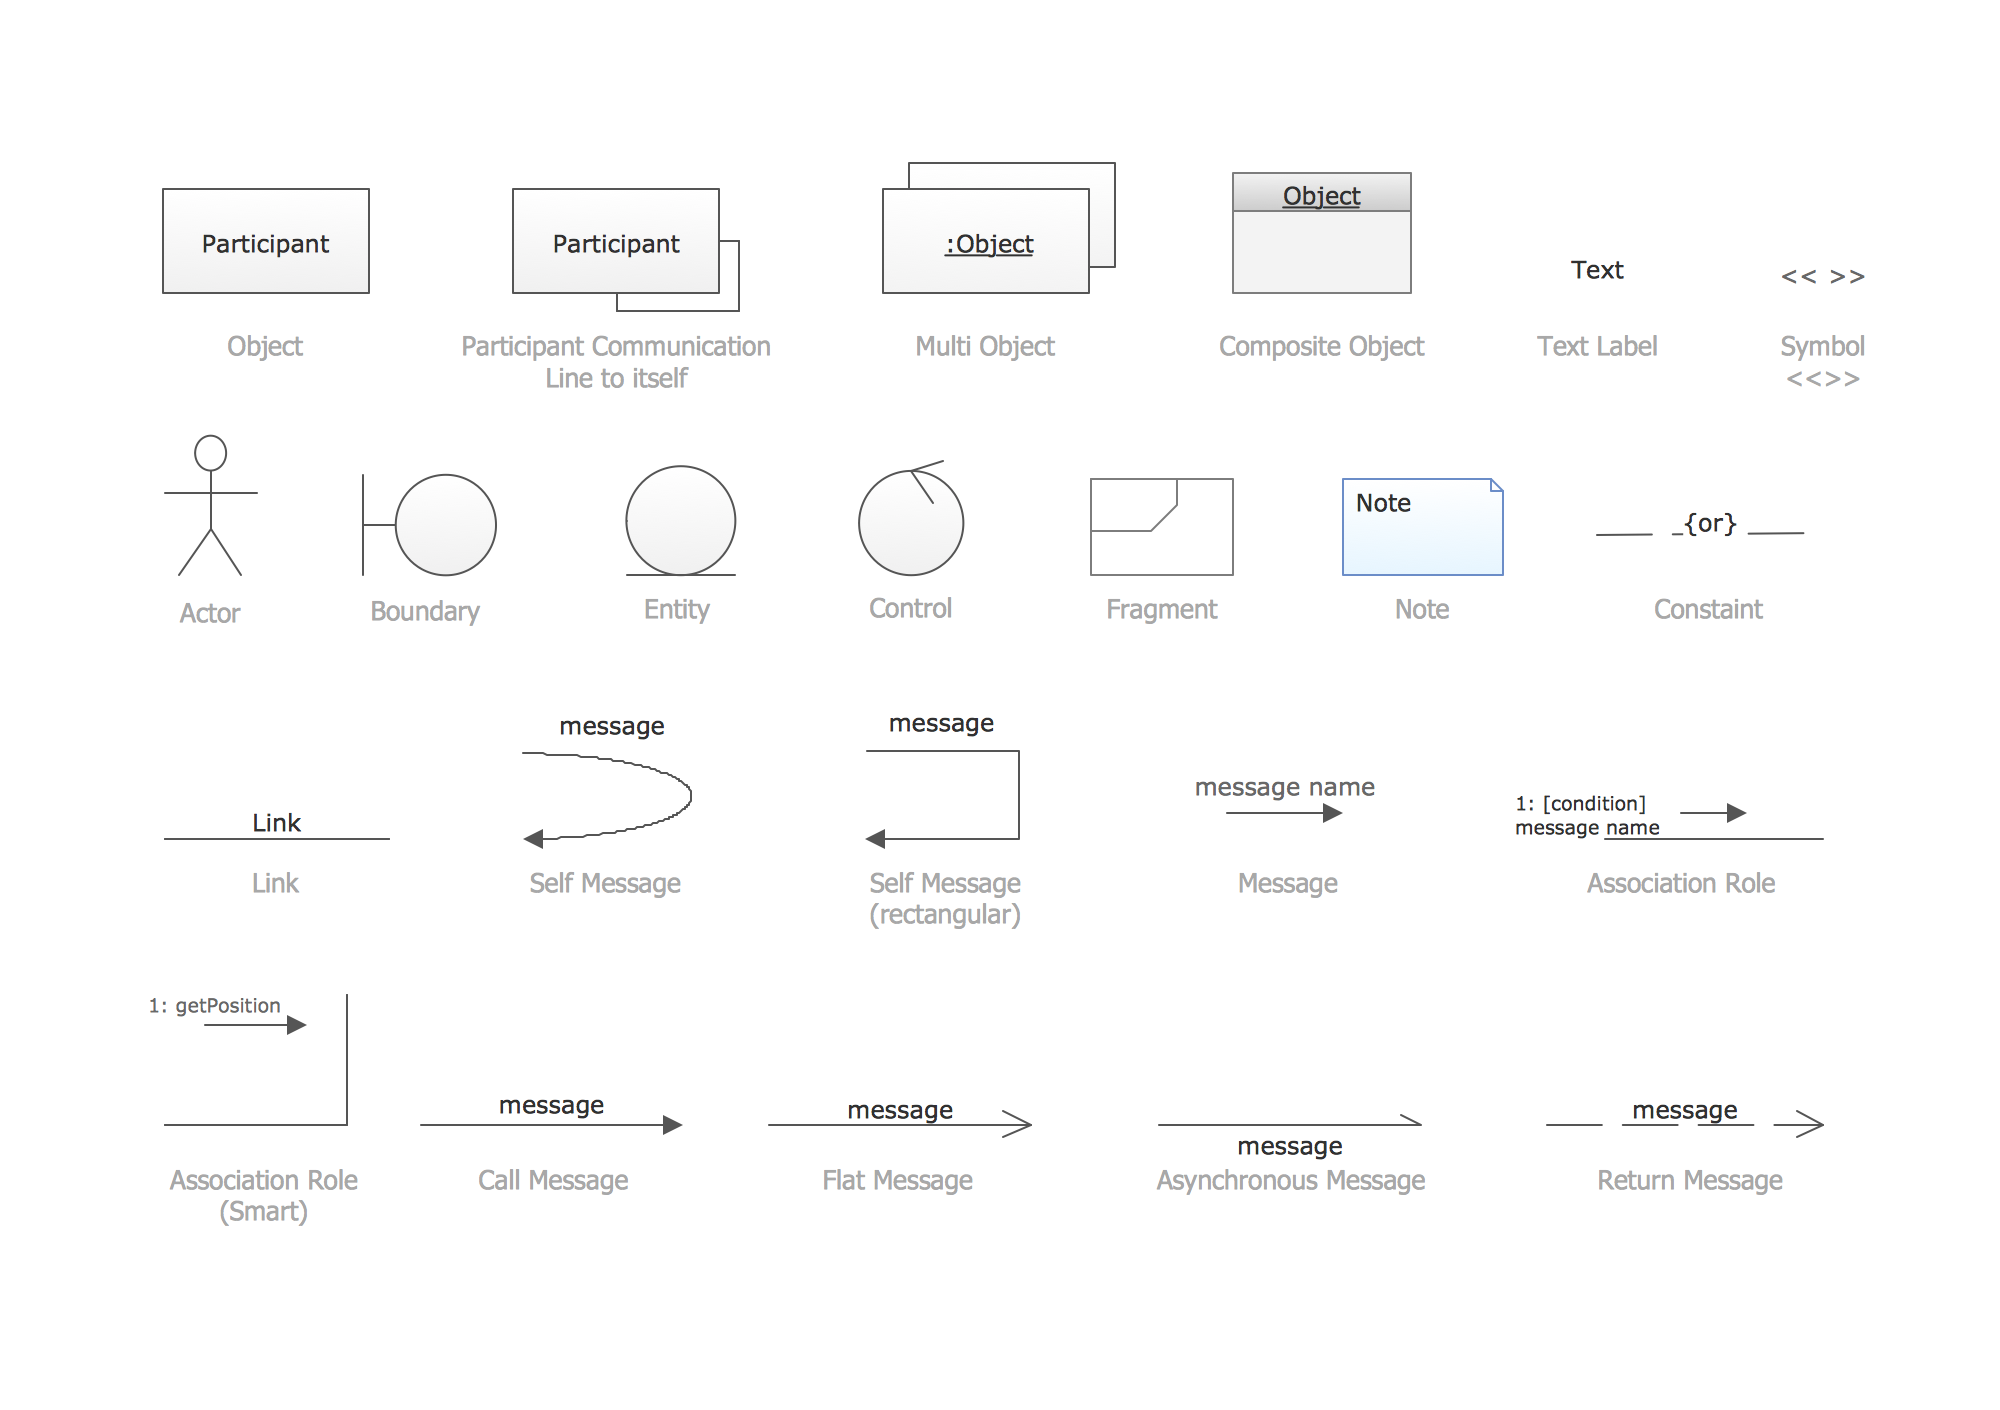
UML Sequence Diagram. Design Elements
UML Sequence Diagram shows object interactions arranged in time sequence, how processes operate with one another and in what order and illustrate the sequence of messages exchanged between the objects and classes involved in the scenario.Components of ER Diagram
Entity-Relationship model gives the possibility to visually describe a database using the components of ER Diagram, entity relationship stencils, relationship symbols, work flow shapes. ER-diagram lets represent the data or entities, attributes of these entities and relationships between them, using standardized Crow’s Foot notation icons or Chen’s notation icons. An entity is an object of the real world, it can exist independently and has the instances which differ in attribute values (properties). The attributes give an unambiguous (uniquely) identification for the instance and are called the primary key, this key can be composite and combine several attributes. ConceptDraw DIAGRAM is a professional software available with Entity-Relationship Diagram (ERD) solution from Software Development area that lets create ERDs for various database systems, using Crow’s Foot and Chen’s notations. It is invaluable tool for software engineers and developers, it supports ODBC-compatible databases (Oracle, MySQL, MS Access, MS SQL, InterBase, Firebird and others).About UML
Use Case Diagram Taxi Service UML. This sample was created in ConceptDraw DIAGRAM diagramming and vector drawing software using the UML Use Case Diagram library of the Rapid UML Solution from the Software Development area of ConceptDraw Solution Park. This sample shows the work of the taxi service and is used by taxi stations, by airports, in the tourism field and delivery service.UML Collaboration Diagram. Design Elements
UML Collaboration Diagram illustrates how components are wired together to larger components and software systems that shows the structure of arbitrarily complex systems. ConceptDraw has 393 vector stencils in the 13 libraries that helps you to start using software for designing your own UML Diagrams. You can use the appropriate stencils of UML notation from UML Collaboration library with 36 objectsUML Composite Structure Diagram. Design Elements
UML Composite Structure Diagram shows the internal structure of a class and the possible interactions at this structure. ConceptDraw has 393 vector stencils in the 13 libraries that helps you to start using software for designing your own UML Diagrams. You can use the appropriate stencils of UML notation from UML Composite Structure library.- Draw A Diagram Of The Major Components Of Environment
- Draw The Components Of Environment
- Draw A Flowchart Of Component Of Environment With Picture
- Show The Component Of Environment Through Flow Chart
- Chart Of Diagram Of Components Of Environment
- Draw Diagram To Show Components Of Environment
- Design elements - Bank UML deployment diagram | UML ...
- Draw A Chart On Components Of Environment
- How to Draw Business Process Diagrams with RapidDraw Interface ...
- Draw The Diagram Of The Components Of The Environment With