 Computer and Networks Area
The solutions from Computer and Networks Area of ConceptDraw Solution Park collect samples, templates and vector stencils libraries for drawing computer and network diagrams, schemes and technical drawings.
 Manufacturing and Maintenance
Manufacturing and maintenance solution extends ConceptDraw DIAGRAM software with illustration samples, templates and vector stencils libraries with clip art of packaging systems, industrial vehicles, tools, resources and energy.
Data structure diagram with ConceptDraw DIAGRAM
Data structure diagram (DSD) is intended for description of conceptual models of data (concepts and connections between them) in the graphic format for more obviousness. Data structure diagram includes entities description, connections between them and obligatory conditions and requirements which connect them. Create Data structure diagram with ConceptDraw DIAGRAM.
 Basic Diagramming
This solution extends ConceptDraw DIAGRAM software with the specific tools you need to easily draw flowcharts, block diagrams, histograms, pie charts, divided bar diagrams, line graphs, circular arrows diagrams, Venn diagrams, bubble diagrams and concept maps
Bubble diagrams in Landscape Design with ConceptDraw DIAGRAM
Bubble Diagrams are the charts with a bubble presentation of data with obligatory consideration of bubble's sizes. They are analogs of Mind Maps and find their application at many fields, and even in landscape design. At this case the bubbles are applied to illustrate the arrangement of different areas of future landscape design, such as lawns, flowerbeds, playgrounds, pools, recreation areas, etc. Bubble Diagram helps to see instantly the whole project, it is easy for design and quite informative, in most cases it reflects all needed information. Often Bubble Diagram is used as a draft for the future landscape project, on the first stage of its design, and in case of approval of chosen design concept is created advanced detailed landscape plan with specification of plants and used materials. Creation of Bubble Diagrams for landscape in ConceptDraw DIAGRAM software is an easy task thanks to the Bubble Diagrams solution from "Diagrams" area. You can use the ready scanned location plan as the base or create it easy using the special ConceptDraw libraries and templates.
 Software Development
This solution extends ConceptDraw DIAGRAM.4 and helps to accelerate and simplify software development and design by allowing you to draw UML diagrams and prototype Windows and Mac OS user interfaces.
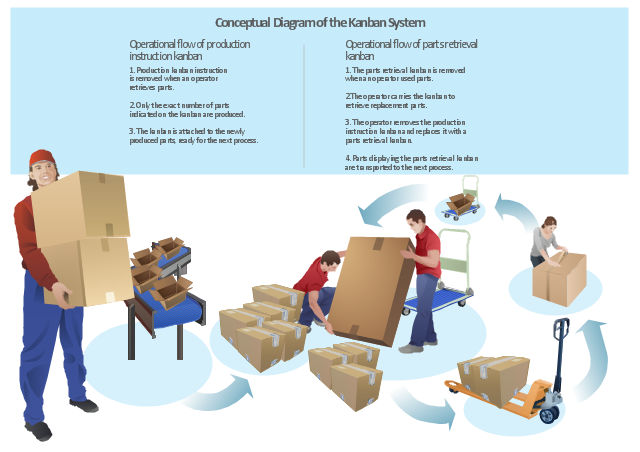
"Kanban ... (literally signboard or billboard) is a scheduling system for lean and just-in-time (JIT) production. Kanban is a system to control the logistical chain from a production point of view, and is not an inventory control system. Kanban was developed by Taiichi Ohno, at Toyota, to find a system to improve and maintain a high level of production. Kanban is one method through which JIT is achieved.
Kanban became an effective tool in support of running a production system as a whole, and it proved to be an excellent way for promoting improvement. Problem areas were highlighted by reducing the number of kanban in circulation." [Kanban. Wikipedia]
The example "Conceptual diagram of the Kanban System" was created in the ConceptDraw PRO diagramming and vector drawing software using the vector stencils library Packaging, loading, customs.
The example "Conceptual diagram of the Kanban System" is included in the Manufacturing and Maintenance solution from the Illustration area of ConceptDraw Solution Park.
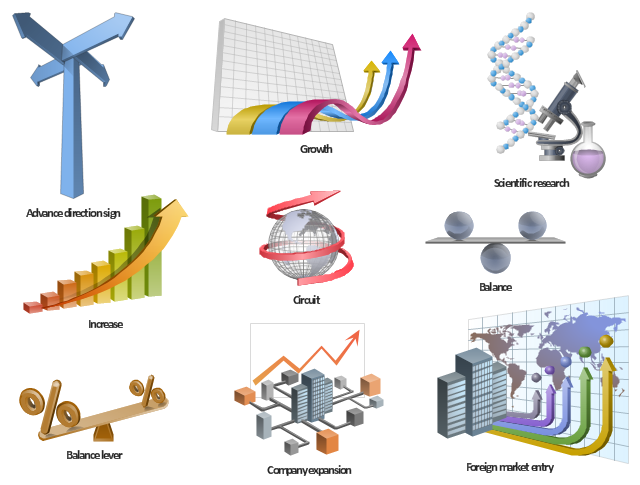
"In metaphysics, and especially ontology, a concept is a fundamental category of existence. In contemporary philosophy, there are at least three prevailing ways to understand what a concept is:
(1) Concepts as mental representations, where concepts are entities that exist in the brain.
(2) Concepts as abilities, where concepts are abilities peculiar to cognitive agents.
(3) Concepts as abstract objects, where objects are the constituents of propositions that mediate between thought, language, and referents." [Concept. Wikipedia]
The clipart example "Pictorial concepts" was created in the ConceptDraw PRO diagramming and vector drawing software using the Presentation Clipart solution from the Illustration area of ConceptDraw Solution Park.
 Computer Network Diagrams
Computer Network Diagrams solution extends ConceptDraw DIAGRAM software with samples, templates and libraries of vector icons and objects of computer network devices and network components to help you create professional-looking Computer Network Diagrams, to plan simple home networks and complex computer network configurations for large buildings, to represent their schemes in a comprehensible graphical view, to document computer networks configurations, to depict the interactions between network's components, the used protocols and topologies, to represent physical and logical network structures, to compare visually different topologies and to depict their combinations, to represent in details the network structure with help of schemes, to study and analyze the network configurations, to communicate effectively to engineers, stakeholders and end-users, to track network working and troubleshoot, if necessary.
IDEF1X Standard
Use Case Diagrams technology. IDEF1x standard - for work with relational data bases. IDEF1x standard is meant for constructing of conceptual schemes which represent the structure of data in the context of the concerned system, for example, a commercial organization.- Global network diagram template - Conceptdraw.com
- GUI Prototyping with ConceptDraw PRO | Windows Vista graphic ...
- graphic user interface (GUI)
- Global vehicular network diagram template | UML Class Diagram ...
- Business Process Diagram | Cooperative vehicular delay-tolerant ...
- How To Create CCTV Network Diagram | Basic CCTV System ...
- UML Class Diagram Example for Transport System
- Business and Finance | Office - Design Elements | Business People ...
- How to Draw a Computer Network Diagrams | Network diagrams ...
- Global network diagram template | Network Configuration | Mobile ...
- How To Create CCTV Network Diagram | Basic CCTV System ...
- Data Flow Diagrams
- Telecommunication Network Diagrams | Design Elements ...
- ConceptDraw PRO Network Diagram Tool | Computer Network of an ...
- How to Draw a Computer Network Diagrams | Computer network ...
- Business and Finance Illustrations Example ... - Conceptdraw.com
- How to Draw a Computer Network Diagrams | Interactive Voice ...
- UML Diagrams with ConceptDraw PRO | Diagramming Software for ...
- How to Draw a Computer Network Diagrams | Basic CCTV System ...
- Office - Design Elements | Business and Finance | Illustration Area |


