Basic Flowchart Symbols and Meaning
Flowcharts are the best for visually representation the business processes and the flow of a custom-order process through various departments within an organization. ConceptDraw PRO diagramming and vector drawing software extended with Flowcharts solution offers the full set of predesigned basic flowchart symbols which are gathered at two libraries: Flowchart and Flowcharts Rapid Draw. Among them are: process, terminator, decision, data, document, display, manual loop, and many other specific symbols. The meaning for each symbol offered by ConceptDraw gives the presentation about their proposed use in professional Flowcharts for business and technical processes, software algorithms, well-developed structures of web sites, Workflow diagrams, Process flow diagram and correlation in developing on-line instructional projects or business process system. Use of ready flow chart symbols in diagrams is incredibly useful - you need simply drag desired from the libraries to your document and arrange them in required order. There are a few serious alternatives to Visio for Mac, one of them is ConceptDraw PRO. It is one of the main contender with the most similar features and capabilities.
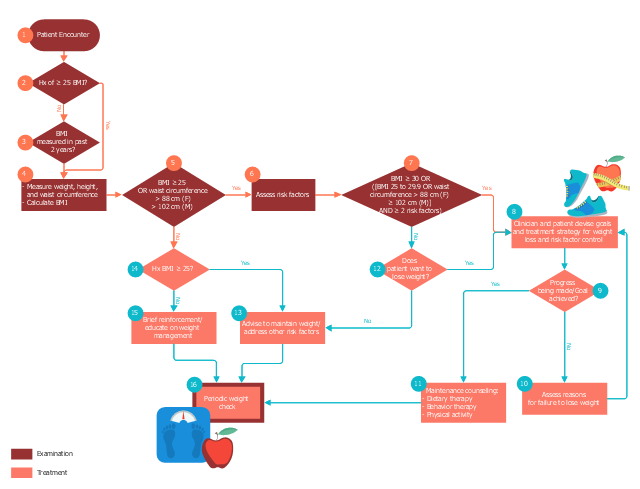
This medical flowchart sample shows assessment and treatment algorithm for overweight and obesity.
It was drawn on the base of Wikimedia Commons file: Assessment and treatment algorithm for overweight and obesity.png. [commons.wikimedia.org/ wiki/ File:Assessment_ and_ treatment_ algorithm_ for_ overweight_ and_ obesity.png]
"A medical algorithm is any computation, formula, statistical survey, nomogram, or look-up table, useful in healthcare. Medical algorithms include decision tree approaches to healthcare treatment (e.g., if symptoms A, B, and C are evident, then use treatment X) and also less clear-cut tools aimed at reducing or defining uncertainty." [Medical algorithm. Wikipedia]
The medical flow chart example "Assessment and treatment algorithm for overweight and obesity" was designed using ConceptDraw PRO software extended with Healthcare Workflow Diagrams solution from Business Processes area of ConceptDraw Solution Park.
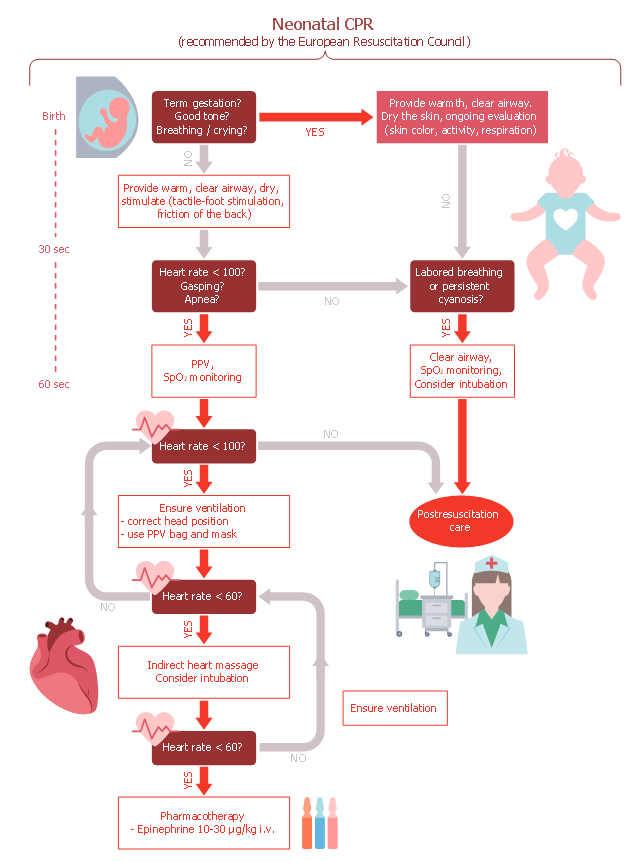
This medical algorithm flowchart sample depicts cardiopulmonary resuscitation (CPR) of newborn infants.
It was drawn on the base of Wikimedia Commons file: KPR novorozence.png. [commons.wikimedia.org/ wiki/ File:KPR_ novorozence.png]
This file is licensed under the Creative Commons Attribution 3.0 Unported license. [creativecommons.org/ licenses/ by/ 3.0/ deed.en]
"Cardiopulmonary resuscitation (CPR) is an emergency procedure that combines chest compressions often with artificial ventilation in an effort to manually preserve intact brain function until further measures are taken to restore spontaneous blood circulation and breathing in a person who is in cardiac arrest. It is recommended in those who are unresponsive with no breathing or abnormal breathing" [Cardiopulmonary resuscitation. Wikipedia]
The medical algorithm flow chart example "Cardiopulmonary resuscitation of newborn infants" was designed using ConceptDraw PRO software extended with Healthcare Workflow Diagrams solution from Business Processes area of ConceptDraw Solution Park.
Flow Chart Symbols
The Flowcharts are incredibly useful and popular tool used in science, business, software development, analytics, engineering, marketing, manufacturing, administration, architecture, government, politics, and many other fields thanks to a variety of existing types of flowcharts. A Flowchart is a visual graphical representation of the process, algorithm, or the set of steps taken for problem's solution. Widely used for designing, visualizing and documenting simple and complex processes and programs, they effectively help to understand the process and to find easier the flaws if they are. Each flowchart type supposes the use of its own set of notations for drawing corresponding diagram, which includes the symbols of process, decision, data, document, data base, termination, initiation processes, processing loops, conditions, etc. It is easily design a Flowchart using the special professional flowchart maker - ConceptDraw PRO diagram software with numerous predesigned flow chart symbols grouped in libraries of Flowcharts solution from ConceptDraw Solution Park.This medical algorithm flowchart sample depicts cardiopulmonary resuscitation (CPR) of newborn infants.
It was drawn on the base of Wikimedia Commons file: KPR novorozence.png. [commons.wikimedia.org/ wiki/ File:KPR_ novorozence.png]
This file is licensed under the Creative Commons Attribution 3.0 Unported license. [creativecommons.org/ licenses/ by/ 3.0/ deed.en]
"Cardiopulmonary resuscitation (CPR) is an emergency procedure that combines chest compressions often with artificial ventilation in an effort to manually preserve intact brain function until further measures are taken to restore spontaneous blood circulation and breathing in a person who is in cardiac arrest. It is recommended in those who are unresponsive with no breathing or abnormal breathing" [Cardiopulmonary resuscitation. Wikipedia]
The medical algorithm flow chart example "Cardiopulmonary resuscitation of newborn infants" was designed using ConceptDraw PRO software extended with Healthcare Workflow Diagrams solution from Business Processes area of ConceptDraw Solution Park.
"In mathematics, the Euclidean algorithm, or Euclid's algorithm, is a method for computing the greatest common divisor (GCD) of two (usually positive) integers, also known as the greatest common factor (GCF) or highest common factor (HCF). ...
The GCD of two positive integers is the largest integer that divides both of them without leaving a remainder (the GCD of two integers in general is defined in a more subtle way).
In its simplest form, Euclid's algorithm starts with a pair of positive integers, and forms a new pair that consists of the smaller number and the difference between the larger and smaller numbers. The process repeats until the numbers in the pair are equal. That number then is the greatest common divisor of the original pair of integers.
The main principle is that the GCD does not change if the smaller number is subtracted from the larger number. ... Since the larger of the two numbers is reduced, repeating this process gives successively smaller numbers, so this repetition will necessarily stop sooner or later - when the numbers are equal (if the process is attempted once more, one of the numbers will become 0)." [Euclidean algorithm. Wikipedia]
The flowchart example "Euclidean algorithm" was created using the ConceptDraw PRO diagramming and vector drawing software extended with the Mathematics solution from the Science and Education area of ConceptDraw Solution Park.
Data Flow Diagram Symbols. DFD Library
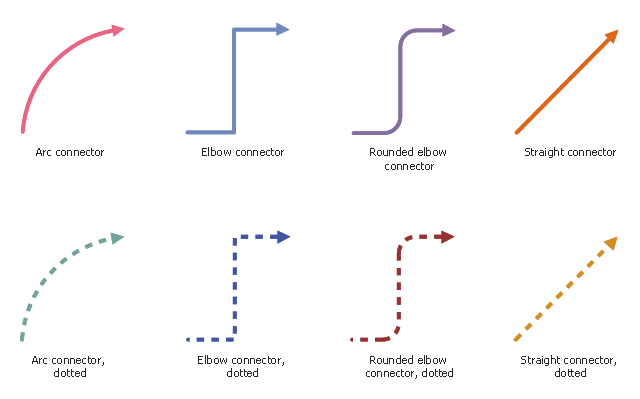
Data Flow Diagrams graphically represent the information transfers and process steps of a system. They visually depict how data are processed by a system in terms of inputs and outputs, how occurs the input in a system, how the data flow through an information system and where they are stored, and how occurs output from the system. DFDs give the overview of the system and models the processes aspects, they are maintained with other methods of structured systems analysis. The main goal of DFDs is achievement of understanding between developers and users. For their construction are used two notations - Gane-Sarson and Yourdon, each of them uses its own set of symbols. Data Flow Diagrams solution from Software Development area extends the ConceptDraw PRO software with templates, samples, and predesigned libraries of data flow diagram symbols for both notations, allowing you easy design the process-oriented and data-oriented models, draw the Data Flow Diagrams, Data Flowcharts, Data Process Diagrams, Information Flow Diagrams, Structured Analysis Diagrams, etc.The vector stencils library "Workflow connectors" contains 8 flow lines.
Use it to design your business process workflow diagrams with ConceptDraw PRO software.
"A flowchart is a type of diagram that represents an algorithm, workflow or process, showing the steps as boxes of various kinds, and their order by connecting them with arrows. ...
Flow Line ... An arrow coming from one symbol and ending at another symbol represents that control passes to the symbol the arrow points to. The line for the arrow can be solid or dashed. The meaning of the arrow with dashed line may differ from one flowchart to another and can be defined in the legend." [Flowchart. Wikipedia]
The flowchart arrows example "Design elements - Workflow connectors" is included in the Business Process Workflow Diagrams solution from the Business Processes area of ConceptDraw Solution Park.
Types of Flowcharts
A Flowchart is a graphical representation of process, algorithm, workflow or step-by-step solution of the problem. It shows the steps as boxes of various kinds and connects them by arrows in a defined order depicting a flow. There are twelve main Flowchart types: Basic Flowchart, Business Process Modeling Diagram (BPMN), Cross Functional Flowchart, Data Flow Diagram (DFD), IDEF (Integrated DEFinition) Flowchart, Event-driven Process Chain (EPC) Diagram, Influence Diagram (ID), Swimlane Flowchart, Process Flow Diagram (PFD), Specification and Description Language (SDL) Diagram, Value Stream Mapping, Workflow Diagram. Using the Flowcharts solution from the Diagrams area of ConceptDraw Solution Park you can easy and quickly design a Flowchart of any of these types. This solution offers a lot of special predesigned vector symbols for each of these widely used notations. They will make the drawing process of Flowcharts much easier than ever. Pay also attention for the included collection of ready Flowchart examples, samples and quick-start templates. This is business process improvement tools. If you are looking for MS Visio for your Mac, then you are out of luck, because it hasn't been released yet. However, you can use Visio alternatives that can successfully replace its functions. ConceptDraw PRO is an alternative to MS Visio for Mac that provides powerful features and intuitive user interface for the same.
How to Build a Flowchart
The ConceptDraw PRO is a professional software for quick creating great looking flowcharts. The vector stencils from object libraries allows you to use RapidDraw technology. By the clicking on direction arrows one can add new object to flowcharts. This technology gives to users the ability to fast creating visualization for the structural data. Learn the basics of flowcharting and see how to build create a flowchart using ConceptDraw automatic drawing tools.- Design elements - Workflow connectors | Flow Chart And Algorithm ...
- Assessment and treatment algorithm for overweight and obesity
- Euclidean algorithm - Flowchart | Basic Flowchart Symbols and ...
- Cardiopulmonary resuscitation of newborn infants
- Basic Flowchart Symbols and Meaning | Mcq On Algorithms And ...
- Flowchart Symbols Off Page Connector
- Algorithm And Flow Chart Of Straight Line
- Algorithm Flowchart Download Free Draw
- Solving quadratic equation algorithm - Flowchart | Mathematics ...
- | Flow Chart Online | Flowchart Program Mac | Algorithm Creator


