This site uses cookies. By continuing to browse the ConceptDraw site you are agreeing to our Use of Site Cookies.
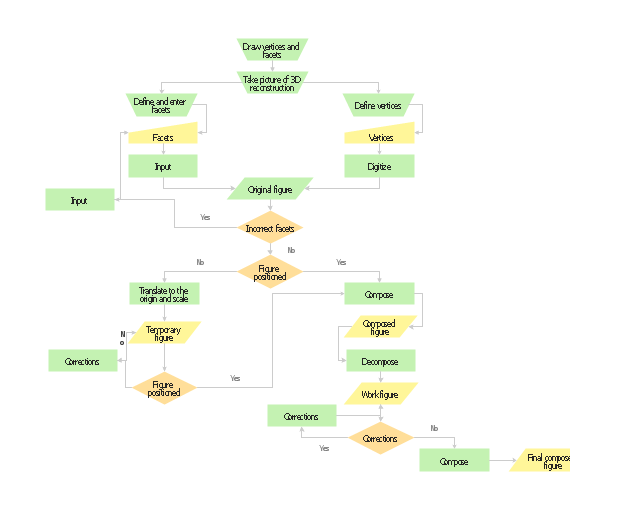
Planning scheme for the construction of a synthetic object.
"Computer-generated imagery (CGI) ... is the application of computer graphics to create or contribute to images in art, printed media, video games, films, television programs, commercials, and simulators. The visual scenes may be dynamic or static, and may be two-dimensional (2D), though the term "CGI" is most commonly used to refer to 3D computer graphics used for creating scenes or special effects in films and television." [Computer-generated imagery. Wikipedia]
The flow chart example "Synthetic object construction" was created using the ConceptDraw PRO diagramming and vector drawing software extended with the Flowcharts solution from the area "What is a Diagram" of ConceptDraw Solution Park.
Flowchart - Synthetic object construction
Flowchart - Synthetic object construction, process, manual operation, manual input, decision, data,
Used Solutions

Flowchart Design
Flowchart Symbols, Shapes, Stencils and Icons

A flowchart is a type of diagram which represents an algorithm, process or workflow, displays the steps as boxes of various kinds and depicts their order by connecting them with arrows. Any business graphic document will be more colorful and understandable if will use professional-looking and visual diagrams and flowcharts. Flowchart design gives versatile presenting and explaining of the process. ConceptDraw DIAGRAM flowchart software enhanced with Flowcharts solution helps effectively make Flowchart Design. Use of predesigned flowchart symbols and bright color palette offers a fresh view and favorably distinguishes the flowcharts designed in ConceptDraw DIAGRAM from the black and white flowcharts on a paper. Preferably to use no more than three or four colors and apply identical for the same shape types. The best flowchart design can be achieved by starting with Flowchart template, or any of suitable ready examples or samples offered in ConceptDraw STORE, open one of them and enter the proper text into each Flowchart shape. Each symbol of the flowchart has a definition that can't be changed. This means that all flowcharts shapes can be grouped in according to their meaning. Users with ConceptDraw DIAGRAM flowchart software can style groups of symbols with close definitions by color sets chosen from complementary palette. Almost all workflows can be depicted as a flowchart. Colored diagrams are more light for perception of the certain information, this is part of flowchart design. Bright colors need to be used in the key points of Decision symbols, to focus attention on their importance for whole process flow.
Business Process Modeling with ConceptDraw

Examples of Flowchart Diagram

ConceptDraw - feature-rich flowchart software. This software includes flowchart diagram examples set. Libraries contain vector stencils that allow users to use RapidDraw technology. Users can start draw their own flowchart diagrams from existing examples by clicking on direction arrows.

Flowcharts

We have a lot of samples of flowchart diagrams for your needs.
This example of business infographics was designed on the base of flowchart in the webpage "Establishing Operations in an Environmental Protection Park" from the website of Taiwan Department of Investment Services, Ministry of Economic Affairs.
"Upon registration of the company, the "Guideline for Operation and Management of Environmental Science and Technology Park Promotion Program" and "Guideline for Execution of Subsidies for Environmental Science and Technology Park Promotion Program" shall be followed for applying for admission to the Park. Any foreigner who wishes to invest in and build a factory in the Park shall apply to the local Preparatory Office of ESTP for admission approval. It will take approximately two months to secure such approval from the application submission date. The investment and construction application procedures prescribed by preparatory Office of ESTP in Southern Taiwan are shown below for reference." [investtaiwan.nat.gov.tw/ eng/ show.jsp?ID=123&MID=2]
The infographics example "Investment and construction application procedures" was created using the ConceptDraw PRO diagramming and vector drawing software extended with the HR Flowcharts solution from the Management area of ConceptDraw Solution Park.
Flowchart infographics
Flowchart infographics, сapital formation, start, right arrow, presentation, person specification, pay, partnership, packaging, merging arrows, leave, vacation, holiday, interview, job interview, event, engineer, profession icon, disciplinary procedures, checklist, career center, bent arrow, arrow fork, architect, profession icon, arc arrow, appraisal, angle arrow, accounting, accept,

Basic Diagramming

Create flowcharts, org charts, shipping flowcharts, floor plans, business diagrams and more with ConceptDraw. Includes 1000s of professional-looking business templates that you can modify and make your own.

Kitchen Planning Software

The kitchen is one of the important places of the house, and so the kitchen planning is a very responsible moment. The kitchen must be comfortable, convenient, harmonious and aesthetic. ConceptDraw DIAGRAM diagramming and vector drawing software offers the Floor Plans Solution from the Building Plans area of ConceptDraw Solution Park to help you create professional looking Kitchen Plans of any complexity.

3 Circle Venn. Venn Diagram Example

This example shows the 3 Circle Venn Diagram. The Venn Diagrams visualize all possible logical intersections between several sets. On this example you can see the intersections of 3 sets. Venn Diagrams are widely used in mathematics, logic, statistics, marketing, sociology, etc.

Construction Project Chart Examples

ConceptDraw PROJECT provides a set of construction Gantt chart examples. Project manager requires task tracking, and project examples best approach to start. Make your project applying one of our ready-made examples.

Technical Flow Chart Example

What illustrates a technical flow chart? Technical flow chart is a diagrammatic representation which visually illustrates the sequence of operations that must to be performed to get the problem's solution. ConceptDraw DIAGRAM enhanced with Flowcharts Solution from the "Diagrams" Area of ConceptDraw Solution is a perfect software for drawing Technical Flow Chart Example illustrating the essence and importance of the technical flow chart use.

How to Build a Flowchart

The ConceptDraw DIAGRAM is a professional software for quick creating great looking flowcharts. The vector stencils from object libraries allows you to use RapidDraw technology. By the clicking on direction arrows one can add new object to flowcharts. This technology gives to users the ability to fast creating visualization for the structural data. Learn the basics of flowcharting and see how to build create a flowchart using ConceptDraw automatic drawing tools.

Why Flowchart Important to Accounting Information System?

The Accounting flowchart shows how information flows from source documents through the accounting records. The are based on the accounting procedures or processes. Flowcharts are used to represent accounting information in a system. There are special symbols which are used to create accounting flowcharts. Try conceptdraw flowcharting set of symbols to draw a professional charts.

Diagramming Software for Design UML Timing Diagrams

UML Timing Diagram as special form of a sequence diagram are used to explore the behaviors of objects throughout a given period of time.

Management - Design Elements

When you need to draw a professional management drawing, these management design elements, samples, templates and libraries with vector clip art for drawing the Marketing Illustrations. Conceptdraw symbols and signs you can use in your design for Strategic Management, Graphic Design, Planning implementation and more. You can create and view impact analysis drawings from specific design elements to examine the tasks.

Process Flow Chart Symbols

Process Flow Chart is a visual diagram which shows the processes and relationships between the major components in a system, and uses for this the special process flow chart symbols: special shapes to represent different types of actions and process steps, lines and arrows to represent relationships and sequence of steps. It often named process flow diagram, it use colored flowchart symbols. It is incredibly convenient to use the ConceptDraw DIAGRAM software extended with Flowcharts Solution from the "Diagrams" Area of ConceptDraw Solution Park for designing professional looking Process Flow Charts.

Diagramming software for Amazon Web Service diagrams, charts and schemes

Professional software: visualize general system architecture, AWS diagrams are part of architecturing tools provided with ConceptDraw Solution Park.

Diagramming software for Amazon Web Service icon set: Data Base

DataBase icons - Amazon AWS pro diagrams - AWS diagrams are part of architecturing tools provided with ConceptDraw Solution Park.

HR Flowchart Symbols

Human resources are the people who make up the employee workforce of an organization or company. Human resource management has four basic functions: staffing, motivation, training and development, and maintenance. It is convenient to use the flowcharts to represent various HR processes and workflows. ConceptDraw DIAGRAM diagramming and vector drawing software extended with HR Flowcharts solution from the Management area of ConceptDraw Solution Park supplies you with comprehensive selection of predesigned vector HR flowchart symbols and standardized flowchart notation symbols, which allow you to design effectively the eye-catching infographics and diagrams relating to any human resource management process that will be relevant and understood by all business associates. The ConceptDraw DIAGRAM software offers also the set of predesigned flowchart and workflow templates and samples making your drawing process as easy as possible. Use the HR Flowcharts solution to create professional-looking HR Flowcharts and HRM Business Process Diagrams in a matter of moments.

Building Drawing. Design Element: Piping Plan

When you are going to build a house or to make repairs of new built home, apartment, office, shop, or to renovate any other premises, in many cases you will need to make the package of drawings, plans and documents, including the such important plans as the Overall floor plan, Interior design plan, Ceiling plan, Electrical system plan, and of course the Plumbing plan, Water supply system plan, and Piping Plan. When choosing between the modern software for building construction, planning and design, we recommend you to select the multifunctional building plan software ConceptDraw DIAGRAM enhanced with Plumbing and Piping Plans solution from the Building Plans area of ConceptDraw Solution Park. This solution provides large variety of examples, samples, quick-start templates and libraries of pipes, plumbing and valves vector design elements for design and construction the Plumbing and Piping Plans, schematics and annotated diagrams for hot and cold water supply systems, water lines and waste water disposal systems.

Flow Chart

A Flow Chart is a type of diagram which visualizes a process, algorithm of a program or workflow. The steps / operations are represented as boxes of various types and are connected by arrows which show the flow of the process. But how to design a Flow Chart fast and easy? We recommend to use a powerful ConceptDraw DIAGRAM diagramming and vector drawing software extended with Flowcharts Solution from the "Diagrams" Area of ConceptDraw Solution Park.