TQM Diagram Example
The Total Quality Management Diagram solution helps you and your organization visualize business and industrial processes. Create Total Quality Management diagrams for business process with ConceptDraw software.HelpDesk
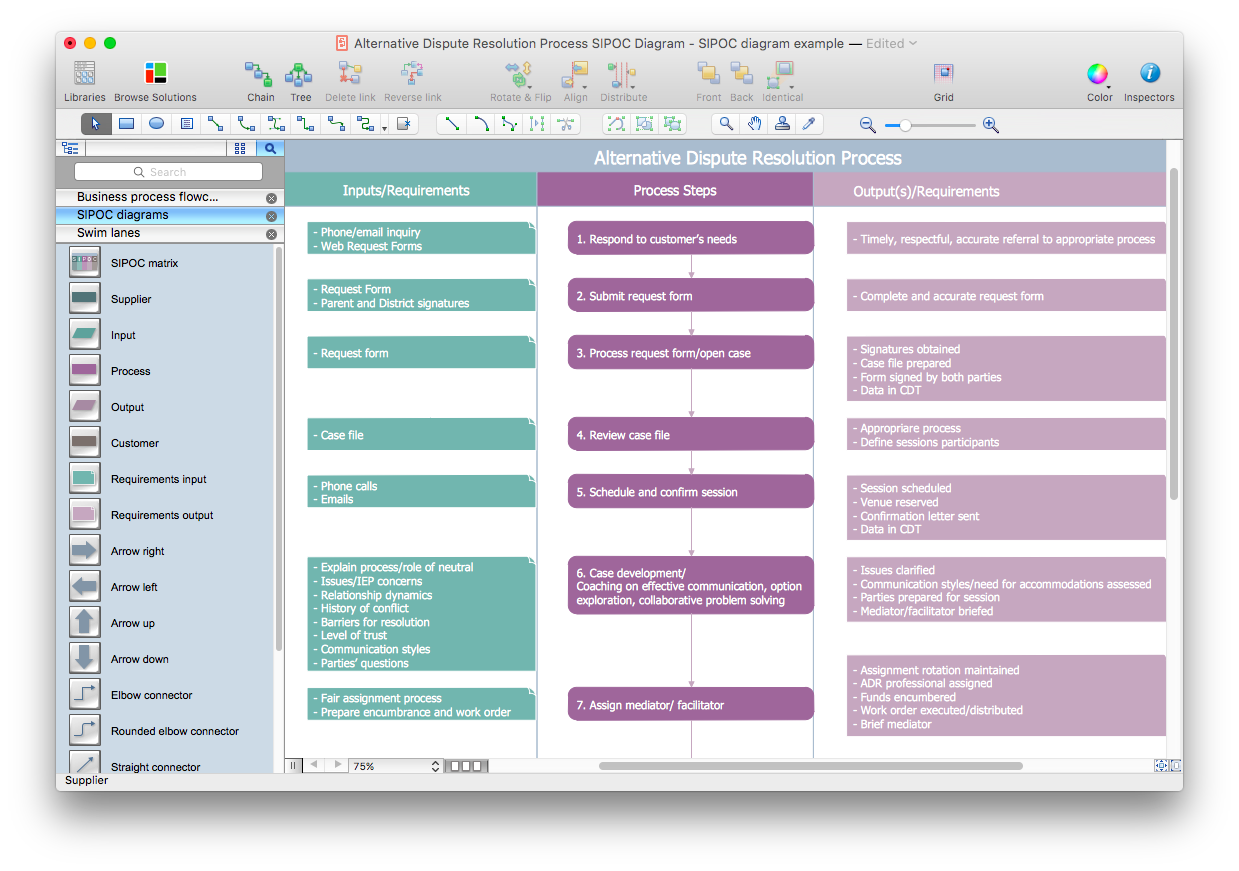
How to Create a SIPOC Diagram Using ConceptDraw PRO
SIPOC (suppliers, inputs, process, outputs, customers) diagram is focused on the quality of a business process inputs and outputs. SIPOC diagram has a form of a segmented table that gives comprehensive outline for each category. SIPOC diagram depicts the start and end of a process, and the relationships between a company and its suppliers. SIPOC diagram is an important part of the Six Sigma methodology. With its Business Process Mapping solution, ConceptDraw PRO offers a power set of process mapping tools to empower quality management within an organization.
 Plan-Do-Check-Act (PDCA)
Plan-Do-Check-Act (PDCA) solution extends the ConceptDraw PRO software with collection of samples and predesigned vector objects for easy visualization four stages of PDCA cycle, PDSA cycle, or Deming cycle, for illustration effective application of this method to the practical business tasks, for depiction the implementation of changes and solution the problems in business processes. Plan-Do-Check-Act (PDCA) solution helps to design professional-looking and attractive Plan Do Study Act diagrams, PDCA cycle diagrams, PDCA Process diagrams, and to construct the Quality Management Process Models, which all assist to manage efficiently the business processes, to improve quality of work and to reduce significantly the costs.
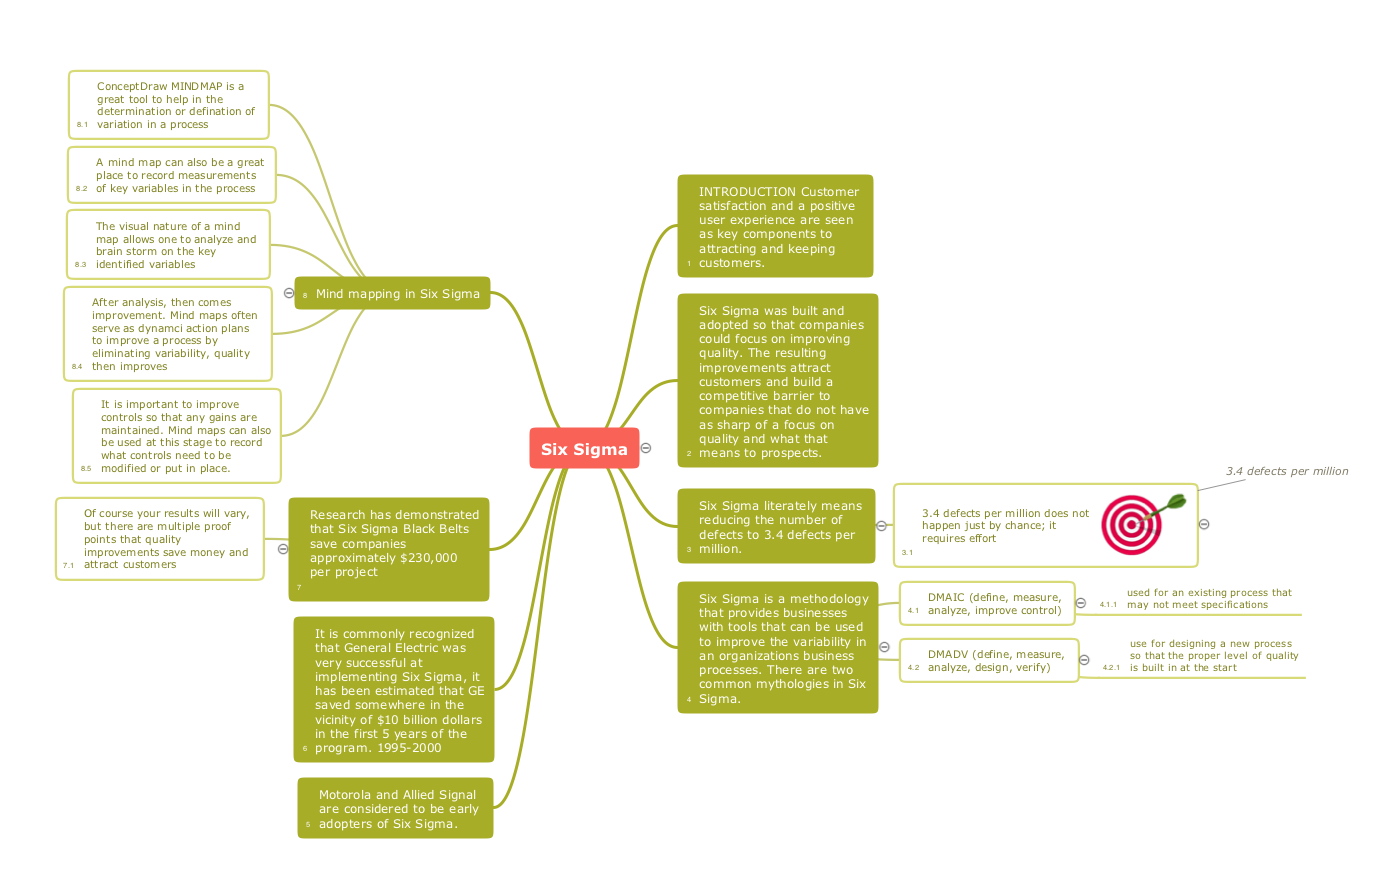
Constant improvement of key performance indicators
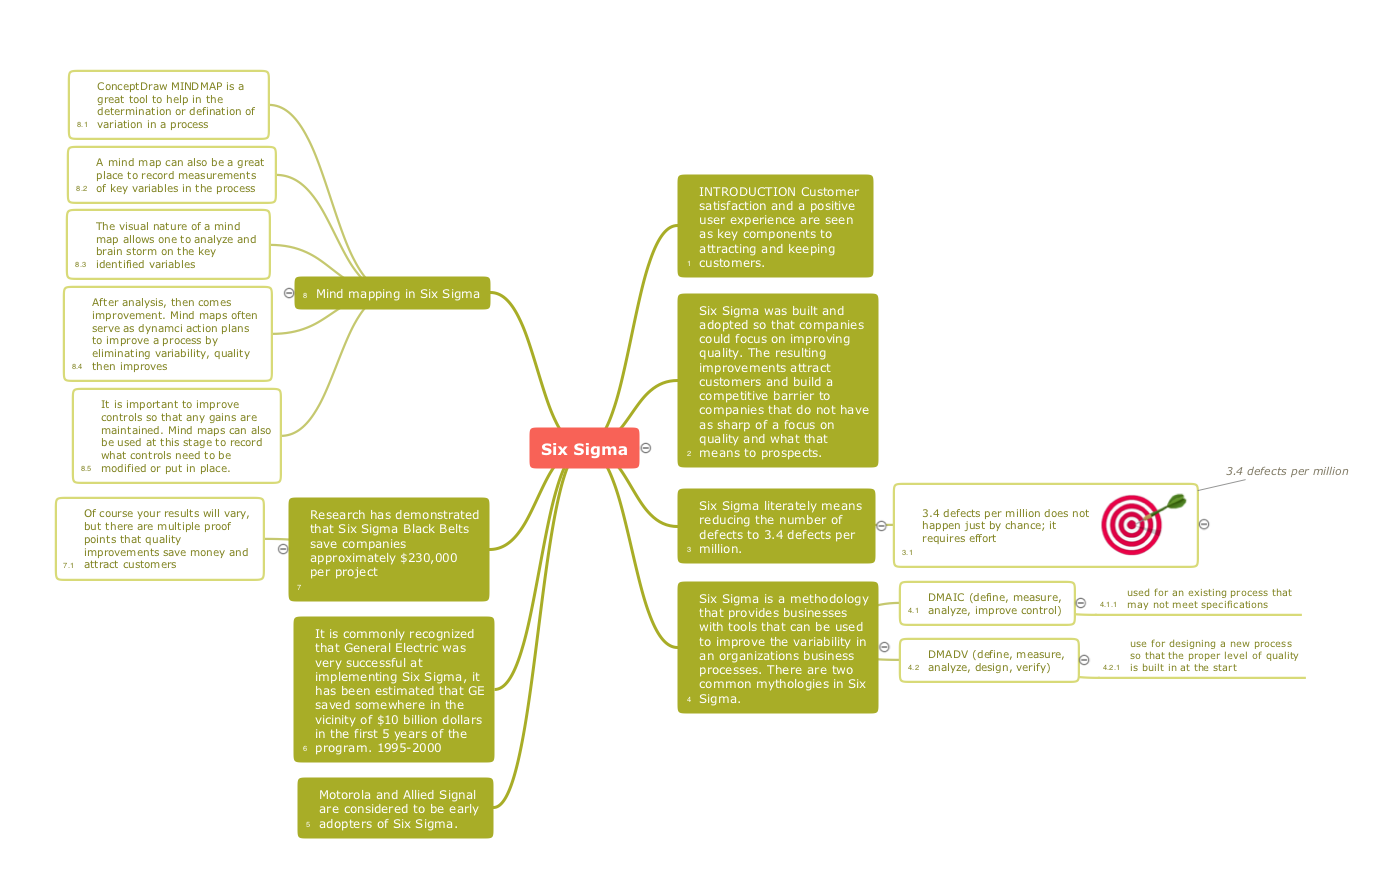
There are available tool to lend a fresh look to quality procedures - ConceptDraw MINDMAP.Quality Improvement
Constant improvement of key performance indicators that are related to quality is a step in the right direction for a company interested in market growth.Quality Criteria MindMap
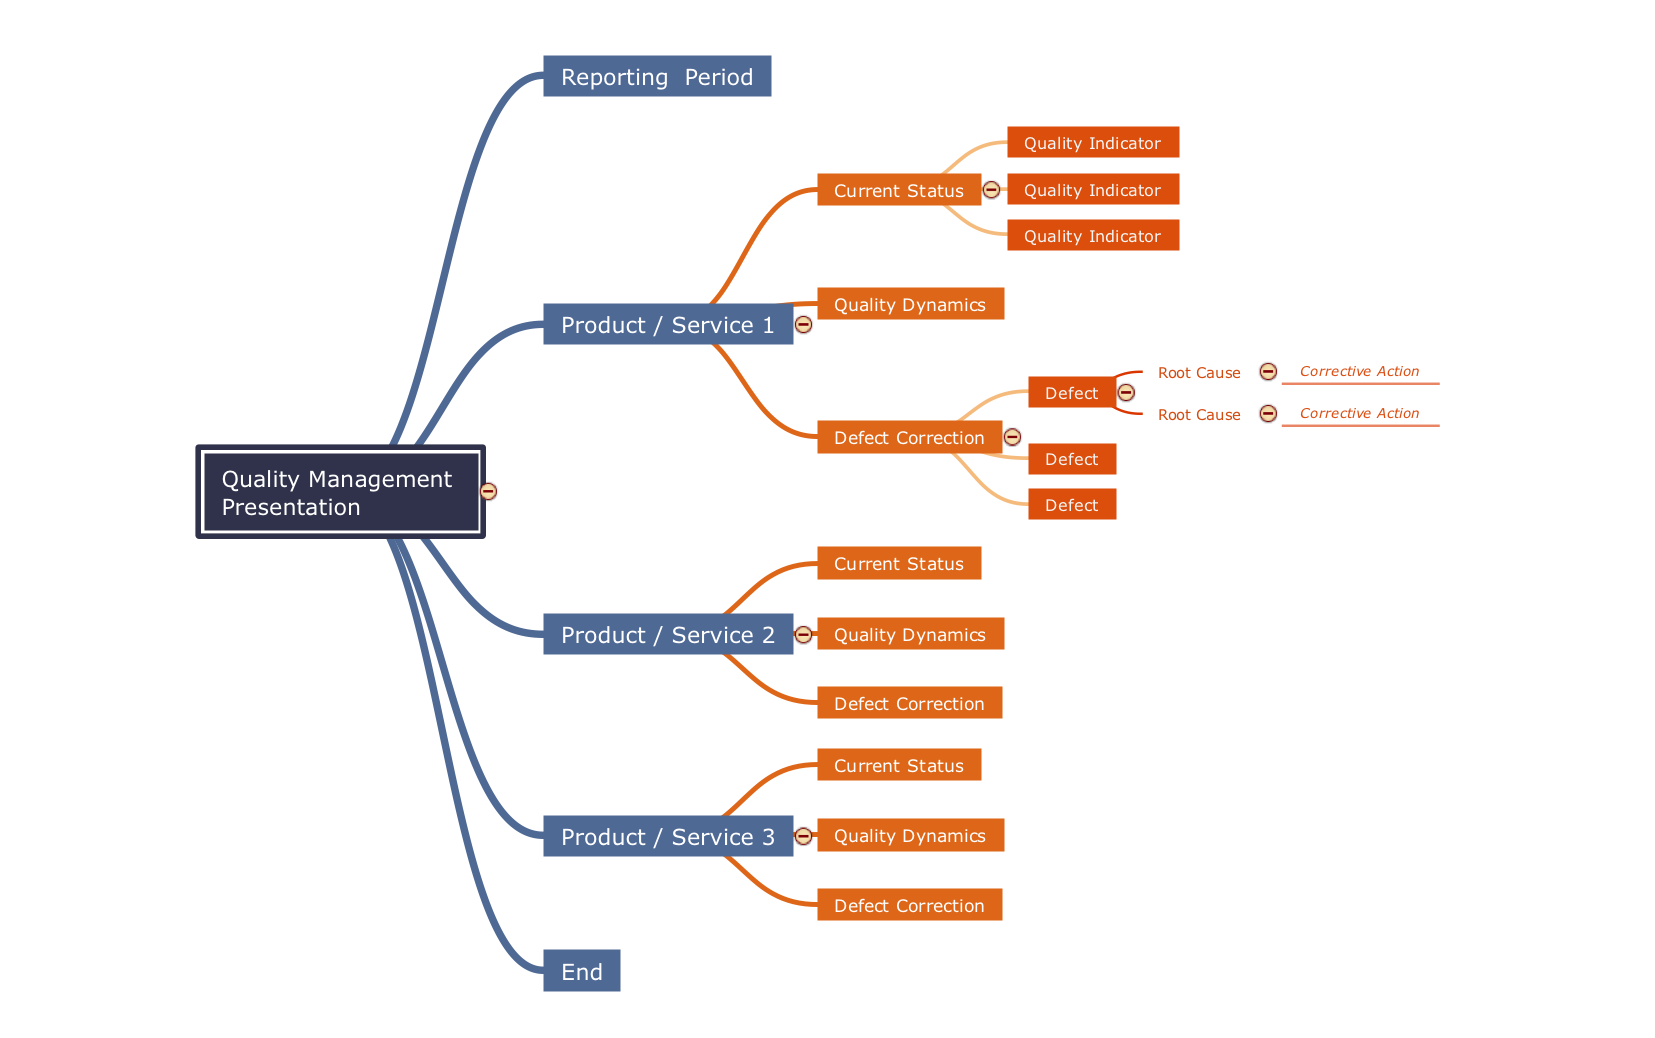
Quality Management Mind Maps - Presentations, Meeting Agendas, Problem will be solved. The visual form of mind maps is helpful in all stages of quality management, from describing problem to describing and documenting a decision.Business Process Reengineering. Business Process Example
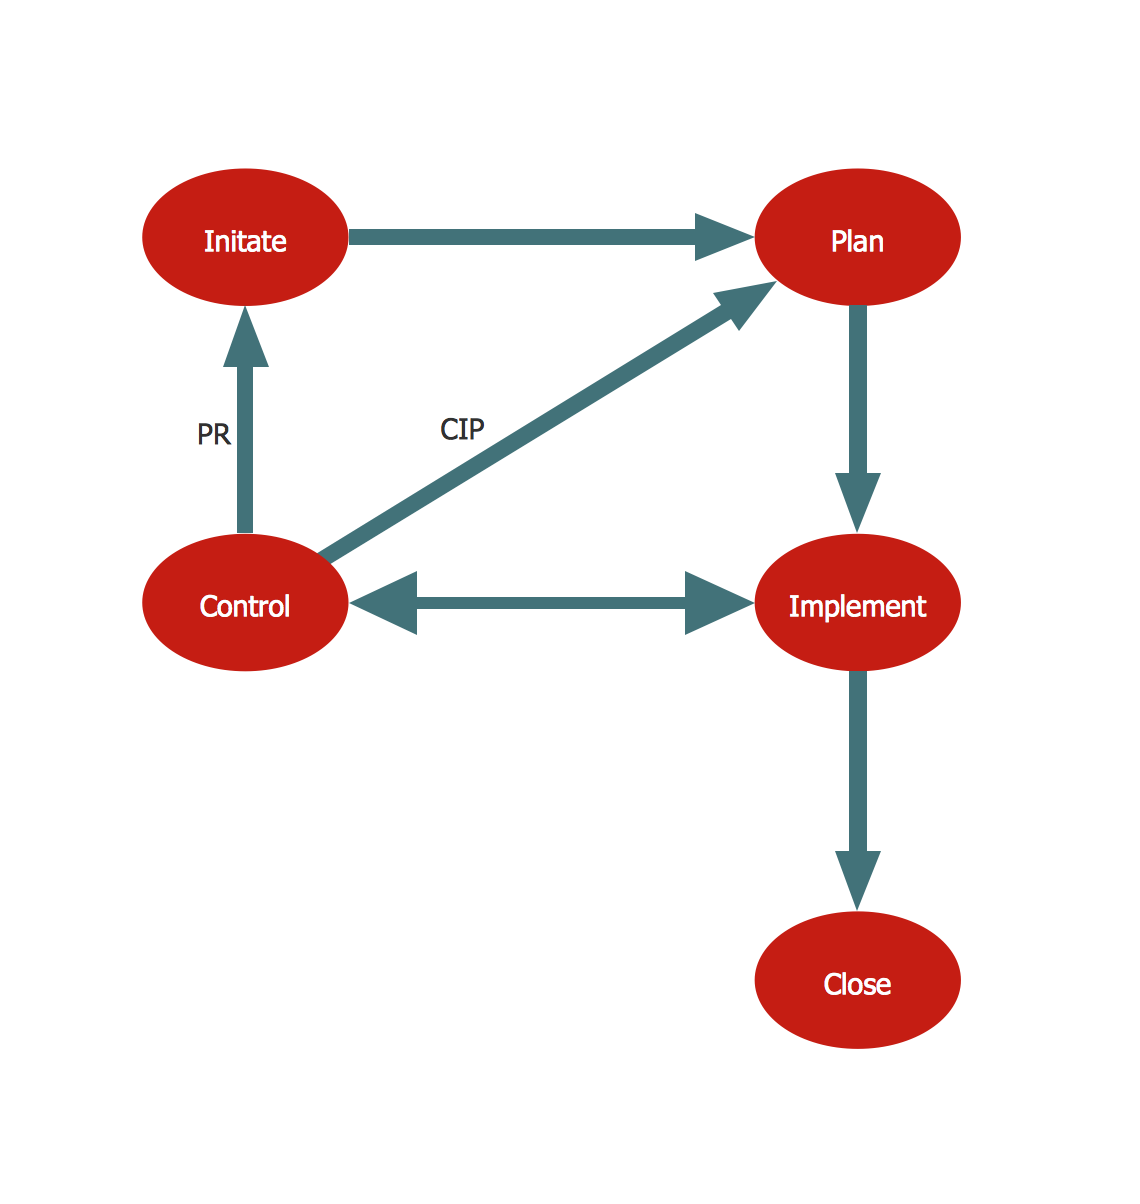
This sample shows the Business Process Reengineering Diagram, displays the Continuous Improvement Process (CIP) directed at the permanent improvement of the processes. This sample can be used in business process management, quality management, project management and program management.TQM Diagram — Professional Total Quality Management
The Total Quality Management Diagram solution helps you and your organization visualize business and industrial processes. Create Total Quality Management diagrams for business process with ConceptDraw software.PROBLEM ANALYSIS. Identify and Structure Factors
Identify and Structure Factors. Use the Affinity Diagram to collect and structure factors that impact on a problem. ConceptDraw Office suite is a software for identify and structure factors with affinity diagram. This is a grouping and structuring of factors that impact on a problem.
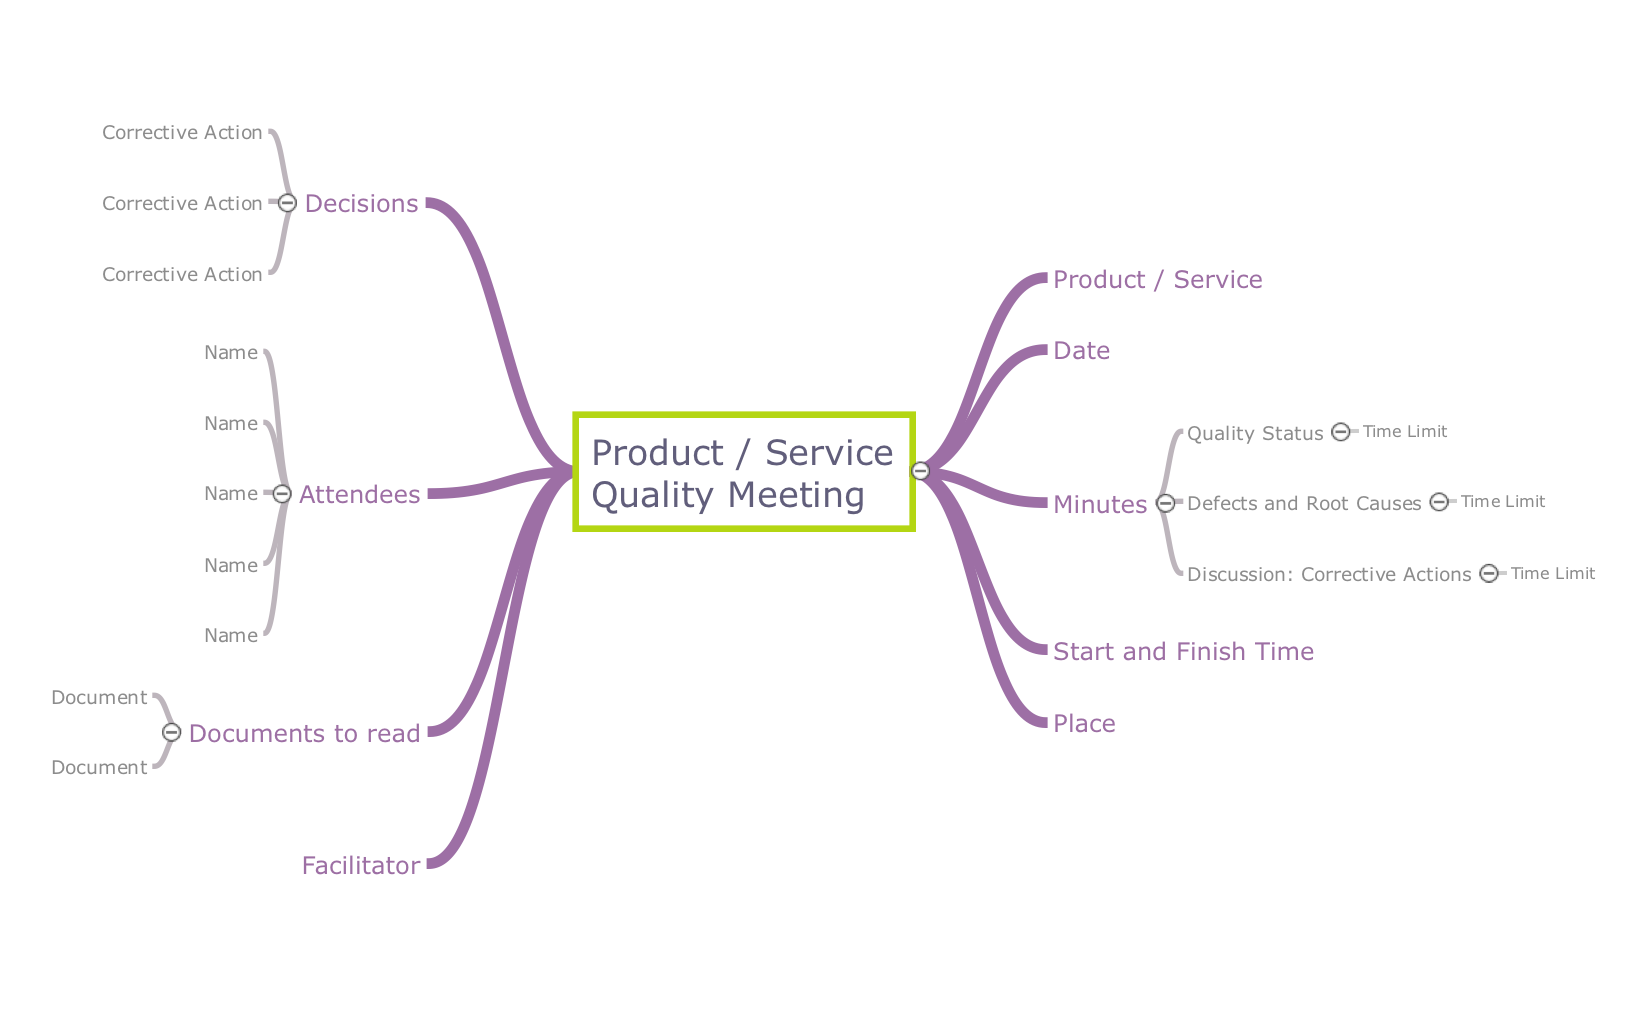
Quality Mind Maps - samples and templates
Use samples and templates to describe your own quality processes, brainstorm, and structure quality issues.Create a Value Stream Map
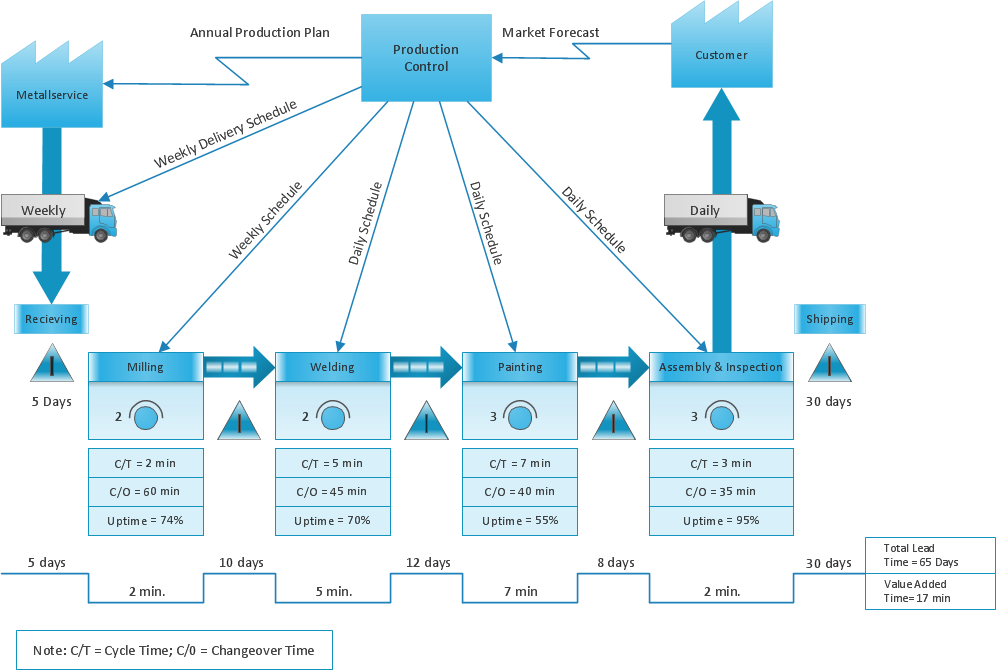
Use ConceptDraw PRO software extended with Value Stream Mapping solution to create your own VSM diagrams.Organizational Structure Total Quality Management
The Total Quality Management Diagram solution helps you and your organization visualize business and industrial processes. Create Total Quality Management diagrams for business process with ConceptDraw software.
 Seven Management and Planning Tools
Seven Management and Planning Tools solution extends ConceptDraw PRO and ConceptDraw MINDMAP with features, templates, samples and libraries of vector stencils for drawing management mind maps and diagrams.
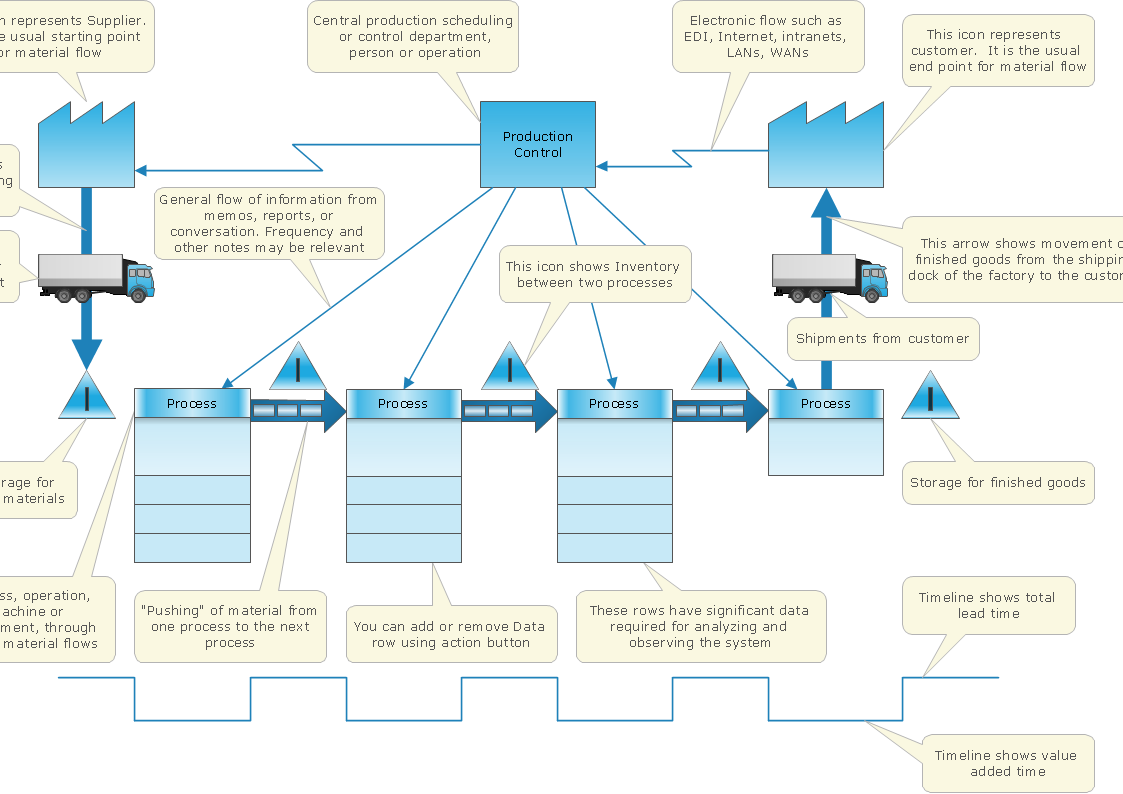
How To create Value Stream Map (VSM)
Value Stream Map template helps you to create VSM diagrams using ConceptDraw PRO software.Quality visualization in your company
Using ConceptDraw quality mind maps is a perfect addition to quality visualization in your company.- Continuous Improvement Plan Example
- Affinity diagram - Implementing continuous process improvement ...
- Mind Map Continuous Improvement Diagram
- Affinity diagram - Implementing continuous process improvement
- Affinity diagram - Implementing continuous process improvement ...
- Example Bpr Project Plan
- Continuous Improvement Strategy Examples
- Continuous Process Improvement Examples
- Affinity diagram - Implementing continuous process improvement ...
- SWOT and TOWS Matrix Diagrams | Police Action Plan Template
- Improvement Strategy Template
- Affinity Diagram | Affinity diagram - Implementing continuous ...
- Affinity Diagrams Examples
- Business Process Reengineering Project Plan Template
- Affinity diagram - Implementing continuous process improvement ...
- Continuous Improvement Clipart
- Examples Of Police Action Plan
- Quality Improvement | Process Flowchart | Constant improvement of ...
- Continuous Improvement Flowchart

