Taxi Service Data Flow Diagram DFD Example
This sample shows the Data Flow Diagram of the Taxi Service and interactions between the Clients, Operators and Divers, as well as Orders and Reports databases.Work Flow Diagram
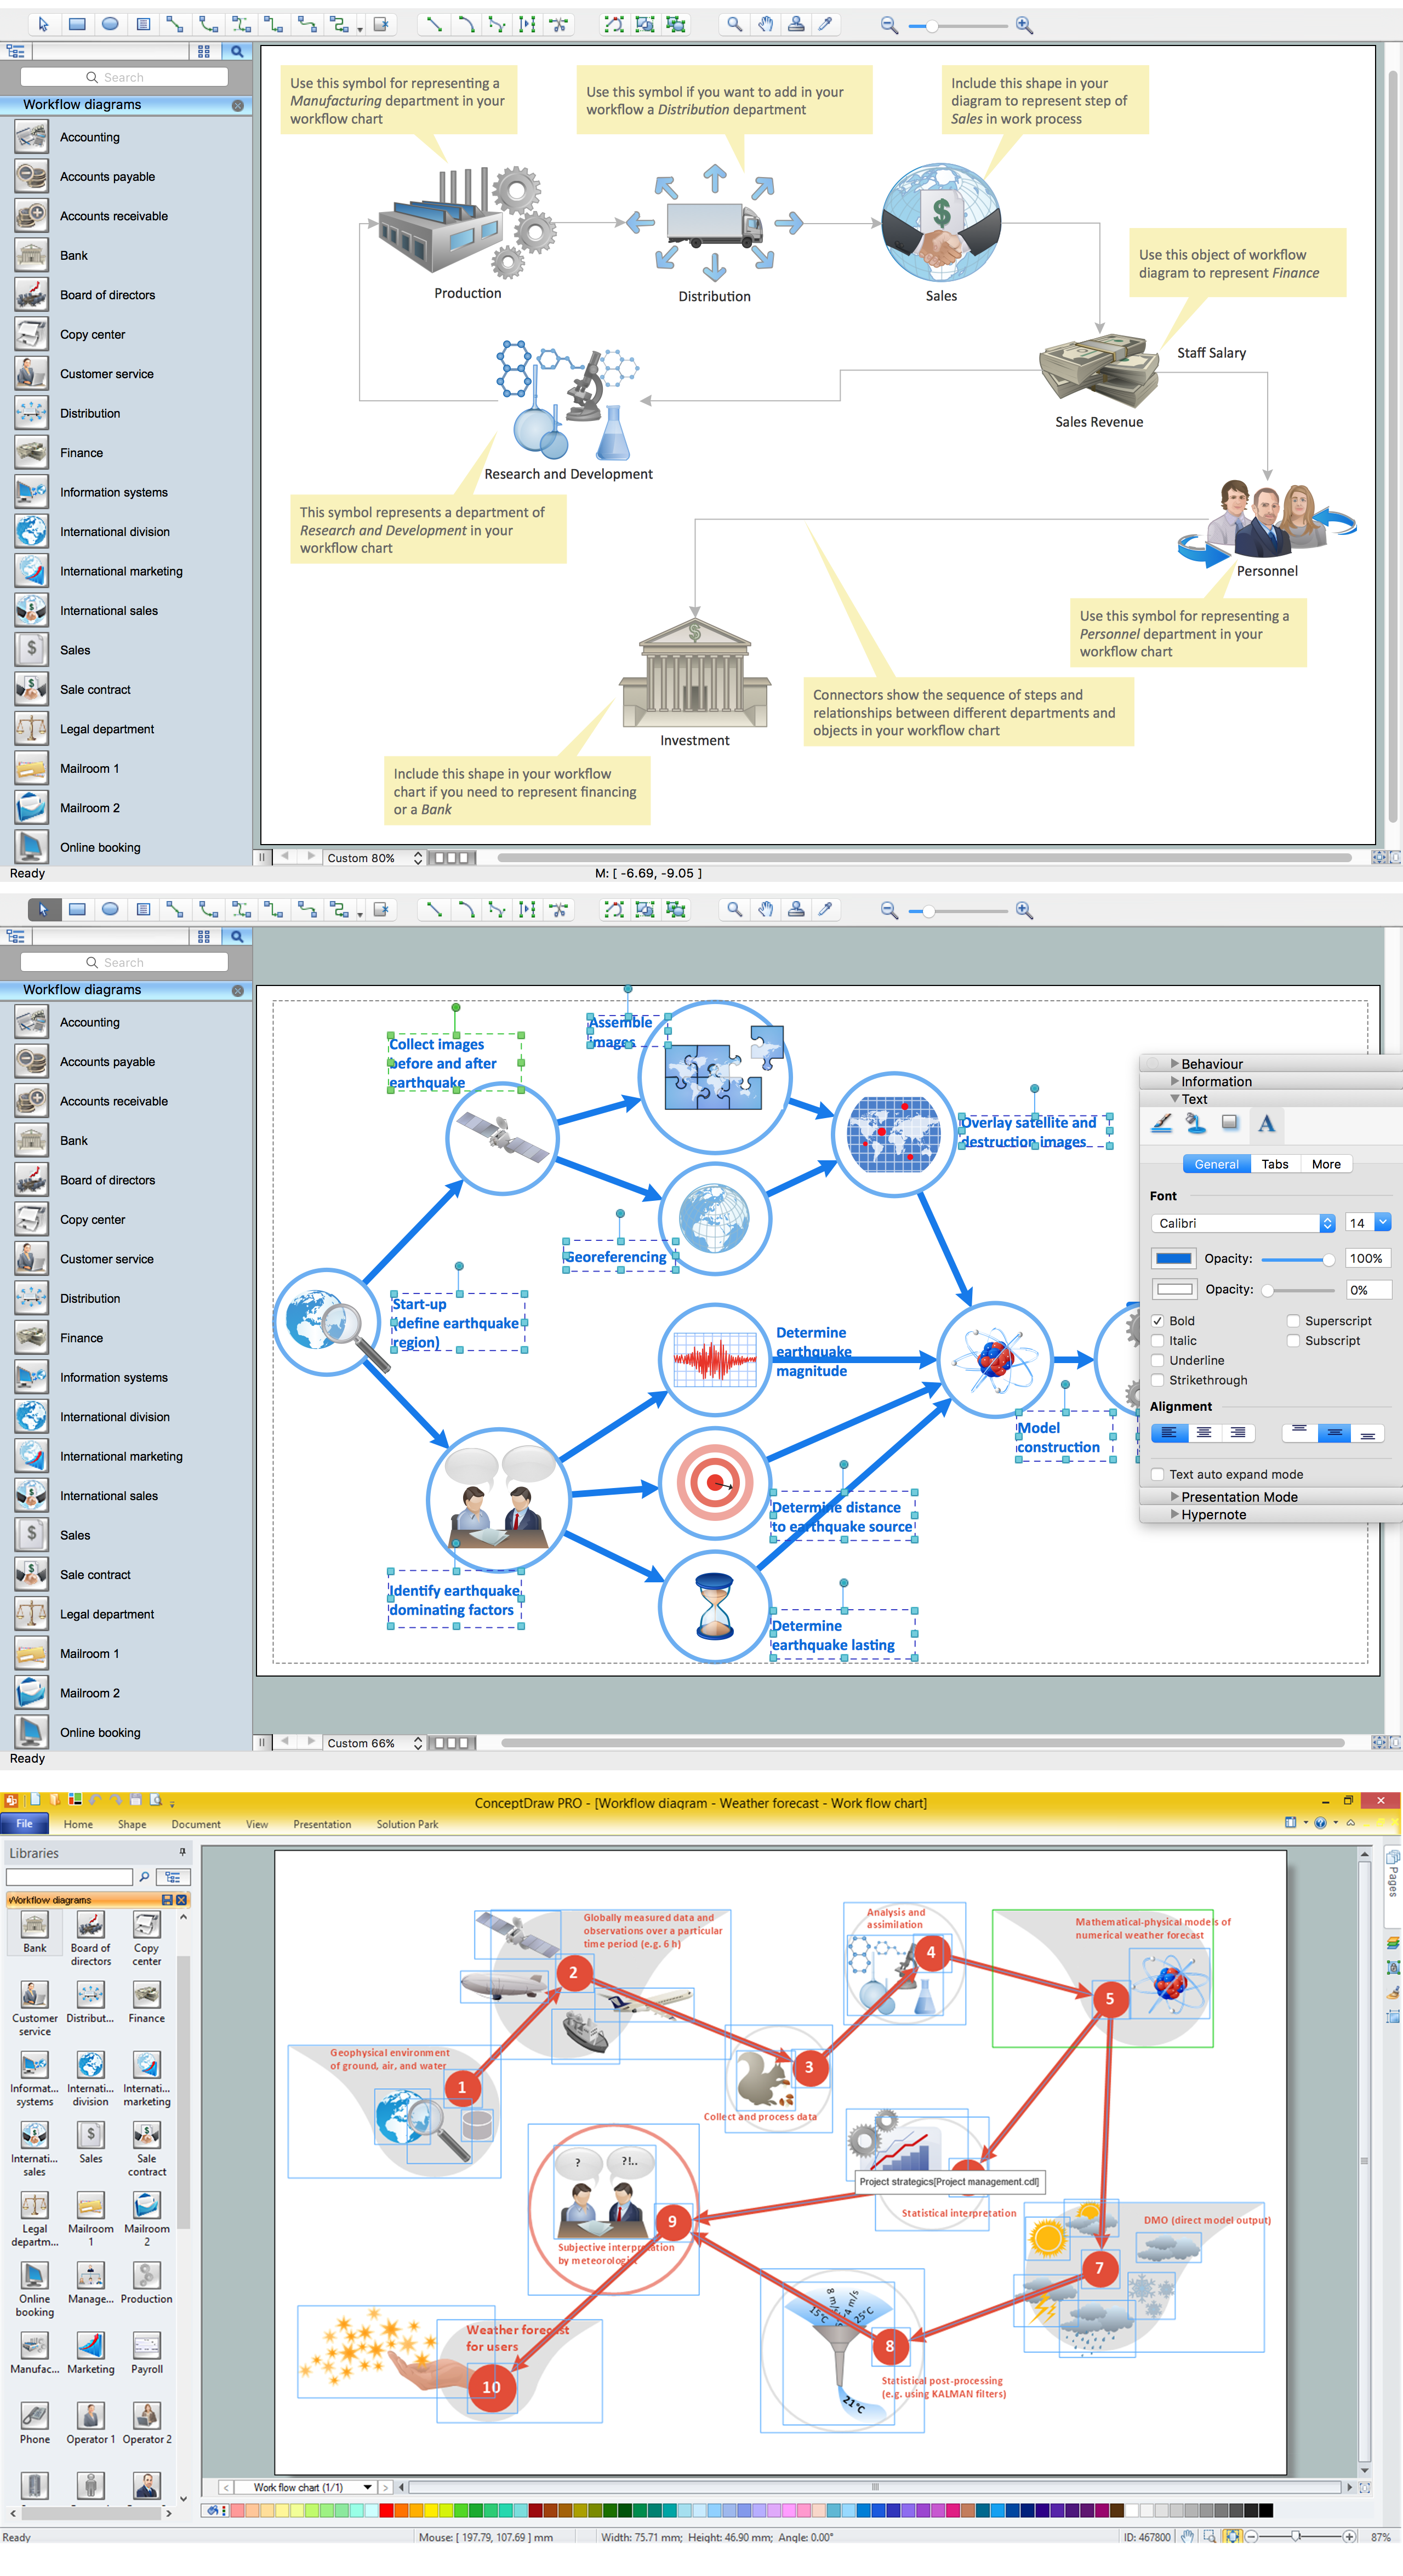
ConceptDraw DIAGRAM diagramming and vector drawing software offers the Workflow Diagrams solution from the Business Processes area of ConceptDraw Solution Park with powerful tools to help you draw any Work Flow Diagram fast and easy.Basic Flowchart Symbols and Meaning
Flowcharts are the best for visually representation the business processes and the flow of a custom-order process through various departments within an organization. ConceptDraw DIAGRAM diagramming and vector drawing software extended with Flowcharts solution offers the full set of predesigned basic flowchart symbols which are gathered at two libraries: Flowchart and Flowcharts Rapid Draw. Among them are: process, terminator, decision, data, document, display, manual loop, and many other specific symbols. The meaning for each symbol offered by ConceptDraw gives the presentation about their proposed use in professional Flowcharts for business and technical processes, software algorithms, well-developed structures of web sites, Workflow diagrams, Process flow diagram and correlation in developing on-line instructional projects or business process system. Use of ready flow chart symbols in diagrams is incredibly useful - you need simply drag desired from the libraries to your document and arrange them in required order. There are a few serious alternatives to Visio for Mac, one of them is ConceptDraw DIAGRAM. It is one of the main contender with the most similar features and capabilities.
Workflow Diagram Data
Workflow Diagram created by using special software based on graphic mastering technology Arrows10. Its automatics follows the global concept of business graphics and diagramming. The practical effectiveness of Arrows10 technology used in ConceptDraw DIAGRAM are around the quick auto-arrows behaving as expected and connecting boxes of workflow diagram from workflow symbol to process flow symbol. ConceptDraw DIAGRAM is a workflow diagram software contains specific features help you to draw diagrams faster, such as RapidDraw, or Arrows10. There is also a rich set of samples and templates to give you an example of data may be visualized as workflow diagram.Interaction Overview Diagram
UML Interaction Overview Diagram schematically shows a control flow with nodes and a sequence of activities that can contain interaction or sequence diagrams.
Project — Working With Tasks
A full-featured project management solution with all the necessary functions right at your fingertips. Generates an extensive variety of reports on project and task statuses. These videos provide a series of lessons that will enhance the understanding of all our users, from people just starting out with the software, through to expert users.Property Management Examples
This sample was created in ConceptDraw DIAGRAM diagramming and vector drawing software using the Seven Management and Planning Tools Solution from the Business Productivity area of ConceptDraw Solution Park. This sample shows the Property Management matrix, the ideas are ordered in regards to importance and frequency. This matrix gives the ability to turn the theory into quantifiable data.Types of Flowchart - Overview
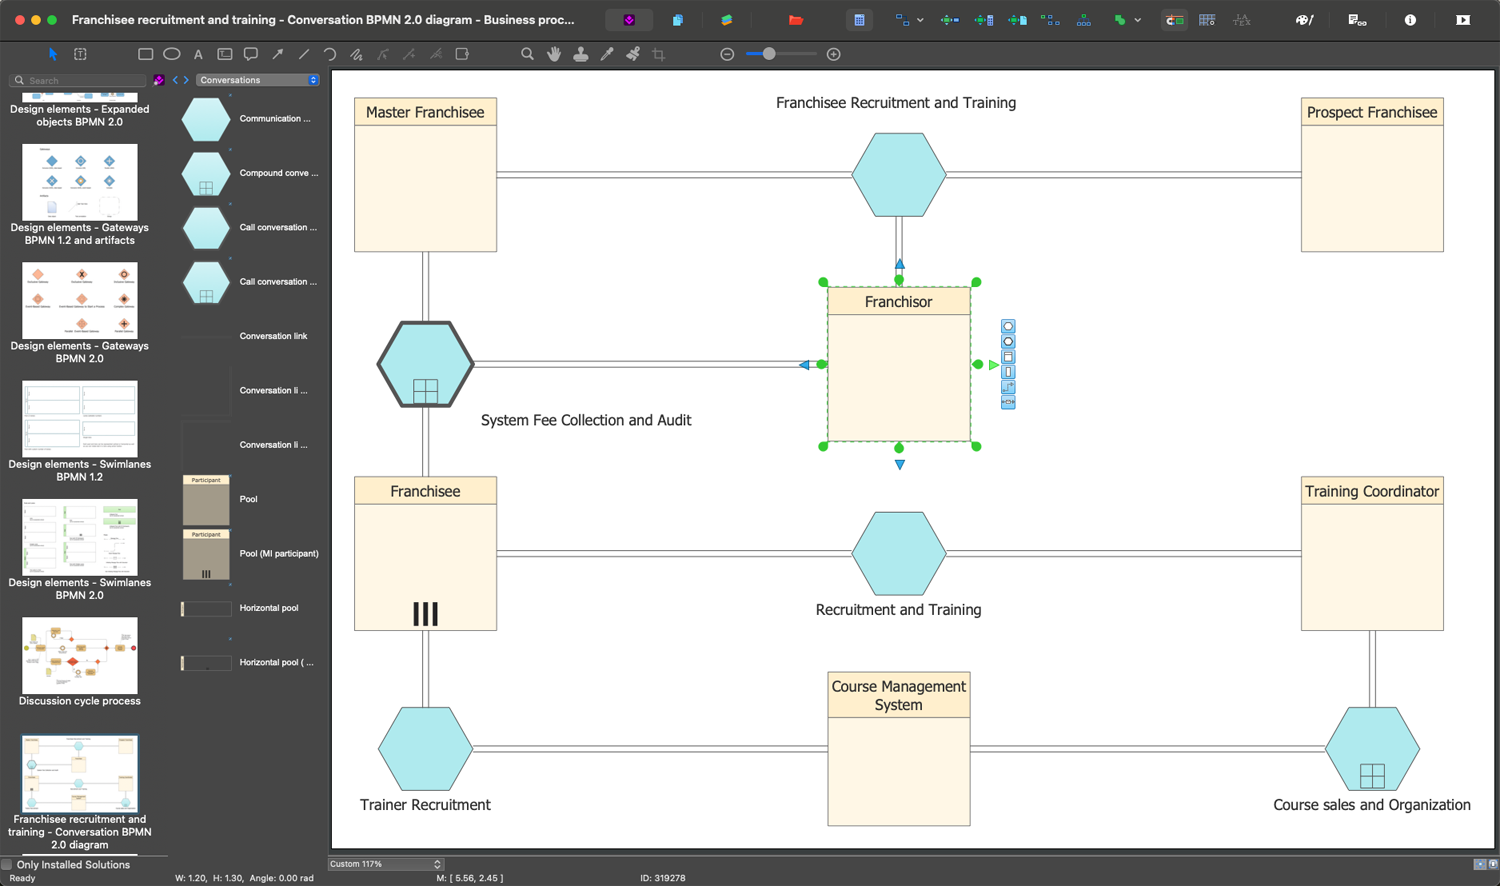
When designing a process or an instruction in clear and understandable way, you should consider creating a flowchart. You can avoid spending a lot of time understanding complex concepts as they get clear with different diagrams. The flowcharts are very popular diagram type, they are useful at different fields from the description business processes to the presentation of cooking recipes. Basic Flowchart, Business Process Modeling Diagram, Process Flowchart, Cross Functional Flowchart, Procedure Flowchart, Data Flow Diagram, IDEF Flowchart, SDL Diagram, Workflow Diagram, Document Flowchart, Program Flowchart, Value Stream Map, System Flowchart, Highlight Flowchart, Sales Flowchart are the main types flowchart. The ConceptDraw DIAGRAM is one of the professional applications which has great advantages and using which you can create different types of Flowcharts easy and fast. Try to draw an illustrative and comprehensible diagram in ConceptDraw DIAGRAM describing the processes instead of writing complex long text and make sure how it is convenient. Visio is expensive, and if you use it in a team environment, these costs are compounded. ConceptDraw DIAGRAM is an affordable alternative to Visio and luckily, it comes with a team plan. ConceptDraw DIAGRAM can import and export Visio files, so Mac users can collaborate with PC users stuck on Microsoft's software.
UML Tool & UML Diagram Examples
The Unified Modeling Language (abbr. UML) is a general-purpose modeling language widely used in the field of software development, software engineering, education, science, industry, business. In 1997 the UML was approved as a standard by the OMG (Object Management Group) and in 2005 was published as ISO standard by the International Organization for Standardization. UML is widely and succesfully applied for optimization the process of software systems development and business systems analysis. There are used 14 types of UML diagrams, 7 from them depict structural information, another 7 types represent different types of behavior and aspects of interactions. Design of any automated process is easy with ConceptDraw DIAGRAM and unique Rapid UML solution from the Software Development area, which provides numerous UML examples, templates and vector stencils libraries for drawing all types of UML 1.x and UML 2.x diagrams. Use of predesigned UML diagram examples and templates lets you quickly start drawing your own UML diagrams in ConceptDraw DIAGRAM software.UML Class Diagram Notation
When it comes to system construction, a class diagram is the most widely used diagram. UML Class Diagrams is a type of static structure diagram that is used for general conceptual modeling of the systematics of the application. Such a diagram would illustrate the object-oriented view of a system. The object orientation of a system is indicated by a class diagram. It describes the structure of a system by showing the general issues,classes of a system, attributes, operations, interfaces, inheritance, and the relationships between them.Workflow Diagram Symbols
Workflow Diagram is an acknowledged method of drawing the processes and business processes, which uses the concerted set of symbols for depicting different kinds of steps or relations. Often it is named the Process Flow Diagram, but the real Process Flow Diagram uses different visual notations and different flowchart symbols. The professionally designed Workflow diagram also may be used for the same purpose as a Critical process flow diagram. Nevertheless, there are many cases when you may need to make your Workflow Diagram more bright and graphic. ConceptDraw DIAGRAM diagramming software extended with Workflow Diagrams solution from Business Processes area of ConceptDraw Solution Park possesses the powerful properties of software for Workflow diagram design. It delivers rich set of business process workflow diagram symbols, which help users to accurately diagram the workflow scenarios and to design great-looking and attractive Workflow Diagrams and Process Flow Diagrams better-suited for presentations, websites, reports, and other documents.The Best Business Process Modeling Software
ConceptDraw DIAGRAM is a best business processes modeling software for graphical documenting processes of the company. ConceptDraw has 142 vector stencils in the 8 libraries that helps you to start using Diagramming Software for designing own Business Process Diagrams.
Software Diagram Examples and Templates
ConceptDraw DIAGRAM is a powerful tool for business and technical diagramming. Software Development area of ConceptDraw Solution Park provides 5 solutions: Data Flow Diagrams, Entity-Relationship Diagram (ERD), Graphic User Interface, IDEFO Diagrams, Rapid UML.Gane Sarson Diagram
The Gane-Sarson methodology uses the graphical techniques for building the logical models for the systems. It is helpful for analysts and designers to make common and clear picture of the system, to depict all its processes and how they transform the data. The Gane-Sarson methodology lets represent all this information in a way understandable for the users and other interested people, and gives the possibility to see instantly how the system's parts serve together to meet their needs. This methodology supposes the building of a system top-down. First you need create an overall system data flow, then determine the details of the data structures, the process logic and design the modular structures. ConceptDraw DIAGRAM diagramming and vector drawing software offers the Data Flow Diagrams solution with Gane-Sarson Notation library rich for the specific symbols of the Gane-Sarson notation. All they are vector and fully ready-to-use for drawing the Data Flow Diagrams, which will be then successfully used in presentations, websites, and various business documents.Quality Improvement
Constant improvement of key performance indicators that are related to quality is a step in the right direction for a company interested in market growth.Pareto Chart
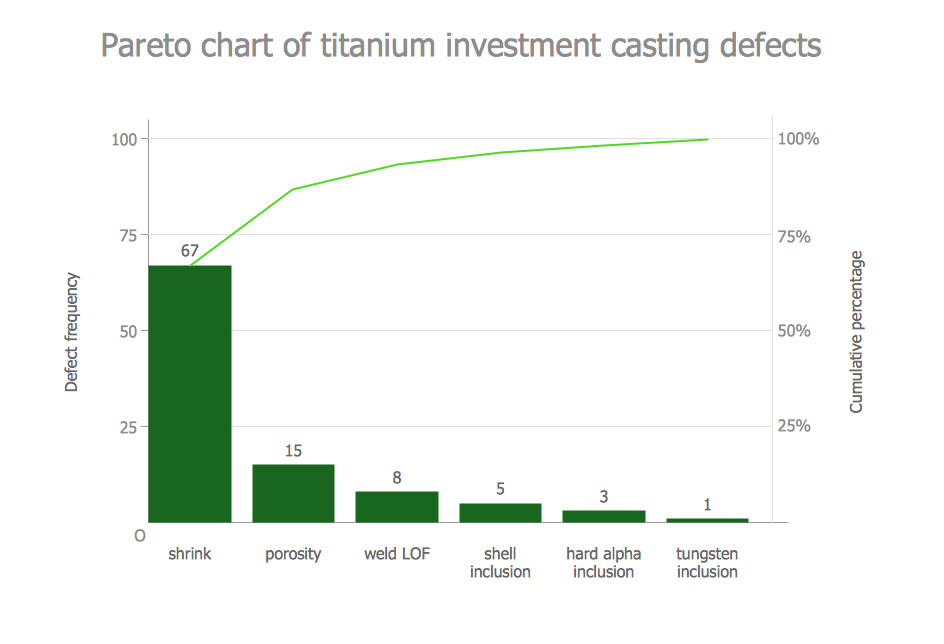
This sample shows the Pareto Chart of titanium investment casting defects. On the Pareto chart at the same time are displayed a bar graph and a line graph. The descending values are represented by the bars and the cumulative total values are represented by the line. Pareto charts are widely used in the areas of the quality improvement and the time management.Workflow Process Example
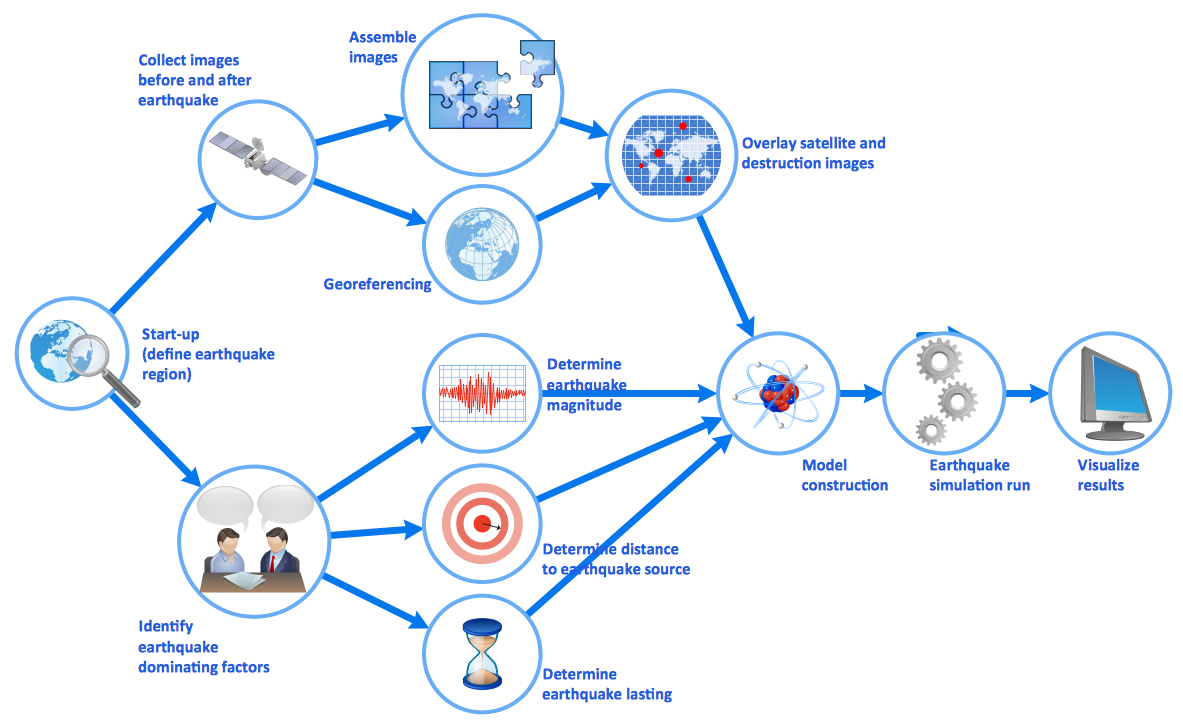
One of the most popular option helps to draw diagrams faster is pre-designed set of examples related to each kind of diagram. ConceptDraw DIAGRAM software extended with the Workflow Diagrams solution delivers a complete set of workflow process examples helps you to start making your own workflow faster.Organization Chart Software
Create Organizational Chart Software - You need create Organizational Chart? Nothing could be easier with ConceptDraw DIAGRAM diagramming and vector drawing software. ConceptDraw DIAGRAM presents the Organizational Charts Solution from the Management Area that will allow you to draw the Organization Charts of any difficulty easy and quick.
UML Use Case Diagram Example - Estate Agency
UML Diagram Estate Agency. This sample was created in ConceptDraw DIAGRAM diagramming and vector drawing software using the UML Use Case Diagram library of the Rapid UML Solution from the Software Development area of ConceptDraw Solution Park. This sample shows the work of the estate agency and is used by the estate agencies, building companies, at the trainings of the estate agencies, for understanding the working processes of the estate agencies.ConceptDraw Arrows10 Technology
Connecting objects manually in ConceptDraw DIAGRAM is a snap: - points; - Connecting groups of objects; - Auto-routing; - Connectors text; - Snap to Guides ; - Quick.- Event-driven Process Chain (EPC) Diagram Software | Control and ...
- Actitvity Diagram For Taxi Management System
- Taxi Service Data Flow Diagram DFD Example | Workflow Diagram ...
- UML Use Case Diagram Example - Taxi Service | Taxi Service Data ...
- Cab booking public process - Collaboration BPMN 2.0 diagram ...
- Taxi Service Data Flow Diagram DFD Example | Workflow Diagram ...
- Cab booking public process - Collaboration BPMN 2.0 diagram ...
- Cross Functional Flowchart for Business Process Mapping | Classic ...
- Material Inventory Control System Flow Chart
- Taxi Service Data Flow Diagram DFD Example | UML Class ...
- Business Process Diagrams | Event-driven Process Chain Diagrams ...
- Data Flow Diagram Software
- UML Use Case Diagram Example - Taxi Service | Taxi Service Data ...
- Control and Information Architecture Diagrams (CIAD) with ...
- UML Deployment Diagram Example - ATM System UML diagrams ...
- UML Use Case Diagram Example. Registration System | UML ...
- Taxi service - Workflow diagram | Workflow Process Example | Taxi ...
- Flowchart Components | UML Component Diagram Example ...
- Collaboration Diagram Example Taxi
- Flow Chart For Booking A Taxi


