 What is a Dashboard Area
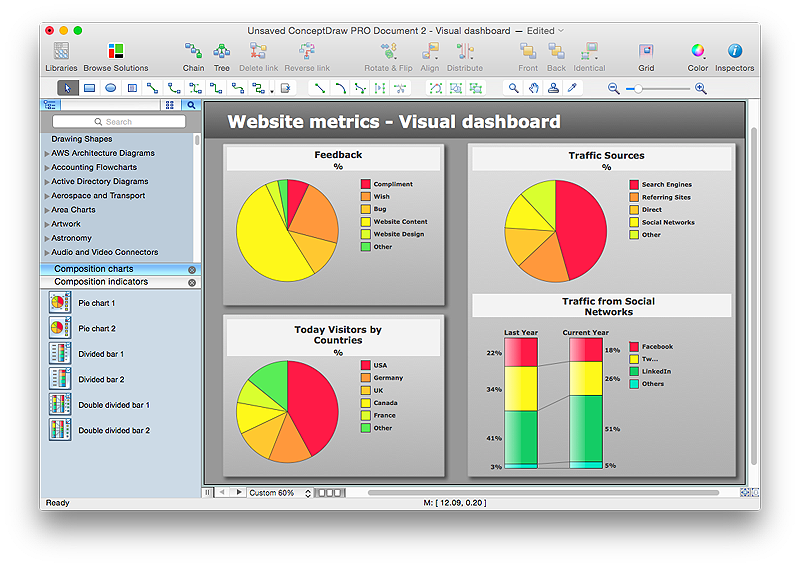
Solutions from the area What is a Dashboard of ConceptDraw Solution Park collects templates, samples and vector stencils libraries with of data driven charts and indicators for drawing the basic types of Visual Dashboards.
HelpDesk
How to Connect a Live Object to a Text Data Source
Instruction on how to connect a ConceptDraw live object with data source files in TXT format to visualize the actual values of your performance metrics.
 Divided Bar Diagrams
Divided bar diagrams solution extends ConceptDraw PRO software with templates, samples and library of vector stencils for drawing the divided bar charts.
 Computers and Communications
Computers and communications solution extends ConceptDraw PRO software with illustration samples, templates and vector stencils libraries with clip art of computers, control devices, communications, technology, Apple machines.
 Australia Map
For graphic artists creating accurate maps of Australia. The Australia Map solution - allows designers to map Australia for their needs, offers a collection of scalable graphics representing the political geography of Australia, split into distinct state
 Mathematics
Mathematics solution extends ConceptDraw PRO software with templates, samples and libraries of vector stencils for drawing the mathematical illustrations, diagrams and charts.
 Food Court
Use the Food Court solution to create food art. Pictures of food can be designed using libraries of food images, fruit art and pictures of vegetables.
 Pie Charts
Pie Charts solution extends ConceptDraw PRO software with templates, samples and library of vector stencils for drawing the pie and donut charts.
 Business Process Mapping
The Business Process Mapping solution for ConceptDraw PRO is for users involved in process mapping and creating SIPOC diagrams.
 Biology
Biology solution extends ConceptDraw PRO software with samples, templates and libraries containing biological vector symbols, to help you create scientific and educational designs in the field of biology.
 Landscape & Garden
The Landscape and Gardens solution for ConceptDraw PRO v10 is the ideal drawing tool when creating landscape plans. Any gardener wondering how to design a garden can find the most effective way with Landscape and Gardens solution.
 Health Food
The Health Food solution contains the set of professionally designed samples and large collection of vector graphic libraries of healthy foods symbols of fruits, vegetables, herbs, nuts, beans, seafood, meat, dairy foods, drinks, which give powerful possi
 Aerospace and Transport
This solution extends ConceptDraw PRO software with templates, samples and library of vector clipart for drawing the Aerospace and Transport Illustrations. It contains clipart of aerospace objects and transportation vehicles, office buildings and anci
 Vehicular Networking
Vehicular Networking solution extends ConceptDraw PRO software with templates, samples and libraries of vector stencils for drawing the vehicular computer communication network diagrams and schemes.
- Conversion Of Graphics Pie Chart Pdf
- Conversion Of Graphics Pie Chart
- Conversion Of Graphics Pie Chart Table Flow Chart
- Approximate composition of the air - Pie chart | Design elements ...
- Pie Diagram Solution Pdf
- Pie Chart Software | Pie Chart Examples and Templates | How to ...
- Percentage Pie Chart. Pie Chart Examples | Pie Chart Software ...
- Make A Pie Graph Of Composition Of Air
- Pie Chart Examples and Templates | Pie Graph Worksheets | Pie ...
- Design elements - Comparison charts and indicators | Design ...
- Design elements - Composition charts and indicators | Pie Chart ...
- Design elements - Composition charts and indicators | Composition ...
- How to Draw a Divided Bar Chart in ConceptDraw PRO ...
- Pie Chart Examples and Templates | Examples of Flowcharts, Org ...
- Pie Chart Examples and Templates | Design elements ...
- ATM UML Diagrams | Accounting Flowcharts | Sales workflow ...
- Design elements - Composition charts and indicators | Composition ...
- Pie Chart Examples and Templates | Business Report Pie. Pie Chart ...
- Divided bar graph - Global natural gas consumption (2010) | Divided ...
