Flow chart Example. Warehouse Flowchart
Warehouse Flowcharts are various diagrams that describe the warehousing and inventory management processes on the warehouses. Typical purposes of Warehouse Flowcharts are evaluating warehouse performance, measuring efficiency of customer service and organizational performance. This type of Workflow diagrams can be used for identifying any disconnection between business activities and business objectives. They are effectively used by warehouse-related people and organizations, manufacturers, wholesalers, exporters, importers, transporters, and others. Standard Warehousing process flow diagram and standard Workflow diagram are used for process identification for further evaluating effectiveness and profitability of overall business process. Use the ConceptDraw PRO vector graphic software extended with Flowcharts solution to design your own professional-looking Workflow diagrams and Flowcharts of any types, including the Warehouse flowchart, Process flow diagrams which depict in details all steps of Warehouse packages flow. Microsoft Visio, designed for Windows users, can’t be opened directly on Mac. But fortunately, there are several Visio alternatives for Mac which will help Mac users to work Visio files. With ConceptDraw PRO, you may open, edit and save files in Visio format.
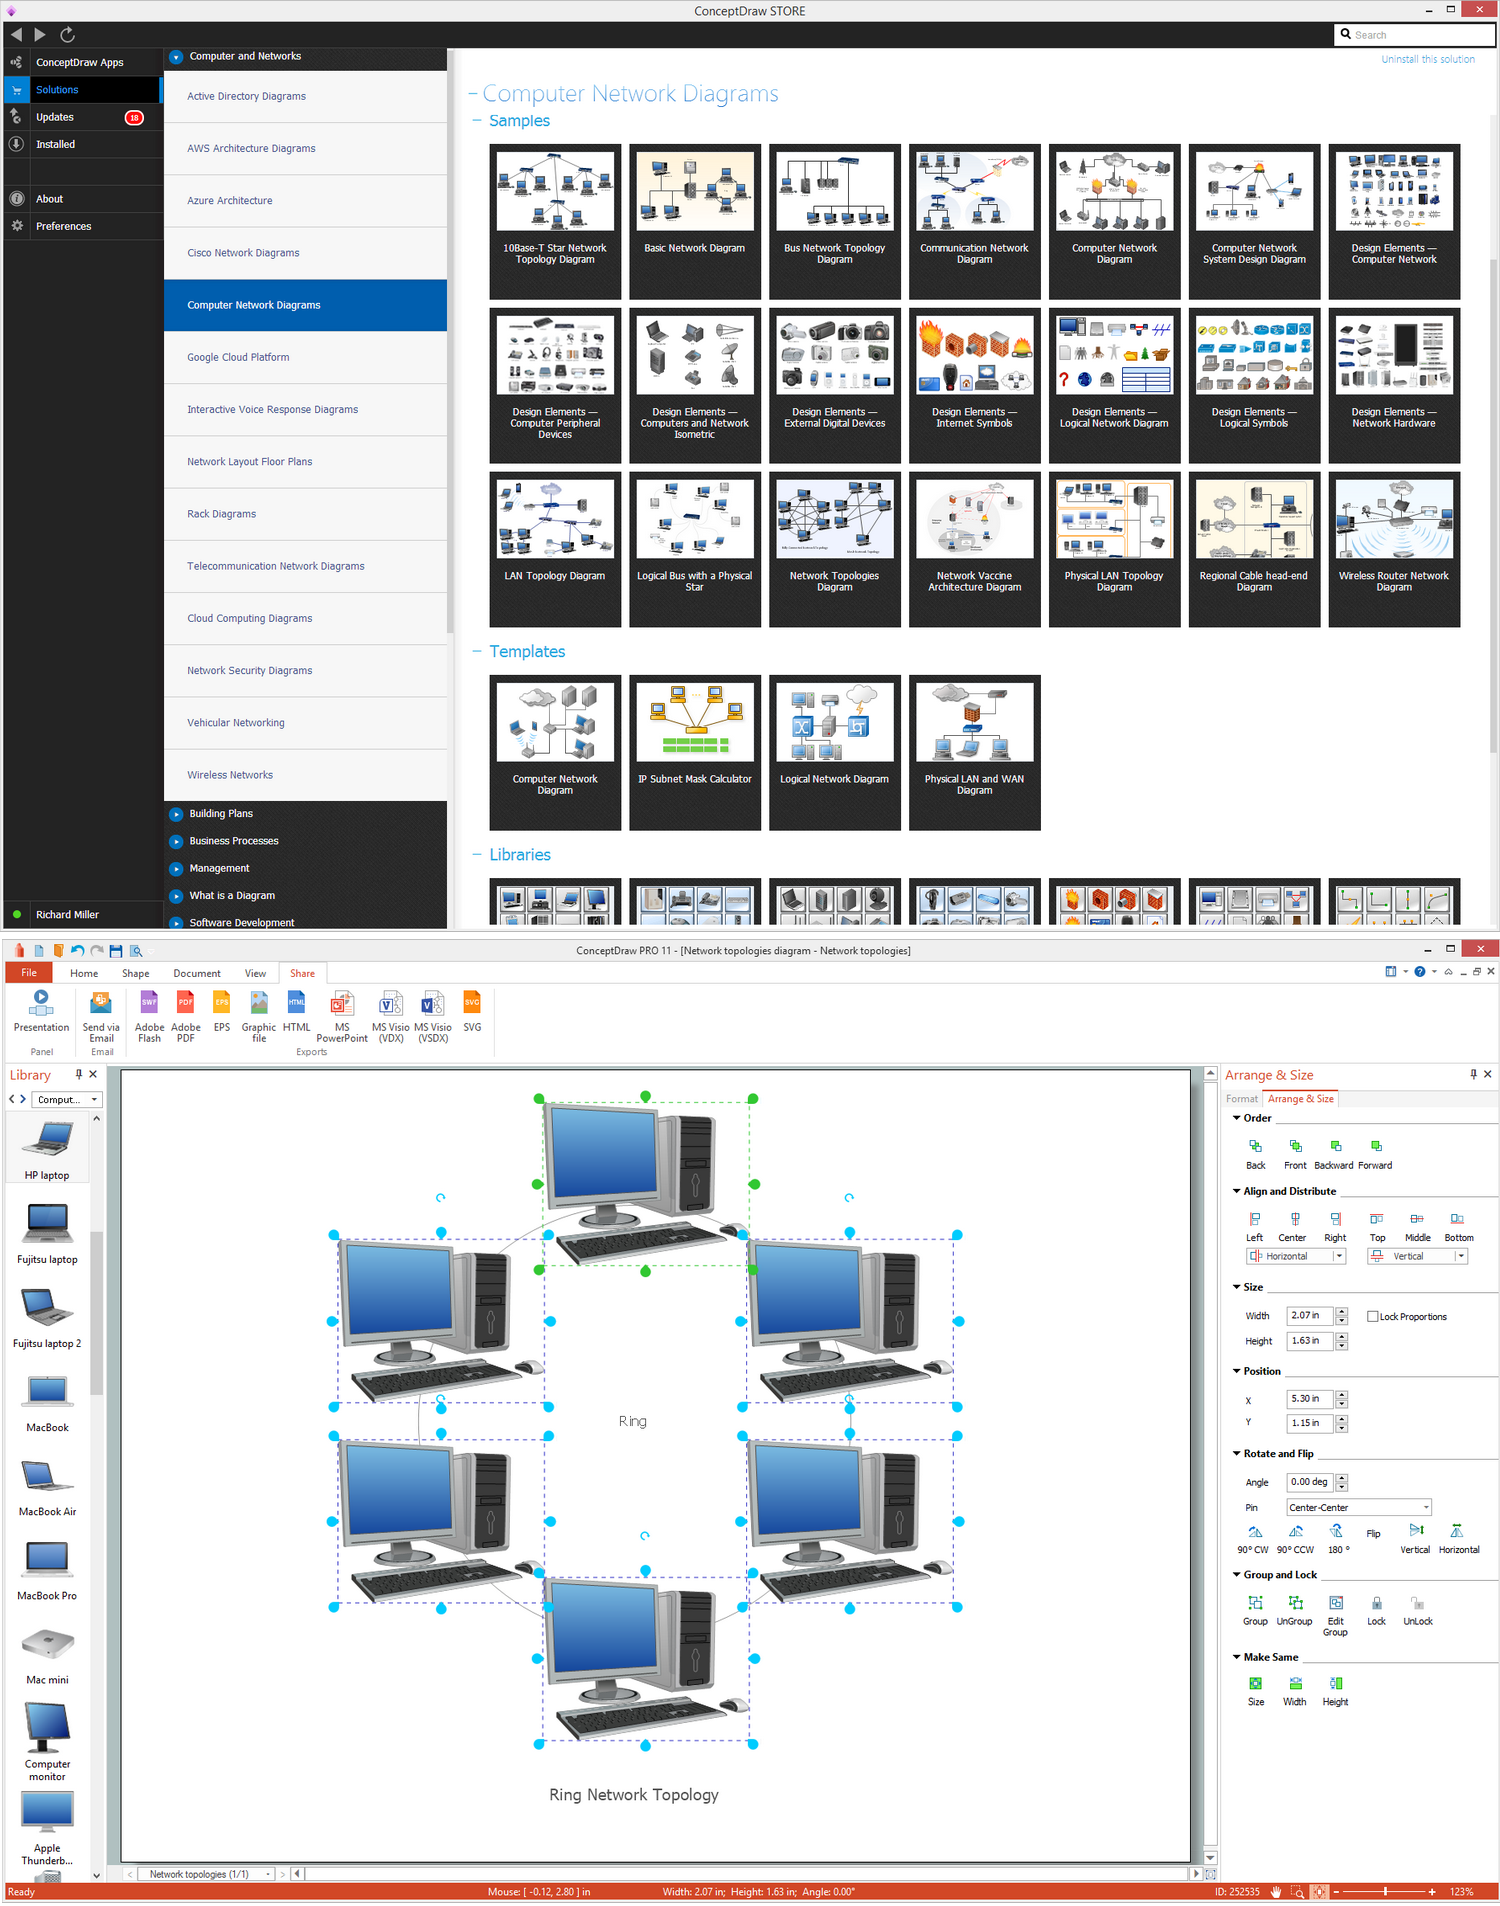
Ring Network Topology
The Ring Network Topology Diagram examples was created using ConceptDraw PRO software with Computer and Networks solution.Vertical Cross Functional Flowchart
ConceptDraw PRO is a powerful tool that helps you create professional looking cross-functional flowcharts with the well-designed objects. ConceptDraw PRO - Drawing Software for Vertical Cross Functional Flowchart. ConceptDraw allows you to focus on work, not the drawing process. ConceptDraw Arrows10 Technology allows to draw connectors with smart behavior that gives flexibility to you during work process.How to Draw Pictorial Chart. How to Use Infograms
How to draw pictorial chart quick, easy and effective? ConceptDraw PRO offers the unique Pictorial Infographics Solution that will help you! Pictorial Infographics solution contains large number of libraries with variety of predesigned vector pictograms that allows you design infographics in minutes. There are available 10 libraries with 197 vector pictograms.Network Topologies
Network topology is a topological structure of computer network, which can be physical or logical. The physical topology depicts location of different computer network elements such as computers, cables and other devices. The logical topology visually displays network dataflows from one device to another. Sometimes network logical and physical topologies can be the same. ConceptDraw PRO diagramming and vector drawing software is powerful for drawing network maps and network topologies diagrams of any kinds and complexity thanks to the Computer Network Diagrams solution from the Computer and Networks area. ConceptDraw STORE proposes collection of network icons libraries and a lot of Network Topology Diagram examples, samples and templates which were created at ConceptDraw PRO software specially for Computer Network Diagrams solution. There are six basic types of the network topologies: Bus, Star, Ring, Mesh, Tree, Fully Connected. You can fast and easy design professional-looking diagram for each of them using the ConceptDraw PRO tools. There are plenty of web Visio-like diagramming software available. Web based diagrams software can be powerful, but sometimes it is essential to have desktop software. One of the most advanced diagrams tools like Visio for Mac OS is ConceptDraw PRO app.
Chart Maker for Presentations
Easy charting software comes with beautiful chart templates and examples. This makes it easy to create professional charts without prior experience.How To Create a Workflow Diagram
A workflow diagram is less general notation than a process flow diagram. Workflow as a term can apply to organizational process which involves people, resources, documents, sort of data, for instance; whereas a process is general collection of steps occuring in any sort of activity. That is why process flow diagram can be used as workflow diagram to describe business process, data flow or department interactions. The fastest way to create a workflow diagram is using pre-designed workflow template. ConceptDraw PRO with the Workflow Diagrams solution delivers rich set of workflow diagram templates you may start from.UML Use Case Diagram Example Social Networking Sites Project
UML Diagrams Social Networking Sites Project. This sample was created in ConceptDraw PRO diagramming and vector drawing software using the UML Use Case Diagram library of the Rapid UML Solution from the Software Development area of ConceptDraw Solution Park. This sample shows the Facebook Socio-health system and is used at the projection and creating of the social networking sites.
 Directional Maps
Directional Maps solution extends ConceptDraw PRO software with templates, samples and libraries of vector stencils for drawing the directional, location, site, transit, road and route maps, plans and schemes.
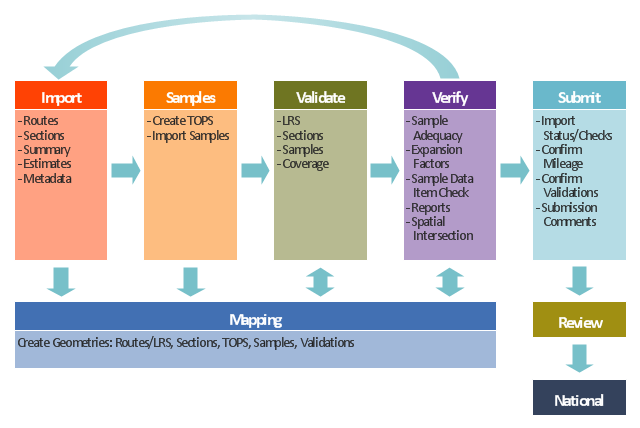
This TQM diagram example was redesigned from the illustration of the Highway Performance Monitoring System (HPMS) Field Manual from the website of the Federal Highway Administration (FHWA).
[fhwa.dot.gov/ policyinformation/ hpms/ fieldmanual/ chapter7.cfm]
"Highway Performance Monitoring System (HPMS).
The HPMS is a national level highway information system that includes data on the extent, condition, performance, use and operating characteristics of the nation's highways. The HPMS contains administrative and extent of system information on all public roads, while information on other characteristics is represented in HPMS as a mix of universe and sample data for arterial and collector functional systems. Limited information on travel and paved miles is included in summary form for the lowest functional systems.
HPMS was developed in 1978 as a continuing database, replacing the special biennial condition studies that had been conducted since 1965. The HPMS has been modified several times since its inception. Changes have been made to reflect changes in the highway systems, legislation, and national priorities, to reflect new technology, and to consolidate or streamline reporting requirements." [fhwa.dot.gov/ policyinformation/ hpms.cfm]
The TQM flowchart example "Software workflow diagram" was created using the ConceptDraw PRO diagramming and vector drawing software extended with the Total Quality Management (TQM) Diagrams solution from the Quality area of ConceptDraw Solution Park.
Workflow Diagram
Workflow diagram is a perfect tool to represent visually a repeatable pattern of organizational activity that is powered by resources and to describe in details the transferring of data, documents or tasks during a work process. It effectively explains and documents the process flow that exists and that requires the studying, analyzing and execution. Workflow diagrams help to represent the working processes in a simple visual manner, to follow easy the path of a task in a workflow, to identify the persons responsible for the execution of each stage, to show the accompanied documents and needed resources. All this helps to optimize the workflow and to discover its weak points. Workflow diagrams are mainly designed and used as a part of project documentation, certification process and company policies to comply the standards. To design professionally the Workflow diagrams, use the ConceptDraw PRO software. Enhanced with Workflow Diagrams solution from the Business Processes area, the ConceptDraw PRO it is a powerful workflow diagram maker.Spatial infographics Design Elements: Location Map
Infographic Design Elements for visually present various geographically distributed information.Directions Map
ConceptDraw PRO is a powerful diagramming and vector drawing software. Extended with Directional Maps Solution from the Maps Area of ConceptDraw Solution Park, it became the best software for quick and easy designing Directions Map of any complexity.
 USA Maps
Use the USA Maps solution to create a map of USA, a US interstate map, printable US maps, US maps with cities and US maps with capitals. Create a complete USA states map.
- Flow chart Example . Warehouse Flowchart | How to Draw Pictorial ...
- Flow chart Example . Warehouse Flowchart | Workflow Diagram ...
- Geo Mapping Software Examples - World Map Outline | Process ...
- Process Flowchart | Copying Service Process Flowchart . Flowchart ...
- Contoh Flowchart | Contoh Dfd Travel
- Flow chart Example . Warehouse Flowchart | Travel and tourism ...
- Flow chart Example . Warehouse Flowchart | Audio, Video, Media ...
- Flow chart Example . Warehouse Flowchart | IVR services | Windows ...
- Flowchart | Flowchart Definition | Audit Flowcharts | Sample Of ...
- Cross-Functional Flowchart (Swim Lanes) | Swim Lane Flowchart ...
- Travel Business Flow Charts
- Travel Agency Organizational Chart Sample
- Flow chart Example . Warehouse Flowchart | UML Use Case ...
- Flow chart Example . Warehouse Flowchart | Computer and ...
- Flow chart Example . Warehouse Flowchart | Aerospace and ...
- Flow chart Example . Warehouse Flowchart | UML Use Case ...
- Flow chart Example . Warehouse Flowchart | UML Use Case ...
- Flow chart Example . Warehouse Flowchart | UML Use Case ...
- Process Flowchart | Travel and tourism pictograms - Vector stencils ...
- Internal Control Flowchart Example


