HelpDesk
How To Create Risk Diagram (PDPC) Using Solutions
Risk diagram is used to identify possible risks in accomplishing corrective actions. With the Risks diagram, one analyzes each action separately in a tree of all actions and develops a preventive action in response to each potential obstacles or circumstances which may be a risk. The ability to create a Risk diagram from a mind map is supported by the ConceptDraw Seven Management and Planning Tools solution. This article describes how to identify possible risks when carrying out corrective actions, and define preventive actions.CORRECTIVE ACTIONS PLANNING. Risk Diagram (PDPC)
Risk Diagram (PDPC) - ConceptDraw Office suite is a software for Risks Diagram making. This diagram identifies possible risks in accomplishing corrective actions. With the Risks Diagram, one analyzes each action separately in a tree of all actions and develops a preventive action in response of each potential obstacles or circumstances which may be a risk.
"Process Decision Program Chart (PDPC).
A useful way of planning is to break down tasks into a hierarchy, using a tree diagram. The PDPC extends the tree diagram a couple of levels to identify risks and countermeasures for the bottom level tasks. Different shaped boxes are used to highlight risks and identify possible countermeasures (often shown as 'clouds' to indicate their uncertain nature). The PDPC is similar to the Failure Modes and Effects Analysis (FMEA) in that both identify risks, consequences of failure, and contingency actions; the FMEA also rates relative risk levels for each potential failure point." [Seven Management and Planning Tools. Wikipedia]
The Risk diagram (process decision program chart, PDPC) determines the risks when corrective action is not performed correctly. Also, it helps develop descriptions for preventive actions at the level of execution.
The Risk diagram (PDPC) template for the ConceptDraw PRO diagramming and vector drawing software is included in the solution "Seven Management and Planning Tools" from the Management area of ConceptDraw Solution Park.
Preventive Action
Preventive Action - ConceptDraw Office suite is a software for the Preventive Action making. The Seven Management and Planning Tools solution is a set of such tools for problems preventive actions via investigating of the core problem. Skilled use of these diagrams makes collaborative teamwork both more engaging and more effective.
 Seven Management and Planning Tools
Seven Management and Planning Tools solution extends ConceptDraw DIAGRAM and ConceptDraw MINDMAP with features, templates, samples and libraries of vector stencils for drawing management mind maps and diagrams.
Corrective Action Planning
One of the stages of the problem's solving process scenario is Corrective Action Planning. Corrective action planning define people and groups involvement in corrective actions by roles, identify logical sequences of scheduled actions and critical path of problem solving, identify possible risks of action plan and propose preventive actions.
HelpDesk
How to Manage Problem Solving Using Seven Management and Planning Tools
Stage by stage gouide on using visual tools to move toward solving the problem.
Risk Analysis
Risk Analysis. ConceptDraw Office suite is a software for decision making. The Seven Management and Planning Tools is a tool for Risks Diagram drawing. This diagram identifies possible risks in accomplishing corrective actions. With the Risks Diagram, one analyzes each action separately in a tree of all actions and develops a preventive action in response of each potential obstacles or circumstances which may be a risk.
The Action Plan
Action Plan - For the action planning define people and groups involvement in corrective actions by roles, identify logical sequences of scheduled actions and critical path of problem solving, identify possible risks of action plan and propose preventive actions. ConceptDraw Office suite is a software for decision making and action plan.
Risk Diagram (Process Decision Program Chart)
The risk is a probable event in result of which may occur the negative events and adverse consequences. The risk management is a very important process in any field, it is a process of making the management decisions aimed on the reducing the likelihood of appearing the unfavorable results and on the minimizing potential losses, as well as the implementation of these solutions. The main purpose of applying the risk management is increasing of enterprise's competitiveness with help of protection against the risks. ConceptDraw MINDMAP software is perfect for identifying the risks, analyzing and managing risks, for designing Risk Diagrams, for developing effective actions in response to circumstances and potential obstacles that were identified as risks. It is also the best for designing Process Decision Program Charts and representing the PDPC method, which is effective way of detailed planning and depiction the whole sequence of actions on the path from the formulation a problem to its solution. The PDPC lets determine the risks when corrective actions are not performed correctly and helps develop descriptions for preventive actions.SDL Diagram
Specification and Description Language (SDL) is used for creating the object-oriented diagrams, visualizing the processes of the state machines for the systems of communication, telecommunication, automotive, aviation and medical industries. SDL is a specification language for creating specifications, descriptions of the behavior, data, and inheritance for real-time systems. This sample shows the SDL Diagram of the process game.Flowcharts in Word
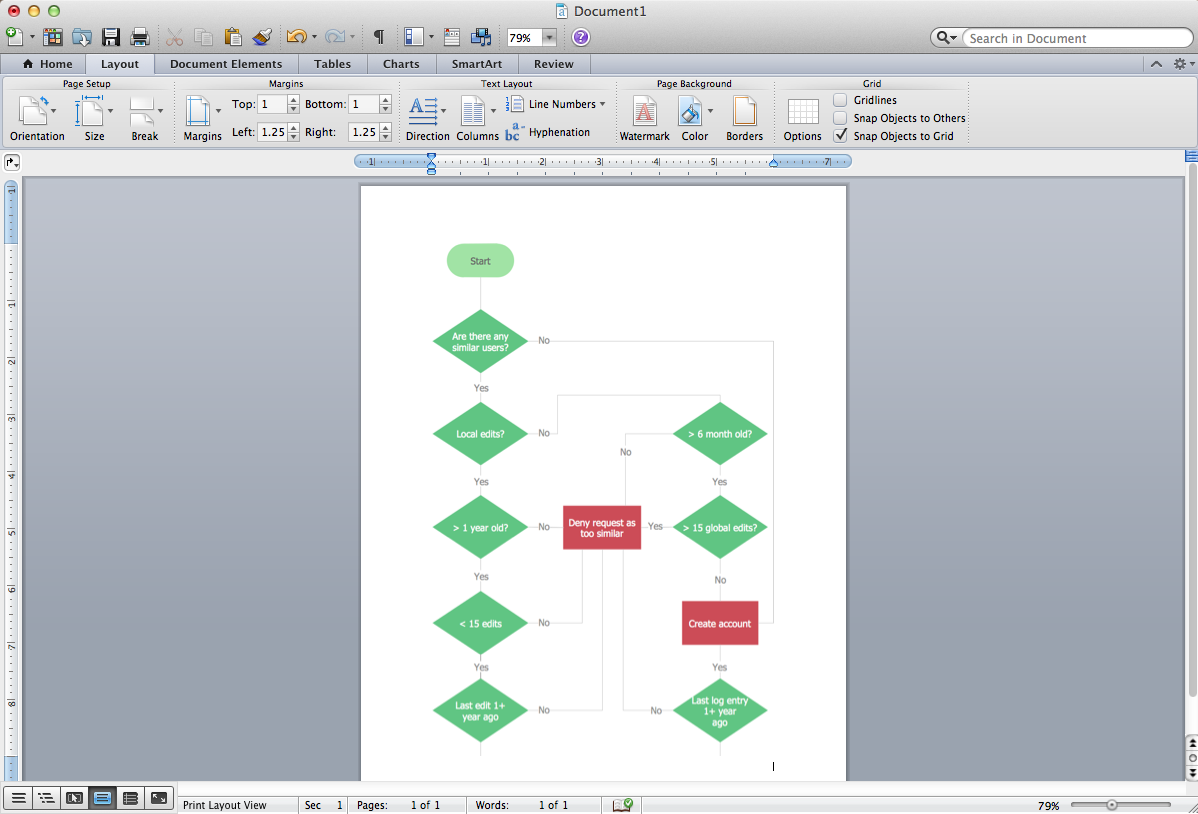
To create flowcharts in MS Word, programs designed specifically for the purpose of creating flowcharts are particularly well-suited to the task.
 Seven Management and Planning Tools
Seven Management and Planning Tools solution extends ConceptDraw DIAGRAM and ConceptDraw MINDMAP with features, templates, samples and libraries of vector stencils for drawing management mind maps and diagrams.
Hybrid Network Topology
A network topology is the topological structure or the arrangement of different elements of computer network. There are several basic types of network topologies, such as star, ring, bus, mesh. But the most popular is a combination of two or more diverse basic network topologies, which is known as hybrid network topology. The examples of hybrid topology are: star-bus, star-ring topologies, etc. Each resulting hybrid topology has its own features, advantages and limitations of its components. Hybrid network topologies are more flexible, reliable, and have increased fault tolerance, the faults in them can be easily diagnosed and corrected, new nodes can be easily added. But at the same time hybrid topologies often are sufficiently expensive and difficult for managing. ConceptDraw DIAGRAM diagramming and vector drawing software supplied with the tools of Computer Network Diagrams solution from Computer and Networks area is perfect for schematic description various types of computer network topologies and easy designing Hybrid network topology diagrams.7 Management & Planning Tools
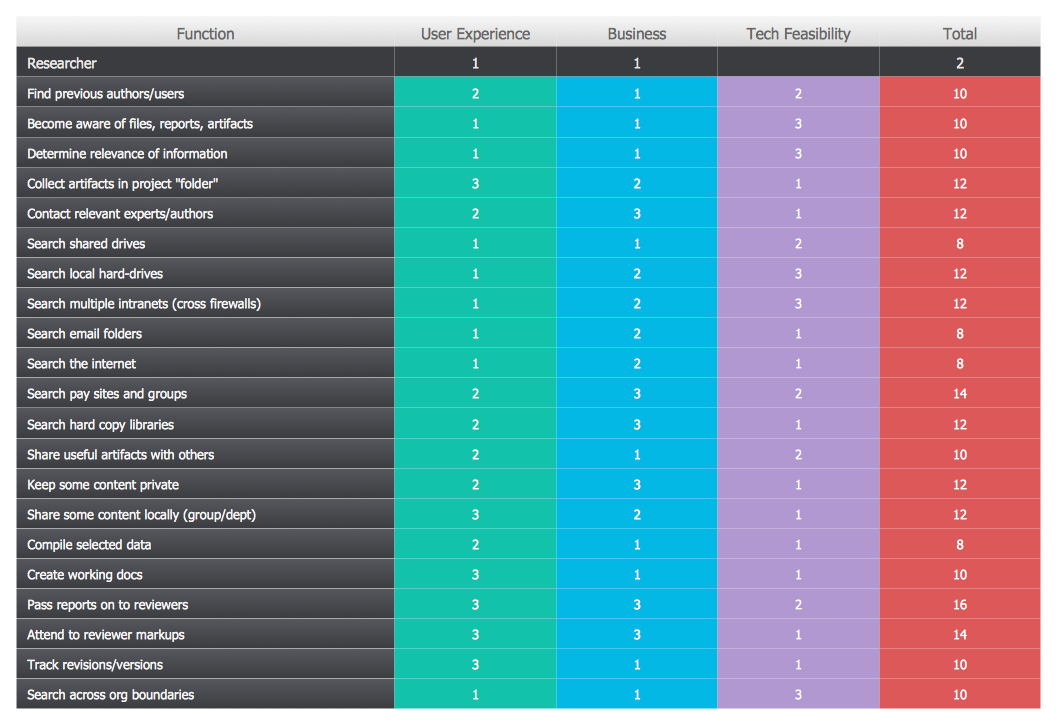
The 7 Management and Planning Tools solution available from ConceptDraw Solution Park implements well-known methodologies and provides the comprehensive set of tools for problems' analysis and solving. Different products from multifunctional ConceptDraw Office suite may be used as a complete solution for any of methodologies offered by this solution and provide a visual communication during every stage of work. Use the MINDMAP 7 Management & Planning Tools for step-by-step identification and analysis the problems, for planning solving and corrective actions, and also countermeasures to address the risks. 7 Management and Planning Tools solution is perfect for managers in medium to large companies, who require effective tools to address the management issue, for business consultants, trainers and coaches to help visualize the problem's solving by using 7 MP Tools methodology, to structure the problem's affecting factors, analyze their root causes and cause and effect relations, to highlight drivers and indicators factors, to prioritize factors using ranking by criteria set."Root cause analysis (RCA) is a method of problem solving that tries to identify the root causes of faults or problems.
RCA practice tries to solve problems by attempting to identify and correct the root causes of events, as opposed to simply addressing their symptoms. Focusing correction on root causes has the goal of preventing problem recurrence. RCFA (Root Cause Failure Analysis) recognizes that complete prevention of recurrence by one corrective action is not always possible.
Conversely, there may be several effective measures (methods) that address the root causes of a problem. Thus, RCA is an iterative process and a tool of continuous improvement.
RCA is typically used as a reactive method of identifying event(s) causes, revealing problems and solving them. Analysis is done after an event has occurred. Insights in RCA may make it useful as a preemptive method. In that event, RCA can be used to forecast or predict probable events even before they occur. While one follows the other, RCA is a completely separate process to Incident Management." [Root cause analysis. Wikipedia]
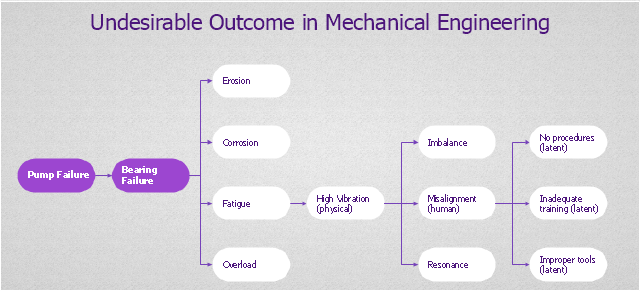
The root cause analysis (RCA) tree diagram example "Manufacturing problem solution" was created using the ConceptDraw PRO diagramming and vector drawing software extended with the solution "Seven Management and Planning Tools" from the Management area of ConceptDraw Solution Park.
Identifying Quality Management System
The Total Quality Management Diagram solution helps your organization visualize business and industrial processes. Create Total Quality Management diagrams for business process with ConceptDraw software."Root cause analysis (RCA) is a method of problem solving that tries to identify the root causes of faults or problems. ...
RCA (in steps 3, 4 and 5) forms the most critical part of successful corrective action, because it directs the corrective action at the true root cause of the problem. Knowing the root cause is secondary to the goal of prevention, but without knowing the root cause, it is not possible to determine what an effective corrective action for the defined problem would be. ...
3. Ask "why" and identify the causes associated with each step in the sequence towards the defined problem or event. "Why" is taken to mean "What were the factors that directly resulted in the effect?"
4. Classify causes into causal factors that relate to an event in the sequence and root causes, that if eliminated, can be agreed to have interrupted that step of the sequence chain.
5. Identify all other harmful factors that have equal or better claim to be called "root causes." If there are multiple root causes, which is often the case, reveal those clearly for later optimum selection." [Root cause analysis. Wikipedia]
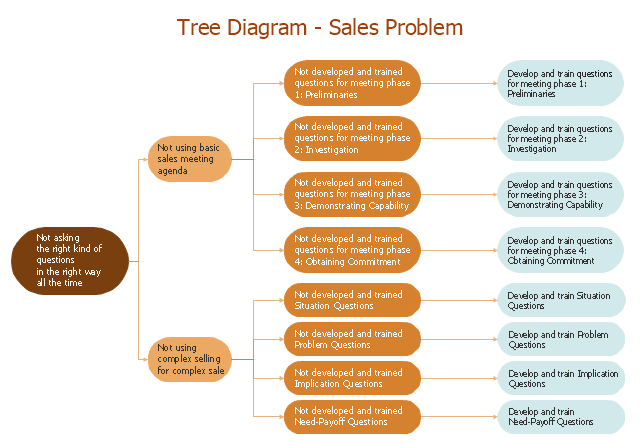
This root cause analysis (RCA) tree diagram example "Sale problem solution" was created using the ConceptDraw PRO diagramming and vector drawing software extended with the Seven Management and Planning Tools solution from the Management area of ConceptDraw Solution Park.
"Waste minimization is the process and the policy of reducing the amount of waste produced by a person or a society.
Waste minimization involves efforts to minimize resource and energy use during manufacture. For the same commercial output, usually the fewer materials are used, the less waste is produced. Waste minimization usually requires knowledge of the production process, cradle-to-grave analysis (the tracking of materials from their extraction to their return to earth) and detailed knowledge of the composition of the waste. ...
In the waste hierarchy, the most effective approaches to managing waste are at the top. In contrast to waste minimisation, waste management focuses on processing waste after it is created, concentrating on re-use, recycling, and waste-to-energy conversion." [Waste minimisation. Wikipedia]
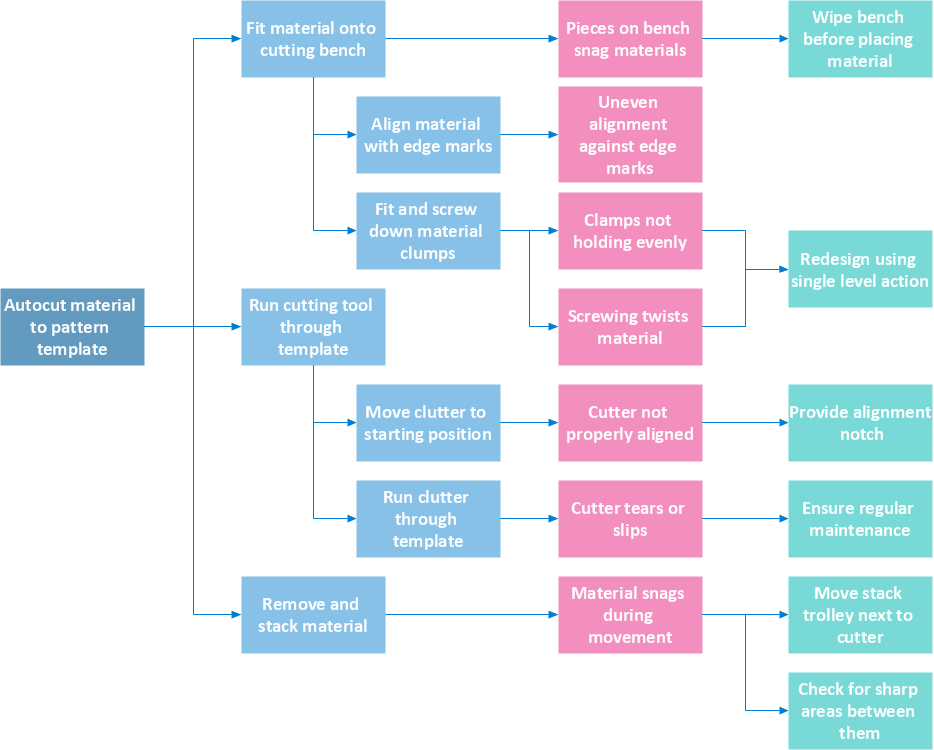
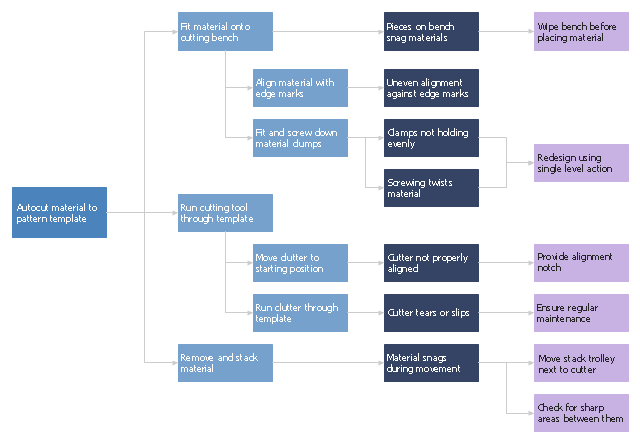
The process decision program chart (PDPC) example "Minimization of material wastage" was created using the ConceptDraw PRO diagramming and vector drawing software extended with the solution "Seven Management and Planning Tools" from the Management area of ConceptDraw Solution Park.
How to Use Skype for Sharing Documents
Sharing Documents Trough Skype: Share files, manage projects, inspire ideas, connect people.
- The Action Plan | CORRECTIVE ACTIONS PLANNING. PERT Chart ...
- CORRECTIVE ACTIONS PLANNING. Risk Diagram (PDPC) | Risk ...
- The Action Plan | Corrective Action Planning | Preventive Action ...
- Process Flow Chart | Preventive Action | CORRECTIVE ACTIONS ...
- PDPC | CORRECTIVE ACTIONS PLANNING. Risk Diagram (PDPC ...
- CORRECTIVE ACTIONS PLANNING. Risk Diagram (PDPC) | How ...
- PDPC | Risk diagram (PDPC) - Template | Preventive Action | Pdpc ...
- CORRECTIVE ACTIONS PLANNING Risk Diagram (PDPC ...
- Preventive Action | Decision Making Problem Analysis And Solving
- Preventive Action | Risk Analysis | The Action Plan | Preventive ...


---template.png--diagram-flowchart-example.png)

