HelpDesk
How to Determine what Information to be Displayed in the Project Resource List
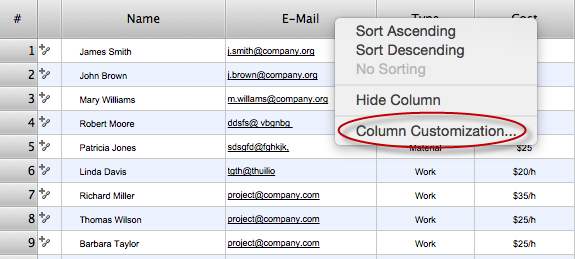
After you create a project task list it is necessary move to resource planning. You need to determine and assign resources on each task. There are several types of resources defined in ConceptDraw PROJECT: work, material, cost and equipment. The columns of a project Resource List in ConceptDraw PROJECT displays the information you need to capture about each resource in your project.
HelpDesk
How to Set a Project Baseline Using ConceptDraw PROJECT
Project baseline in ConceptDraw PROJECT is excellent forguiding the execution of the current project and can be useful for further projects.Produce Professional Diagrams More Quickly, Easily and Cost Effectively
ConceptDraw Arrows10 Technology - This is more than enough versatility to produce professional diagrams more quickly. Professional diagramming software for mac helps you create variety diagrams, graphics, charts, live dashboards and plenty of graphics and pictures for your business and study.HelpDesk
What Information can be Displayed in the Multiproject Dashboard View
What information can can contain the projects list
HelpDesk
What Information to be Displayed in the ConceptDraw PROJECT Gantt Chart View
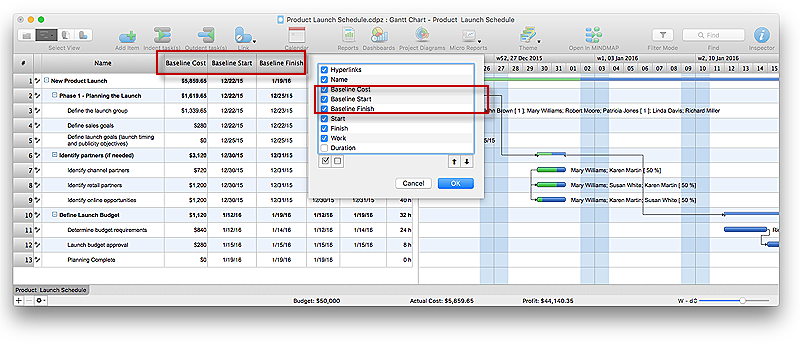
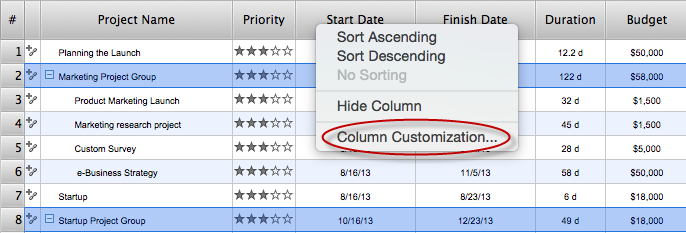
What information can can contain the project task list? Gantt Chart view is a graphical representation of a project outline that allows one to allocate tasks.You can customize a project’s tasks list view to include the columns you need to meet your information requirements. The columns of the ConceptDraw PROJECT Gantt view contain the information you want to capture about each task in your project. The following article details what information can be contained in the columns of a project outline:<
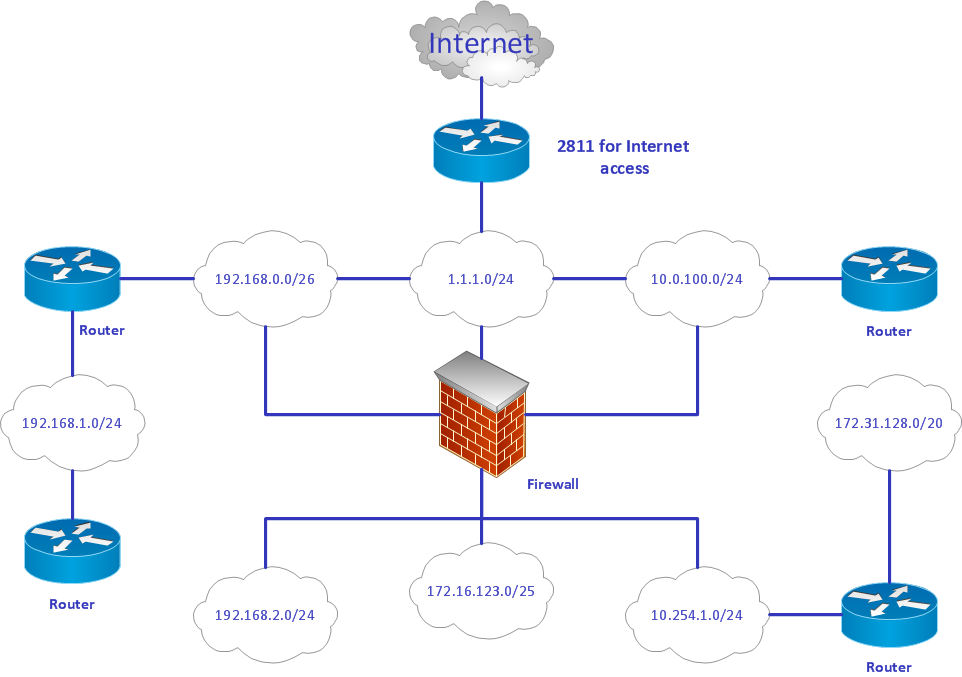
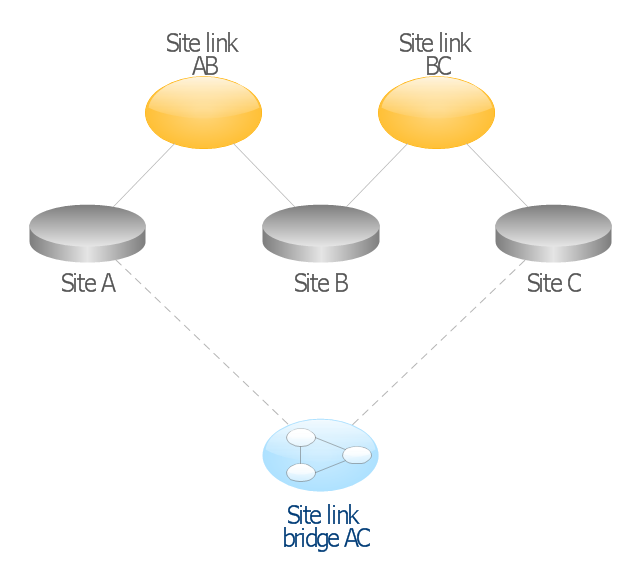
This AD diagram example was redesigned from the picture "Site links" from the book "Active Directory for Dummies".
"Site links represent the Active Directory replication paths between sites.
These paths are manually defined so that the designer has control over which network links the replication traffic occurs on. These site links also control how clients are directed to domain controllers when there’s no DC in the client’s local site. Each site link has the following attributes:
(1) Connected sites: A site link is defined by the sites to which it connects. A site link can connect two or more sites together.
(2) Network transport: Site links support replication communication over IP-based RPCs or with the Simple Mail Transport Protocol (SMTP). You normally want to use RPC whenever possible, but you can use SMTP when the sites you’re linking don’t support RPC.
(3) Cost: Each site link has a cost associated with it. Costs are used to assign preferences to links that determine which link should be followed when multiple link paths are available between sites. The cost represents what it “costs” to use this site link relative to the other site links and affects replication traffic as well as how users are assigned a domain controller. Links with lower cost values have preference over links with higher cost values. Cost values range from 1–32,767; the default being 100.
(4) Frequency: The frequency value defines how often a replication occurs
when using this site link (the replication latency). You can configure the time between replications from a minimum of 15 minutes to a maximum of 10,080 minutes (one week). The default frequency is 180 minutes.
(5) Schedule: The schedule dictates when this link is active and available for replication between the sites. The schedule can also control which days of the week the link is available. Normally, the schedule is set so that the link is available 24 hours a day, but you can set up different schedules on a per-day-of-the-week basis.
By creating a site link, you enable two or more sites to be connected and to share the same site link attributes (transport, cost, frequency, and schedule). By default, site links create transitive connectivity between sites.
If you create a site link between sites A and B and another site link between
sites B and C, an automatic connection (known as a site link bridge) is created between sites A and C..." [Steve Clines and Marcia Loughry, Active Directory® For Dummies®, 2nd Edition. 2008]
The Active Directory diagram example "Site links" was created using the ConceptDraw PRO diagramming and vector drawing software extended with the Active Directory Diagrams solution from the Computer and Networks area of ConceptDraw Solution Park.
The vector stencils library "Sales KPIs and Metrics" contains 15 chart templates and graphic indicators of sales key performance indicators (KPIs) and metrics.
Use it for drawing sales dashboards in the ConceptDraw PRO diagramming and vector drawing software extended with the Sales Dashboard solution from the Marketing area of ConceptDraw Solution Park.
Use it for drawing sales dashboards in the ConceptDraw PRO diagramming and vector drawing software extended with the Sales Dashboard solution from the Marketing area of ConceptDraw Solution Park.
Project — Working With Costs
ConceptDraw PROJECT delivers a rich set of built-in functionalities and optional product extensions that support your daily workflow in time-saving and creative ways. This video lesson will teach you how to work with costs in your project document.The vector stencils library "HR workflow" contains 60 HR workflow symbols.
Use this HR icon set to draw your HR flowcharts, workflow diagrams and process charts with the ConceptDraw PRO diagramming and vector drawing software.
The HR pictograms library "HR workflow" is included in the HR Flowcharts solution from the Management area of ConceptDraw Solution Park.
Use this HR icon set to draw your HR flowcharts, workflow diagrams and process charts with the ConceptDraw PRO diagramming and vector drawing software.
The HR pictograms library "HR workflow" is included in the HR Flowcharts solution from the Management area of ConceptDraw Solution Park.
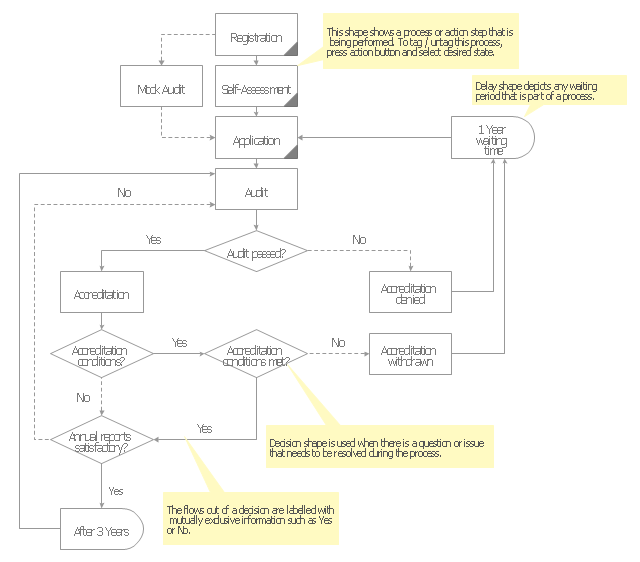
Audit flowcharts (audit diagrams) visualize business processes as financial transactions and inventory management. They are used to develop, analyse and present the audit processes.
"Auditing is a vital part of accounting. Traditionally, audits were mainly associated with gaining information about financial systems and the financial records of a company or a business.
Financial audits are performed to ascertain the validity and reliability of information, as well as to provide an assessment of a system's internal control. The goal of an audit is to express an opinion of the person / organization / system (etc.) in question, under evaluation based on work done on a test basis.
Due to constraints, an audit seeks to provide only reasonable assurance that the statements are free from material error. Hence, statistical sampling is often adopted in audits. In the case of financial audits, a set of financial statements are said to be true and fair when they are free of material misstatements – a concept influenced by both quantitative (numerical) and qualitative factors. But recently, the argument that auditing should go beyond just true and fair is gaining momentum. ...
Cost accounting is a process for verifying the cost of manufacturing or producing of any article, on the basis of accounts measuring the use of material, labor or other items of cost. In simple words, the term, cost audit means a systematic and accurate verification of the cost accounts and records, and checking for adherence to the cost accounting objectives. ...
An audit must adhere to generally accepted standards established by governing bodies. These standards assure third parties or external users that they can rely upon the auditor's opinion on the fairness of financial statements, or other subjects on which the auditor expresses an opinion." [Audit. Wikipedia]
The Audit flowchart template for the ConceptDraw PRO diagramming and vector drawing software is included in the Audit Flowcharts solution from the Finance and Accounting area of ConceptDraw Solution Park.
The vector stencils library "Sales KPIs and Metrics" contains 15 chart templates and graphic indicators of sales key performance indicators (KPIs) and metrics.
Use it for drawing sales dashboards in the ConceptDraw PRO diagramming and vector drawing software extended with the Sales Dashboard solution from the Marketing area of ConceptDraw Solution Park.
Use it for drawing sales dashboards in the ConceptDraw PRO diagramming and vector drawing software extended with the Sales Dashboard solution from the Marketing area of ConceptDraw Solution Park.
- Cost Management Process Flow Chart
- Leadership and data - Circle-spoke diagram | Circle Diagrams | Cost ...
- How to Report Task's Execution with Gantt Chart | How to Create ...
- Calculate the cost of creating or updating a wireless computer network
- Fully Connected Network Topology Diagram | Calculate the cost of ...
- Gnatt Chart Cost Of Media
- What Is a Wireless Network? | Calculate the cost of creating or ...
- Cost Evaluation And Review Technique
- Network Diagram Software | Calculate the cost of creating or ...
- UML object diagram - Estimating scenario | UML Tool & UML ...
- New Connectors Technology | Produce Professional Diagrams More ...
- 3D Network Diagram Software | Wireless Network Setup | Calculate ...
- Ms Visio Cost
- Accounting Flowcharts | How to Create Flowcharts for an Accounting ...
- Flow Chart Of Cost Accounting
- Cost per customer
- Cost per order
- Drawing Of Active Directory Configuration
- Cost Estimate
- Chart Flow Of Elements Of Cost



-hr-workflow---vector-stencils-library.png--diagram-flowchart-example.png)


-hr-workflow---vector-stencils-library.png--diagram-flowchart-example.png)


