The vector stencils library "Management pictograms" contains 72 management pictograms.
Use it to create your management infogram in the ConceptDraw PRO diagramming and vector drawing software.
The flat icons example "Management pictograms - Vector stencils library" is included in the solution "Marketing infographics" from the "Business infographics" area of ConceptDraw Solution Park.
Use it to create your management infogram in the ConceptDraw PRO diagramming and vector drawing software.
The flat icons example "Management pictograms - Vector stencils library" is included in the solution "Marketing infographics" from the "Business infographics" area of ConceptDraw Solution Park.
 ConceptDraw Solution Park
ConceptDraw Solution Park collects graphic extensions, examples and learning materials
 Kanban Board
Kanban Board solution offers an effective way to build the Kanban boards in an electronic view. This solution includes a lot of Kanban Board samples and the great number of predesigned vector design objects of Task Boards, basic symbols, and icons of caution and markers, communication, complete and numbers, emoji and priorities, sticky notes, and team members. Use all advantages of the Kanban boards, Kanban board agile and ConceptDraw’s Kanban Board solution tools, start with any included Kanban Board example and improve your workflow efficiency and personal effectiveness.
The vector stencils library "Management pictograms" contains 72 management pictograms.
Use it to create your management infogram in the ConceptDraw PRO diagramming and vector drawing software.
The flat icons example "Management pictograms - Vector stencils library" is included in the solution "Marketing infographics" from the "Business infographics" area of ConceptDraw Solution Park.
Use it to create your management infogram in the ConceptDraw PRO diagramming and vector drawing software.
The flat icons example "Management pictograms - Vector stencils library" is included in the solution "Marketing infographics" from the "Business infographics" area of ConceptDraw Solution Park.
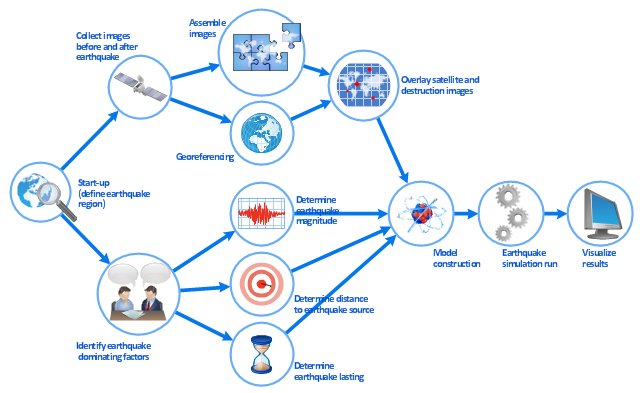
This work flow chart sample was redesigned from the picture "Simulation for earthquake disaster assessment" from the article "Simulation Workflows".
[iaas.uni-stuttgart.de/ forschung/ projects/ simtech/ sim-workflows.php]
" This simulation was developed to have an in depth understanding of the destructions and the decisions to be made in various phases of crisis management (Source: Mahdi Hashemi and Ali A. Alesheikh (2010). "Developing an agent based simulation model for earthquakes in the context of SDI." GSDI 12 World Conference. 19 – 22 October 2010. Singapour). The simulation process contains following major steps:
(1) All spatial information including satellite images (before and after the earthquake) and topographic/ cadastral maps of the area are mosaicked and georeferenced. The parts of the city that contain various levels of destructions are selected. Three types of features namely buildings, roads and recreational areas are classified and extracted from the satellite images.
(2) The governing factors of destructions are identified; a mathematical model that integrates the factors is constructed.
(3) The simulation is constructed for various parameter values (different earthquake strength, time elapses, etc.)" [iaas.uni-stuttgart.de/ forschung/ projects/ simtech/ sim-workflows.php]
The example "Workflow diagram - Earthquake disaster assessment" was drawn using the ConceptDraw PRO diagramming and vector drawing software extended with the Workflow Diagrams solution from the Business Processes area of ConceptDraw Solution Park.
 Basic Circular Arrows Diagrams
Basic Circular Arrows Diagrams solution extends ConceptDraw DIAGRAM with predesigned samples and a library of vector stencils allowing one to create the Circular Arrows diagrams for any purpose or need. Start with one desired of ready-made vector stencils or samples, use it as a circular flow diagram template and make the Circular Arrow Diagram with the required quantity of sectors in a few minutes. Finally, customize your diagram, make stylish changes using the contrasting colors for different steps or identical for some of them, to highlight the most important steps, so designing a diagram the best fitting your taste.
 Circular Arrows Diagrams
Circular Arrows Diagrams solution extends ConceptDraw DIAGRAM with extensive drawing tools, predesigned samples, Circular flow diagram template for quick start, and a library of ready circular arrow vector stencils for drawing Circular Arrow Diagrams, Segmented Cycle Diagrams, and Circular Flow Diagrams. The elements in this solution help managers, analysts, business advisers, marketing experts, scientists, lecturers, and other knowledge workers in their daily work.
 Business Diagrams
The Business Diagrams Solution extends ConceptDraw DIAGRAM with an extensive collection of professionally designed illustrative samples and a wide variety of vector stencils libraries, which are the real help for all business-related people, business analysts, business managers, business advisers, marketing experts, PR managers, knowledge workers, scientists, and other stakeholders allowing them to design the bright, neat, expressive and attractive Bubble Diagrams, Circle-Spoke Diagrams, Circular Arrows Diagrams, and Venn Diagrams with different quantity of sets in just minutes; and then successfully use them in documents, reports, statistical summaries, and presentations of any style.
 Workflow Diagrams
Evaluate all advantages of workflow diagram software ConceptDraw DIAGRAM extended with the Workflow Diagrams solution that includes workflow examples and samples, workflow diagram template, a library of workflow diagram symbols and pictorial vector clipart for drawing visual and intuitively understandable Workflow diagrams. Design pictorial Work flow chart or Work flow diagram easier than ever, use them for documentation and implementation purposes, export in a variety of common graphics formats and share with colleagues. Extend the already wide area Work flow diagrams' applications that are used today in the manufacturing industry, software development, HR, medicine, banking and finance sphere, education, military, government, business, e-commerce, and many other fields.
Horizontal Org Flow Chart
This sample was created in ConceptDraw DIAGRAM charting and vector drawing software using the Organizational Charts Solution from the Management area of ConceptDraw Solution Park. The Organizational Chart is a diagram that shows the structure of the organization, different levels of management, hierarchy and relationships of the organization parts.
 Project Management Package
Project Management Package includes a large set of graphical solutions from the ConceptDraw Solution Park. They are selected specially to help in completing the business and management goals, creating business models and modeling business processes, analyzing business progress and efficiency of projects implementation. The tools of this package's solutions are helpful to create number of diagrams and dashboards including Management Diagrams, Business diagrams, Bubble diagrams, Circle-spoke diagrams, Circular arrows diagrams, Venn diagrams, Scrum charts, Kanban boards, Business Intelligence maps, Business Metric charts, Dynamic charts, Project diagrams, Hierarchical charts, Influence diagrams, Work Breakdown Structures (WBS), Resource Breakdown Structures (RBS), PERT Diagrams, Project management charts, Project timelines, Gantt Charts, Funnel diagrams, Stakeholder Onion diagrams, and many more.
Cause and Effect Diagram
ConceptDraw DIAGRAM software extended with Fishbone Diagrams solution from the Management area of ConceptDraw Solution Park is perfect for Cause and Effect Diagram creating. It gives the ability to draw fishbone diagram that identifies many possible causes for an effect or a problem. Causes and Effects are usually grouped into major categories to identify these sources of variation. Causes and Effects in the diagram show relationships among various factor. Fishbone diagram shows factors of Equipment, Process, People, Materials, Environment and Management, all affecting the overall problem.Emergency Action Plan Template
In the case of origin of an emergency is very important to have a correct, clear and comprehensible action plan which will help you to react quicker and to make right decisions. ConceptDraw DIAGRAM software extended with Fire and Emergency Plans solution from the Building Plans Area of ConceptDraw Solution Park provides extensive drawing tools for quick and easy creating fire and emergency plans, and also a set of various templates and samples, among them the Emergency Action Plan Template.
 Line Graphs
The Line Graphs solution extends the capabilities of ConceptDraw DIAGRAM with professionally designed templates, samples, and a library of vector stencils for drawing perfect Line Graphs. Turn your data into a Line Graph with ConceptDraw DIAGRAM software and use it in any document, presentation, report, share it with your team, etc. Building several curves on the same chart, it is recommended to paint them with different colors, this will allow to separate them visually from each other and will make it easier the data comparison.
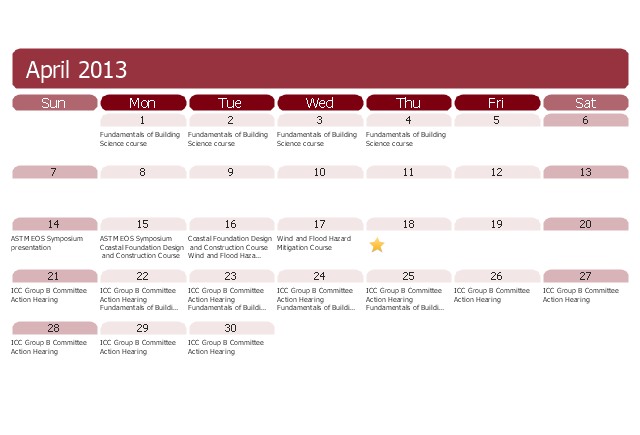
This activities calendar sample was created on the base of figure from the Federal Emergency Management Agency (FEMA) website. [fema.gov/ sites/ default/ files/ images/ 2013_ bld_ sci_ activities_ calendar_ 4-13.jpg]
"The FEMA Building Science Branch provides technical services for the Federal Insurance and Mitigation Administration (FIMA). The branch develops and produces multi-hazard mitigation guidance that focuses on creating disaster-resilient communities to reduce loss of life and property. Building Science Branch activities include deploying Mitigation Assessment Teams to conduct post-disaster engineering investigations for both man-made and natural hazard events. Building Science takes a lead role in developing publications, guidance materials, tools, technical bulletins and recovery advisories that incorporate the most up-to-date building codes, floodproofing requirements, seismic design standards and wind design requirements for new construction and the repair of existing buildings. ... Building Science Branch provides technical support for the National Flood Insurance Program (NFIP) for public and private sector stakeholders, the National Earthquake Hazards Reduction Program (NEHRP), the National Windstorm Impact Reduction Program (NWIRP) and pursuing outreach strategies for communicating building science issues." [fema.gov/ building-science]
The activities calendar example "FEMA Building Science Branch" was created using the ConceptDraw PRO diagramming and vector drawing software extended with the Calendars solution from the Management area of ConceptDraw Solution Park.
How To Create Floor Plans
The use of professional drawing floor plan software is always convenient for all building-related people, primarily for architects and designers. It lets design precise building plans, easy perceived and understandable for all colleagues, clients, and also builders. ConceptDraw DIAGRAM floor plan software is especially useful for quick and easy drawing great-looking designs, floor plans, building plans, layout plans, etc. Thanks to the Floor Plans solution from the Building Plans area of ConceptDraw Solution Park you don't need to be professional artist for drawing. This solution offers a lot of helpful examples and samples of House floor plans, Office floor plans, Salon floor plans, helpful for your independent drawing similar diagrams. Numerous libraries with large quantity of predesigned vector objects included to the Floor Plans solution perfectly suit for creation Architectural house plans, Storage building plans, Commercial building plans, Pole building plans, Blueprints for facilities management, Office space planning and many more without any efforts.
PROBLEM ANALYSIS. Identify and Structure Factors
Identify and Structure Factors. Use the Affinity Diagram to collect and structure factors that impact on a problem. ConceptDraw Office suite is a software for identify and structure factors with affinity diagram. This is a grouping and structuring of factors that impact on a problem.
SWOT Analysis Tool for Small Business
SWOT analysis is effective method of making the plan to evaluate the Strengths, Weaknesses, Opportunities, and Threats involved in a project. SWOT analysis includes the specifying project objectives and attentive identifying the internal and external causes for accomplishing the main project goals. It is actively used in large and small business project management for effective and clear identifying the critical factors. SWOT and TOWS Matrix Diagrams solution is included to ConceptDraw Solution Park and contains the high-quality analysis tools. This graphical solution turns the ConceptDraw DIAGRAM software in an excellent marketing management and advertising agency software, the best SWOT analysis tool for small business or large, as you like and need. Included graphic tools, visual and project planning components make it the best marketing project management software for marketing project planning and for making marketing presentations. Use the ConceptDraw DIAGRAM to create professional and well-designed SWOT matrices in minutes.Building Drawing. Design Element: Piping Plan
When you are going to build a house or to make repairs of new built home, apartment, office, shop, or to renovate any other premises, in many cases you will need to make the package of drawings, plans and documents, including the such important plans as the Overall floor plan, Interior design plan, Ceiling plan, Electrical system plan, and of course the Plumbing plan, Water supply system plan, and Piping Plan. When choosing between the modern software for building construction, planning and design, we recommend you to select the multifunctional building plan software ConceptDraw DIAGRAM enhanced with Plumbing and Piping Plans solution from the Building Plans area of ConceptDraw Solution Park. This solution provides large variety of examples, samples, quick-start templates and libraries of pipes, plumbing and valves vector design elements for design and construction the Plumbing and Piping Plans, schematics and annotated diagrams for hot and cold water supply systems, water lines and waste water disposal systems.
- Management pictograms - Vector stencils library | Management ...
- Emergency management exercise cycle | Fema Logo Png
- Management pictograms - Vector stencils library | Crisis Vector Png
- Project — Working With Costs | Budget Management Png
- Management pictograms | Operations Management Icon Png
- Weather | Emergency management process | Earthquake Effect Png
- DroidDia PRO unlocker | Management Vector Icon Png
- DroidDia PRO unlocker | Pr Management Icon Png
- 25 Typical Orgcharts | Middle Management Icon Png
- Management pictograms | Investment Icon Vector Png


